
Published: February 26th, 2025
The native token of the Quant Network's (QNT), enables a network of distributed ledgers based on the highly modular design of Overledger. QNT is utilized for transactions across the different multichain apps (MApps) being created by businesses and blockchain developers on the Quant Network, and it has a maximum supply of 14,612,493 tokens.
QNT is used for a number of things, such as yearly licensing and platform fees. QNT is also an option for investors looking to increase their capital potentially. The basic design of QNT, an ERC-20 token developed on the Ethereum network, facilitates the creation of additional QRC-20 tokens via Quant Network's Tokenize platform.
Investing in a crypto token requires a systematic approach. The following QNT technical analysis shows the broader market outlook of QNT/USDT.
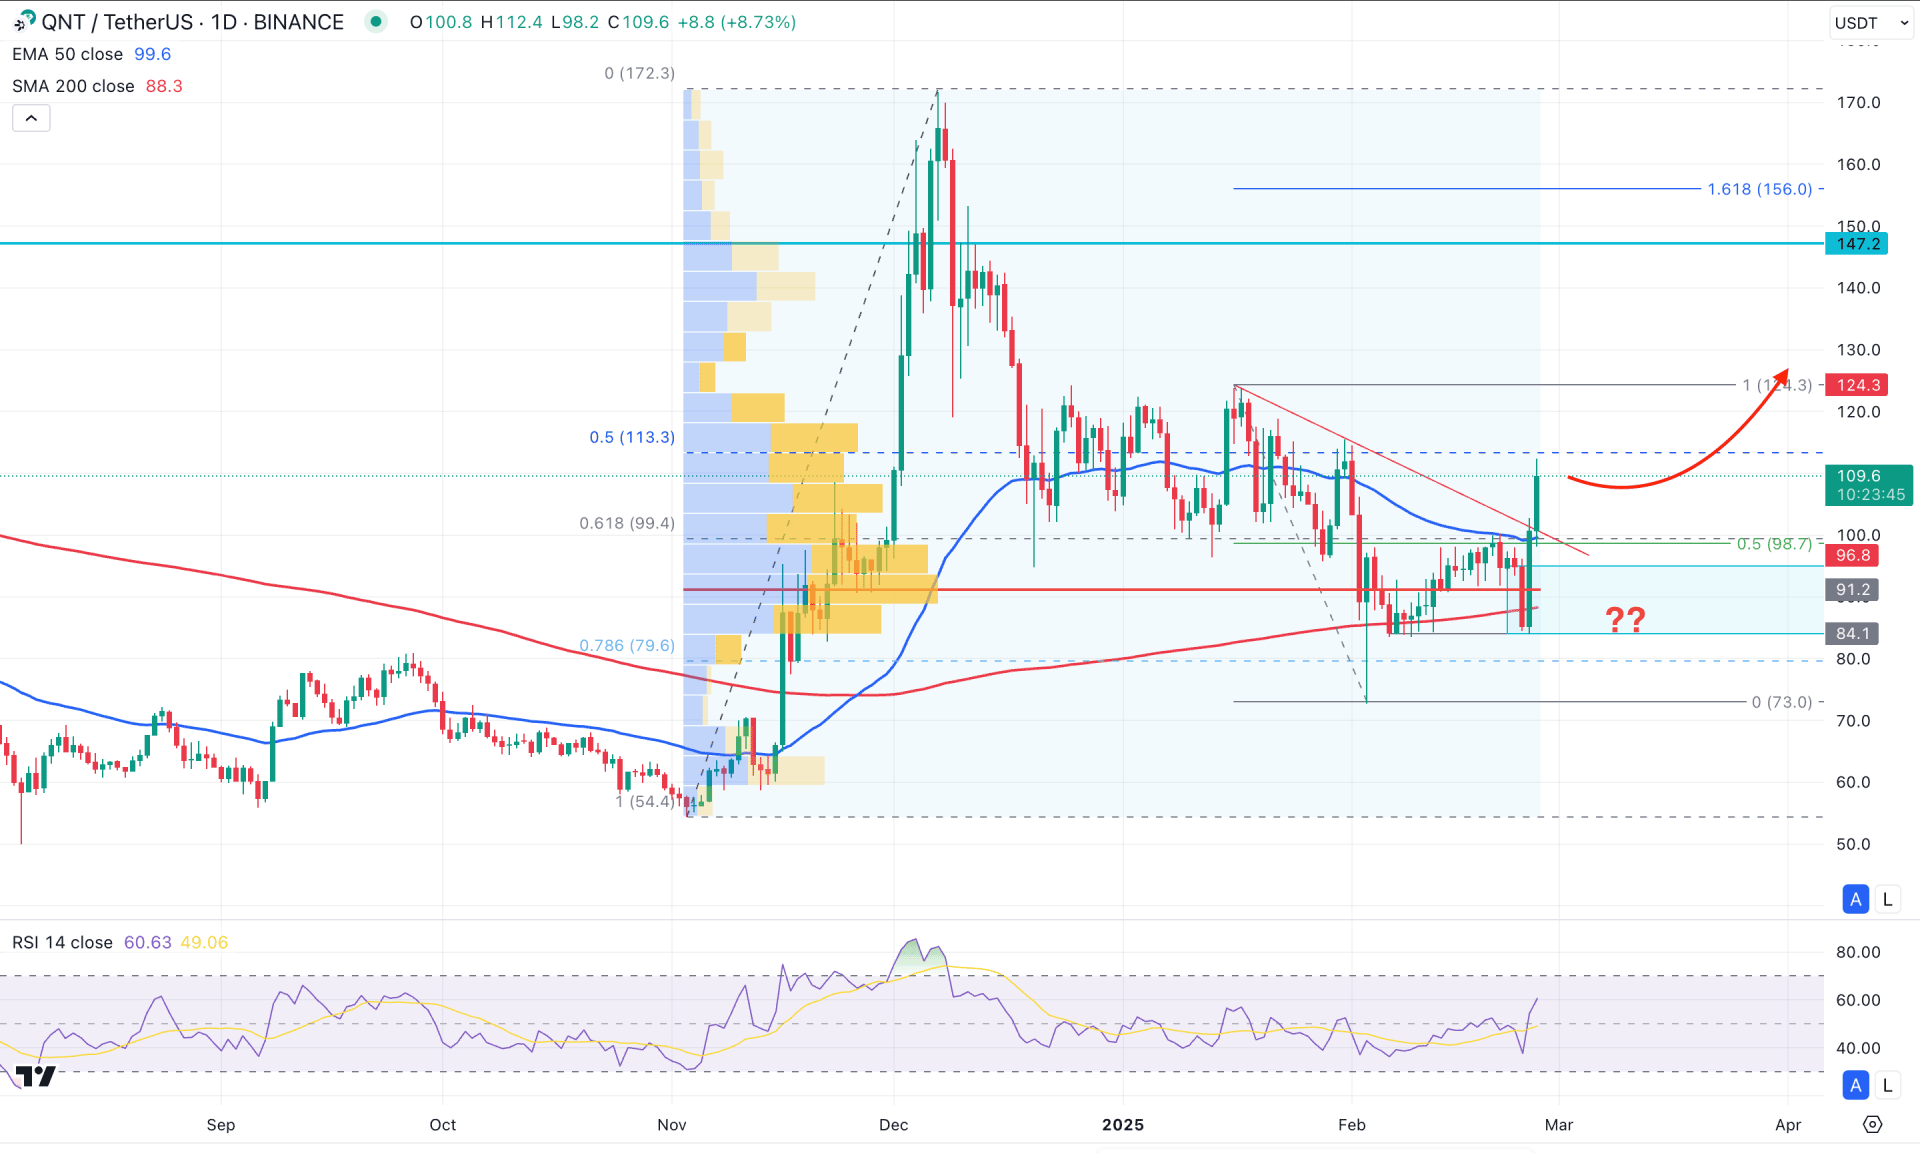
In Quant's daily chart (QNT/USDT), an ongoing bullish trend is visible. After reaching a multi-year high, the price showed a decent pullback from the 172.30 level. However, the speed of the downside correction was very corrective, signalling profit-taking, from which a bullish continuation is likely to occur from a suitable price zone. In that case, investors should look for bearish exhaustion at the discounted zone, with a potential bullish reversal candlestick, before aiming for a long wave.
Looking at the higher timeframe, the bullish spike above the 2024 high failed to form a valid monthly close. However, a "pump and dump" scenario is questionable, as the price showed sufficient buyer interest in January 2024, which closed as a bullish month. In the current month, strong selling pressure has appeared, wiping out buyers from the market, but the price has recovered above the January 2024 low.
The volume structure is also positive for bulls, as the most active level since November 2024 has been at the 91.20 level. The ongoing weekly candle is already heading upward, rejecting bears from the high-volume area.
In the main price chart, a bullish reversal with an engulfing candlestick pattern is seen from the 200-day Simple Moving Average. Moreover, upward continuation is clear above the 50-day Exponential Moving Average, signalling a strong bullish trend. A breakout from the trendline is also visible, but investors should monitor how the price holds above the trendline resistance before confirming the bull run.
In the indicator window, a bullish recovery is seen from the 50.00 RSI point, which serves as an additional bullish continuation signal.
Based on the daily market outlook of Quant, a bullish break of structure with a candlestick close above the 50-day EMA increases the likelihood of upward movement. However, downside recovery is still pending, with the 98.70 to 85.00 area being a crucial buy zone, depending on how the price reacts in that area. On the bullish side, overcoming the 124.30 resistance level could be a significant achievement, which could extend the buying pressure toward the 156.00 key extension level.
On the bearish side, a failure to hold the price above the 200-day Simple Moving Average could be challenging for bulls. Any immediate downside reversal below the 50-day EMA could lower the bullish possibility, and a daily candle below the 80.00 level might invalidate it. In that case, selling pressure might extend to the 60.00 level before offering a long movement.
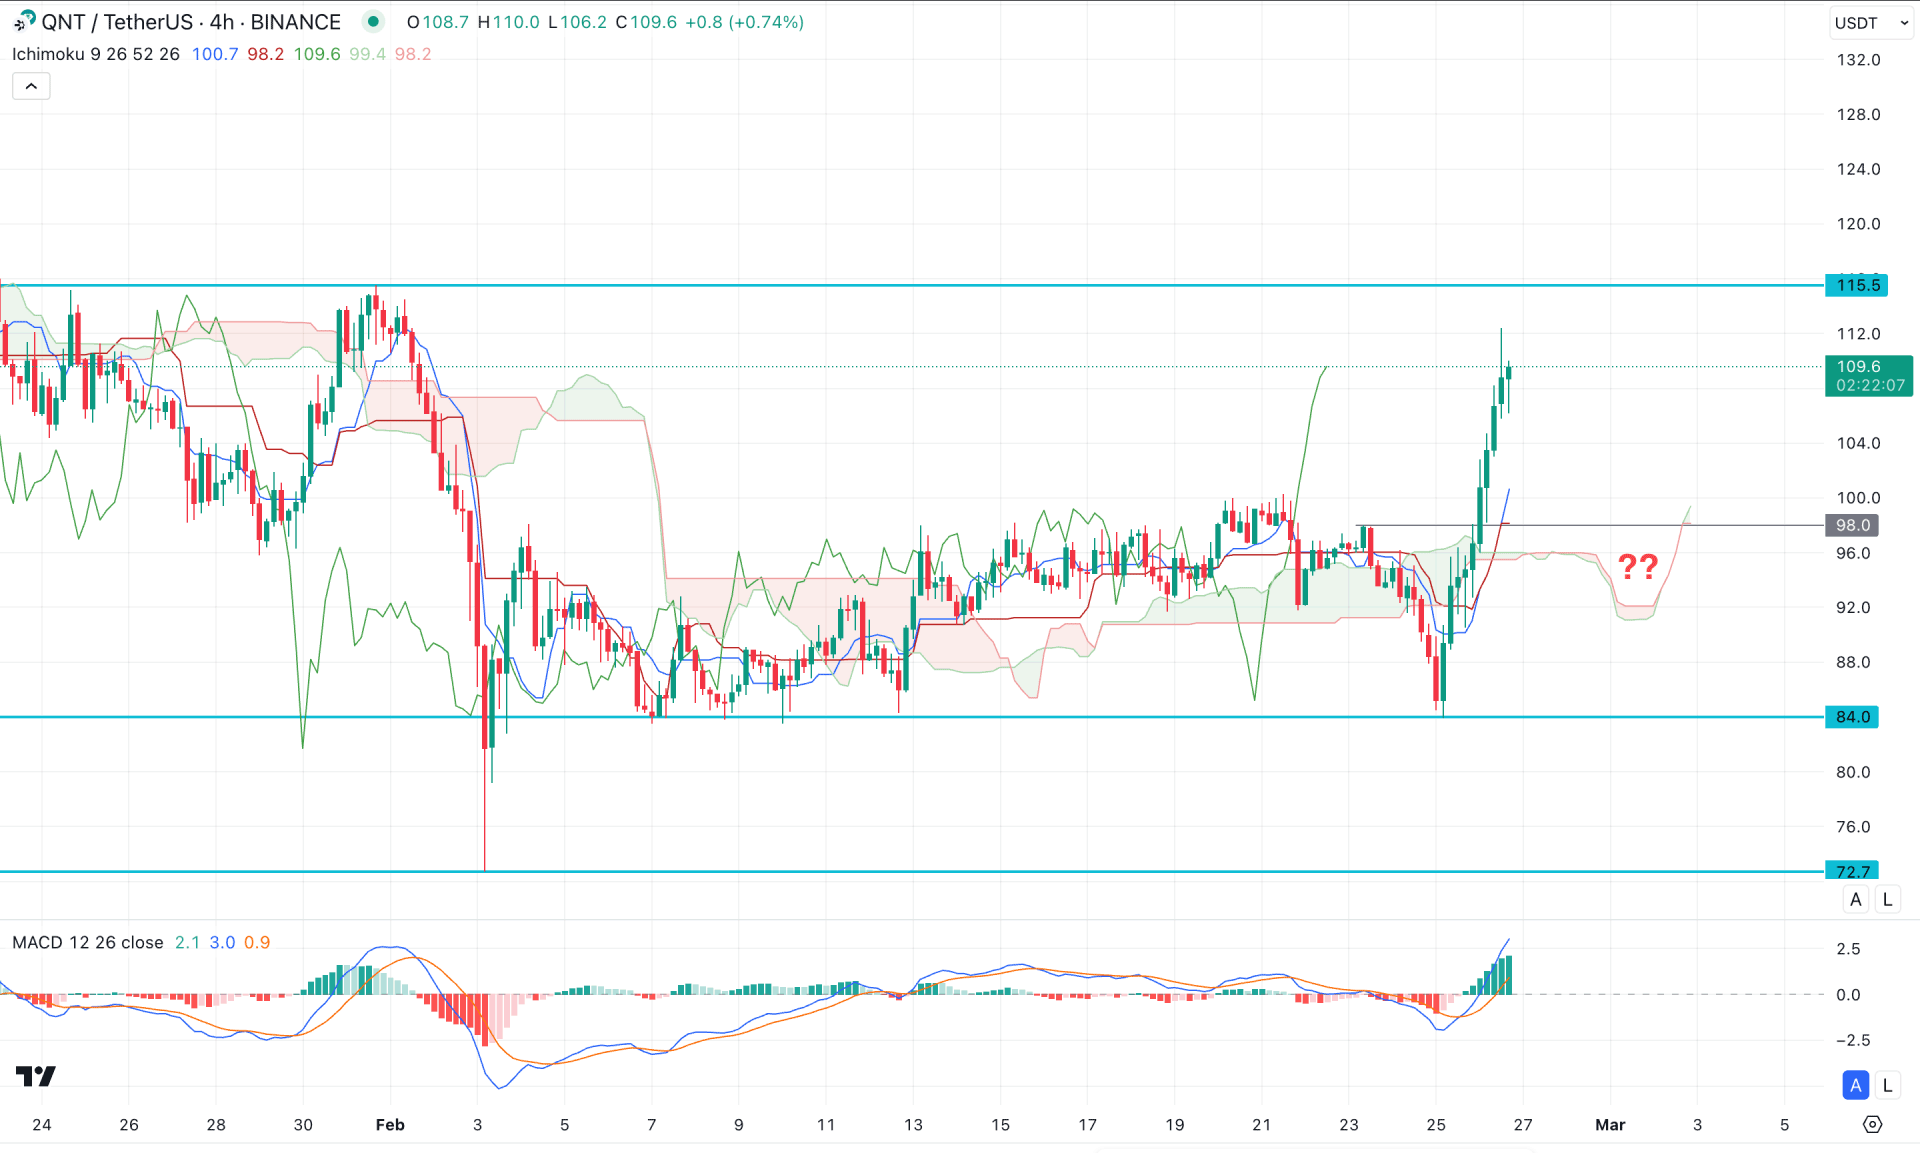
In the H4 timeframe, the recent price action shows a reversal above the Ichimoku Cloud support, suggesting a potential reversal. In this case, the primary aim is to find long opportunities as long as the cloud area acts as support. Additionally, the future cloud is positive, with both lines pointing north.
In the indicator window, the Moving Average Convergence Divergence (MACD) shows bullish momentum as the vertical line is above the neutral point. Based on the H4 outlook of QNT/USDT, the current market trend is bullish, and any bullish setup could work well as long as the price remains above the 108.00 key support level. The ideal trading approach is to look for a channel breakout or a strong bullish rejection from the dynamic Kijun Sen support.
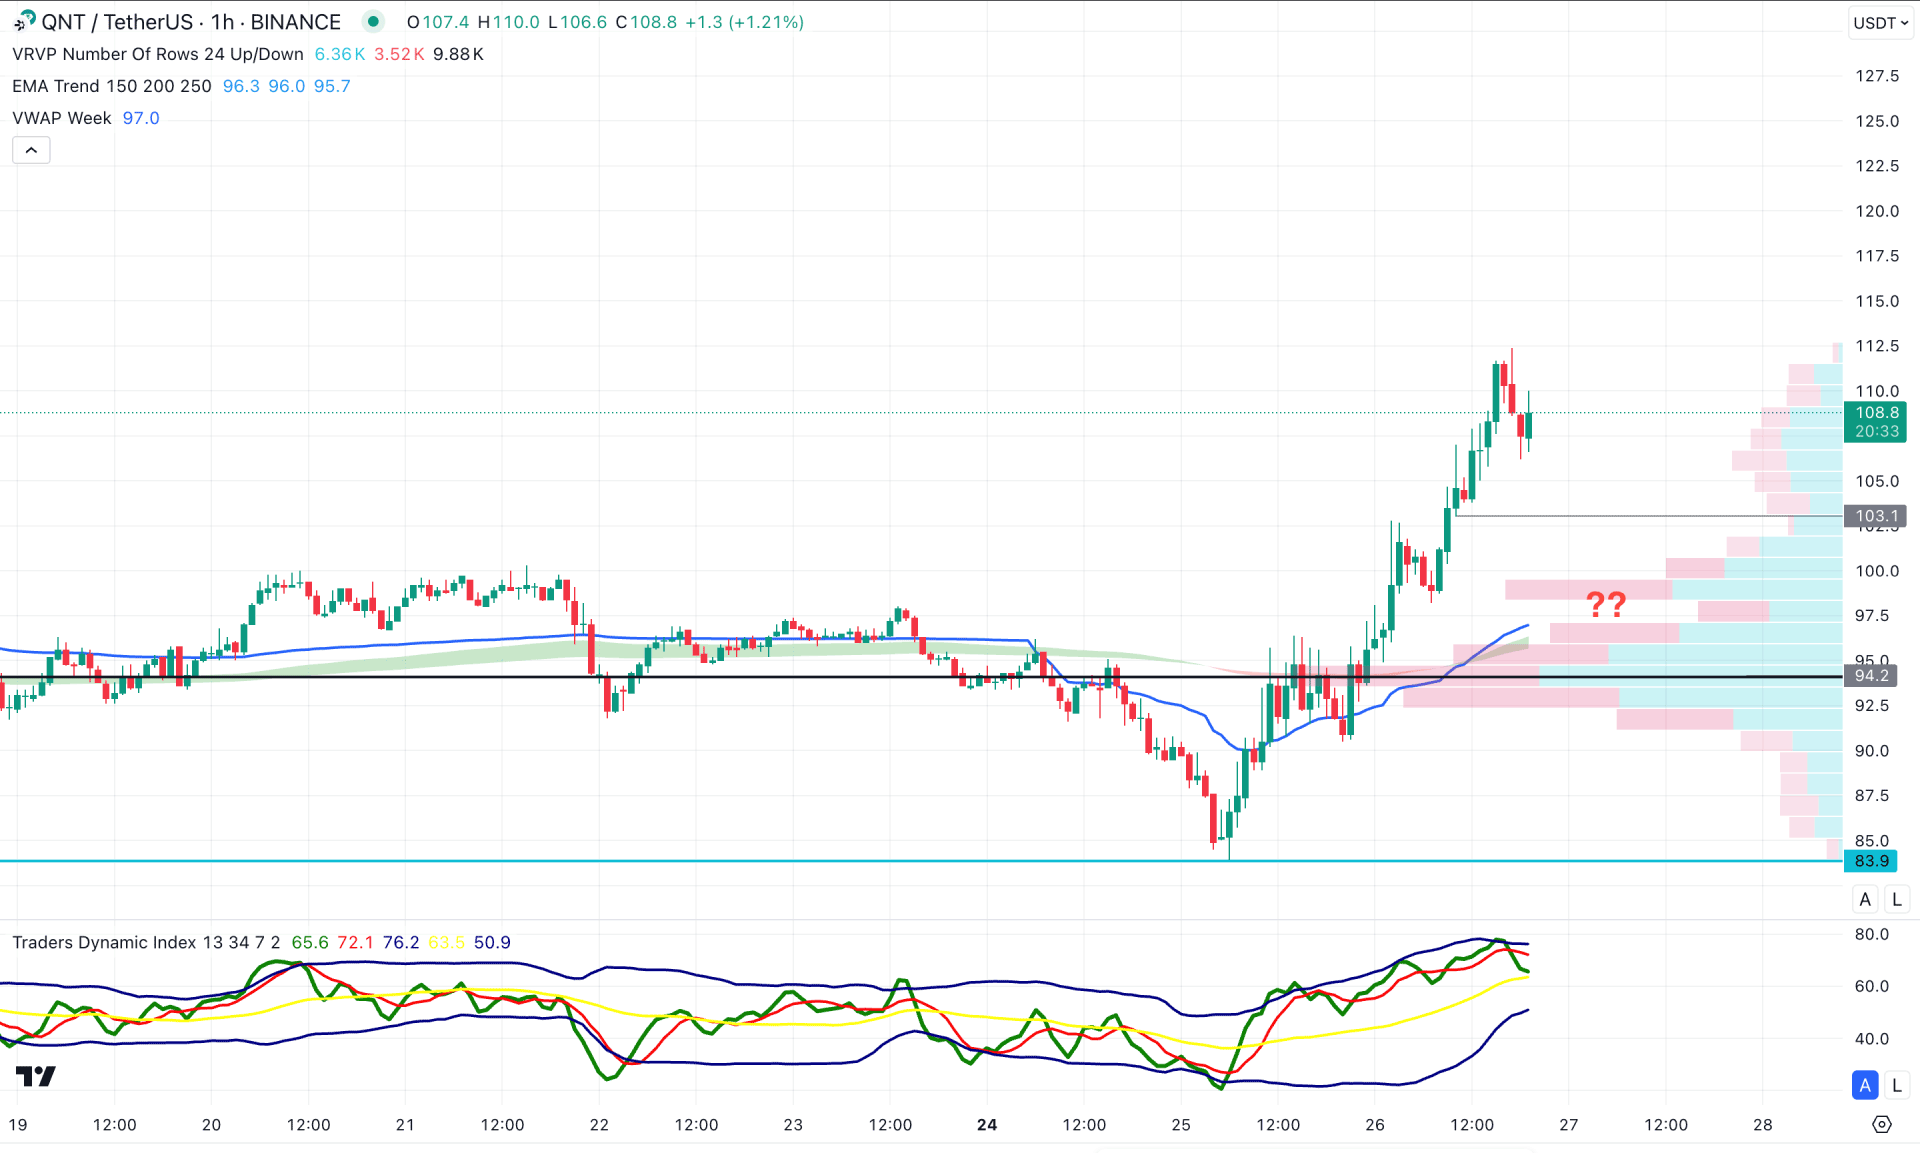
In the H1 timeframe, the recent price showed a strong bullish reversal where the current price is hovering above the existing intraday swing levels. In that case, a sufficient downside correction is needed from that area before anticipating a tend extension.
In the main chart, the visible range high volume line is below the current price, working as a support. Moreover, the Moving Average Wave is also below the current price with a bullish crossover with the weekly VWAP.
Based on this outlook, the Traders Dynamic Index (TDI) has reached the overbought level, suggesting a primary overbought condition. In that case, a bearish H1 candle below the 103.10 level could be a short-term bearish opportunity.
However, a bullish reversal from 100.00 to 90.00 is a buy zone, and a valid bullish reversal from there could be an intraday long opportunity.
The broader outlook of Quant (QNT) is bullish, but proper validation is needed before opening a long trade. A sufficient downside correction with a valid price action from the discounted area could be a high probable long opportunity, following the major trend.


