
Published: March 6th, 2024
Qorvo disclosed its most recent earnings performance on January 31, 2024, wherein it achieved an earnings per share (EPS) of $2.1, exceeding the consensus estimate of $1.65.
In the ongoing fiscal year, analysts project that Qorvo will generate revenues of $3.74 billion and earn $6.03 per share, representing an increase of 1.86 percent in earnings per share and 4.8 percent in revenues, respectively. Anticipating the forthcoming fiscal year, the organization anticipates generating $4.11 billion in revenues and earning $7.79 per share, representing significant year-on-year growth of 29.23% and 9.74%, respectively.
An imperative factor to contemplate at this moment is the evaluation of valuation metrics in order to ascertain whether the organization may encounter a decline from its present position.
The stock is currently valued at 19.8 times the anticipated earnings per share for the current fiscal year, which deviates from the industry average of 19.8 times. When considering trailing cash flow, the stock is valued at 13.7 times, comparable to its peer group's average valuation.
Furthermore, it possesses a PEG ratio of 1.02. However, compared to the securities we cover, these figures do not place the company among the top-tier stocks in terms of value.
Let's see the upcoming price direction of this stock from the QRVO technical analysis:
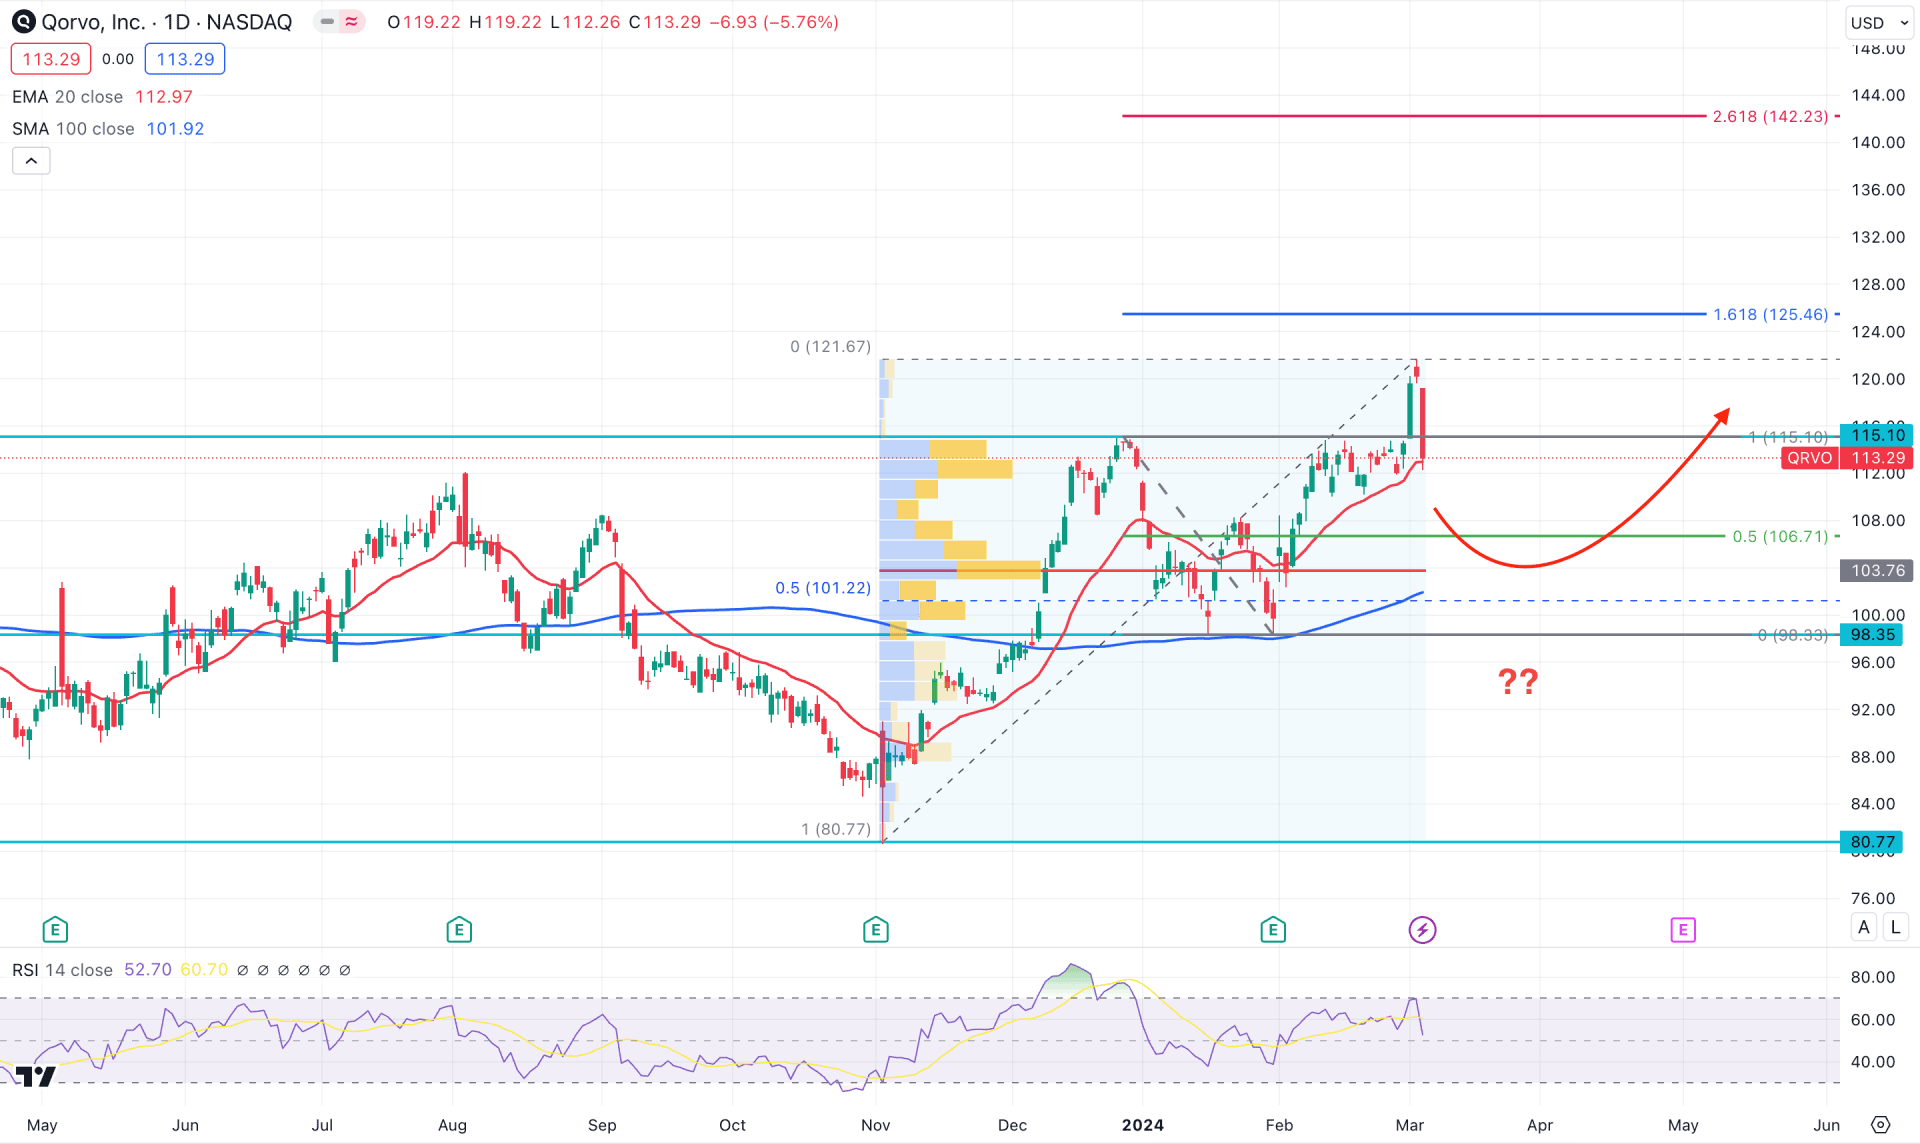
In the daily chart of QRVO, the broader market context is bullish, where the most recent daily candle showed a counter-impulsive bearish pressure. In this context, investors should closely monitor how the price reacts in the near-term area to find a bullish reversal signal.
In the higher timeframe, the February 2024 close was optimistic for bulls as it came with a bullish pre-breakout structure. Although the monthly candle failed to close above the 115.10 key resistance level, the bullish candle closed with a stable momentum above the 100-week SMA, which could form an upward continuation signal.
In the volume structure, the most active level since 02 November 2023 is below the current price. It is a sign that bulls are still active in the market and can initiate an upward continuation at any time. Moreover, the high volume level of 103.76 is above the existing base of 98.03 static line, which works as a confluence bullish factor.
Considering the latest bearish daily candle, which came with a 5.08% loss, is a crucial factor to consider before finding a long opportunity. Despite the loss, the current price still trades above the dynamic 20-day EMA, supported by the rising 100-day line.
On the other hand, an RSI divergence is visible as the recent line failed to follow the higher high formed in the price swing. Moreover, the latest reading showed a recovery below the 70.00 line, suggesting an early sign of possible downside pressure.
Based on the daily outlook of QRVO, an immediate selling pressure might take the price towards the 106.71 level, but it might not be sufficient to anticipate a trend change. An upward continuation might come after having a recent bullish reversal from the 108.00 to 100.00 zone with a daily close above the 20-day EMA. In that case, the next resistance level would be the 142.23 Fibonacci Extension area.
On the bearish side, a deeper discount with a bearish daily close below the 98.35 level could be a strong bearish signal, targeting the 70.00 level.
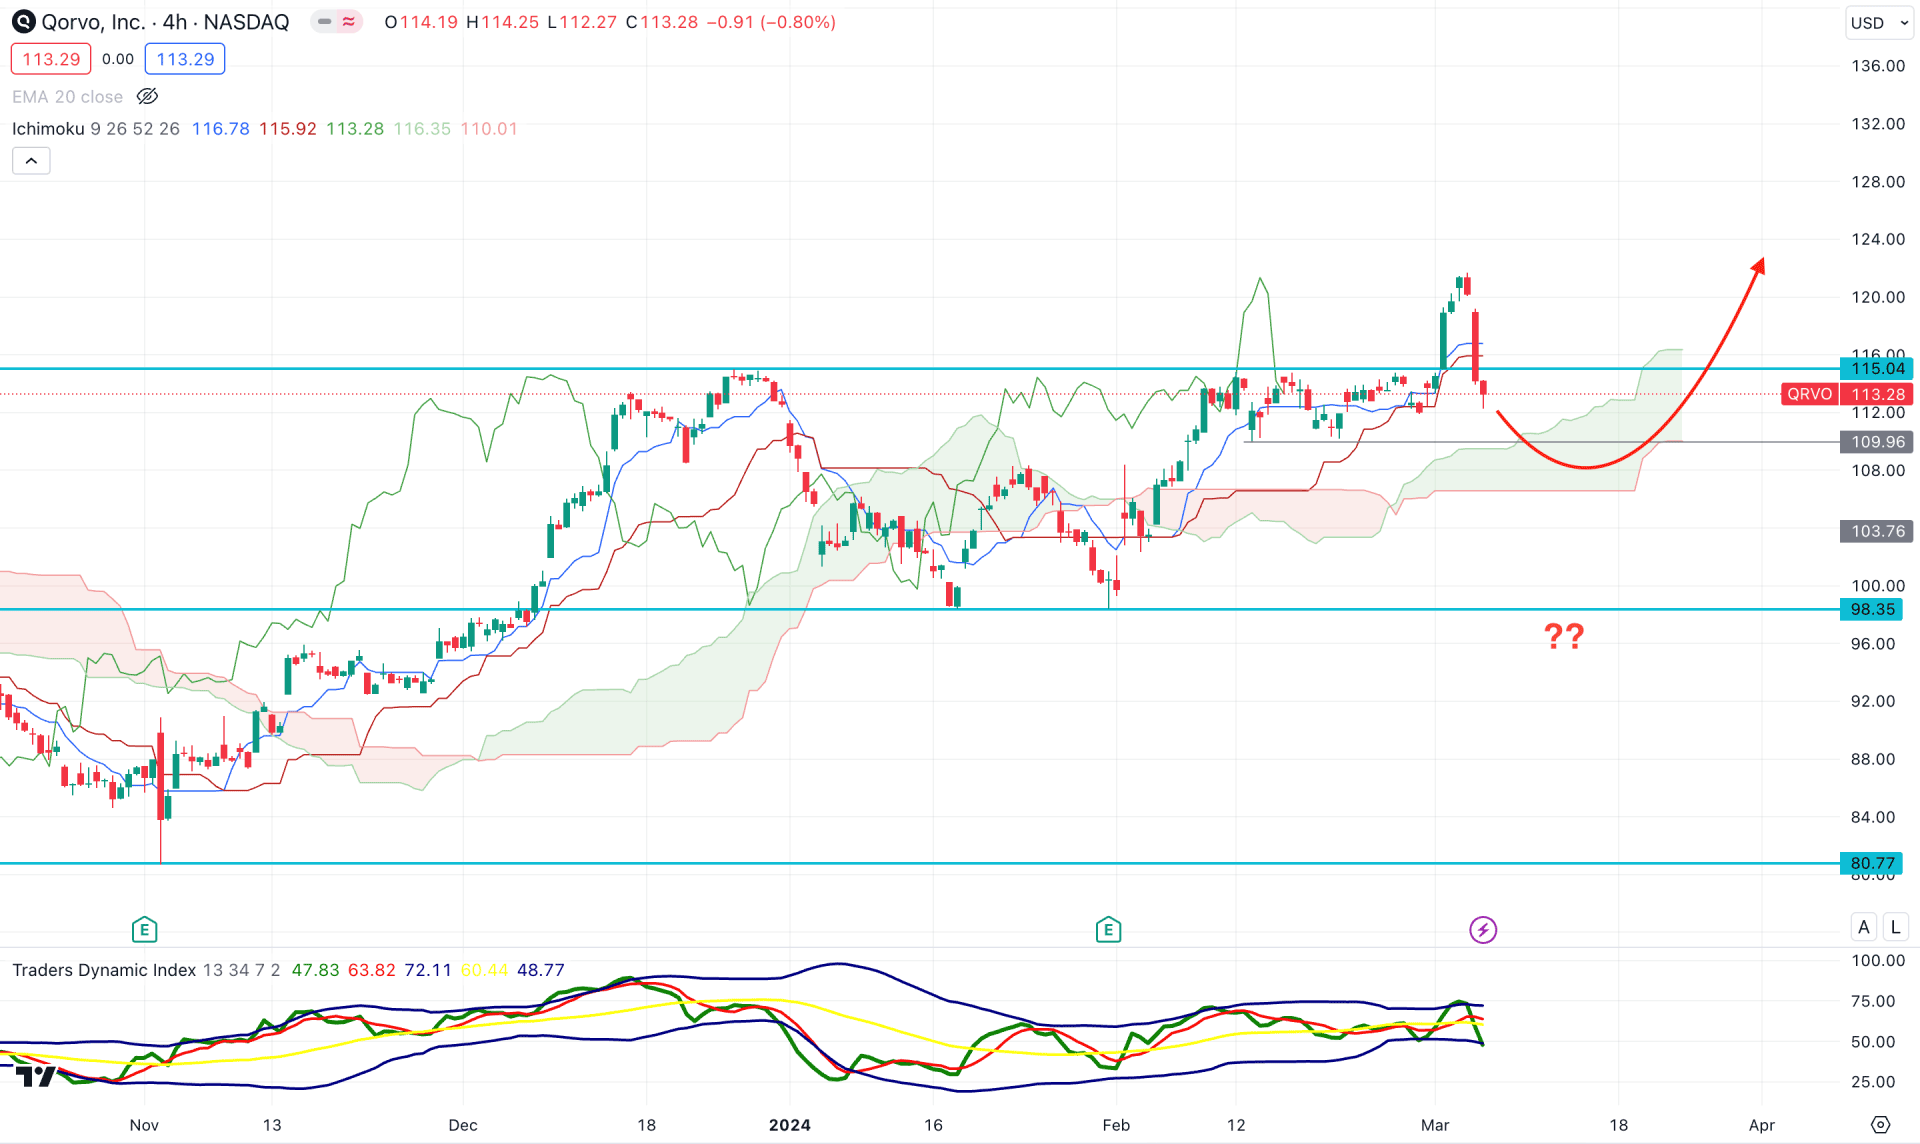
In the H4 timeframe, strong selling pressure is visible from the 121.69 high, which pushed the price below the dynamic Kijun Sen line. Moreover, the future cloud is still bullish, with no sign of a bearish reversal.
In the indicator window, an ongoing selling pressure is visible from the Traders Dynamic Index indicator. As per the current reading, the recent TDI line shows a downside pressure below the 50.00 line, which is the sellers’ zone.
Based on the H4 outlook, QRVO price is more likely to extend the buying pressure after having a solid rebound from the 109.96 static level.
On the other hand, a deeper downside correction with a bearish reversal below the 100.00 psychological level could be a potential bearish opportunity, targeting the 80.00 psychological level.
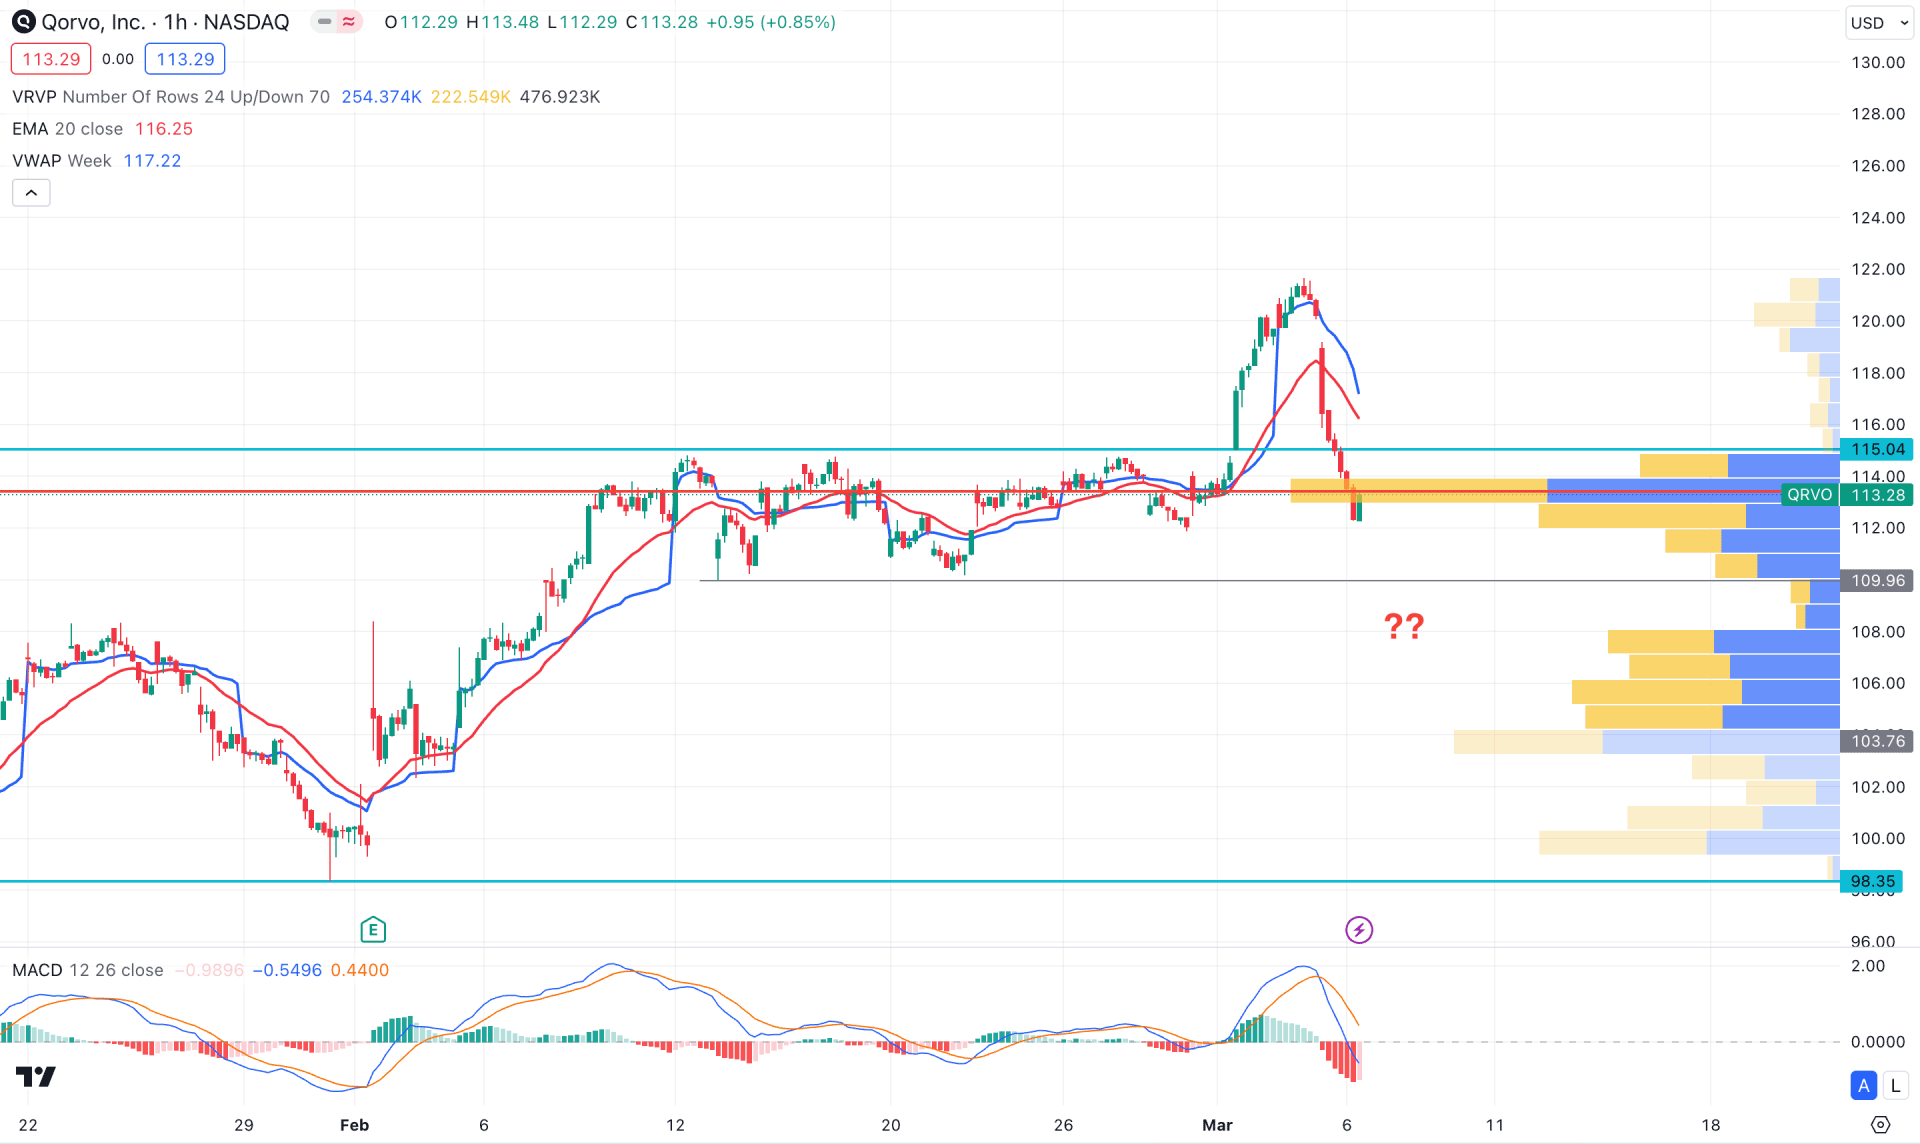
In the hourly time frame, the recent price shows a decent bearish pressure from the intraday high and reached the existing high volume level. Moreover, the downside pressure has come with a bearish breakout from the dynamic 20-day EMA line.
In the secondary window, downside pressure is visible from the MACD Histogram, which made a significant low below the neutral line. In that case, a bearish continuation with an hourly candle below the 109.96 level could be a short opportunity in this stock.
On the other hand, any bullish rebound with a corrective market above the 20 EMA might extend the momentum in the coming hours.
Based on the current market outlook, the QRVO stock is more likely to form a decent bearish correction before continuing the existing bullish trend. In that case, investors should closely monitor the intraday support areas to find the best place to open the long position.


