
Published: April 28th, 2026
The sudden surge of Pudgy Penguins might constitute a breakout caused by ecosystem momentum. On-chain data suggests that long-term investors have benefited in unanticipated ways from this transition.
Analysts refer to the voucher released on April 17, when around 703 million PENGU, or 0.79% of the approximately 88 billion total supply, entered the market in an individual tranche. After receiving 182.8 million PENGU, the main unlock wallet distributed them across 19 other addresses in about 50 minutes.
Alongside it, the futures market shifted. During the surge, the average open interest in PENGU increased from roughly $36 million to $59 million, with numerous short squeezes intensifying the upward momentum.
When open interest grows in tandem with price, it typically indicates that traders are opening fresh long-term positions rather than closing existing ones. Open interest is a measure of the total value of standard futures contracts that remain open in the market.
Let's see the upcoming price direction from the PENGU/USDT multi-timeframe analysis:
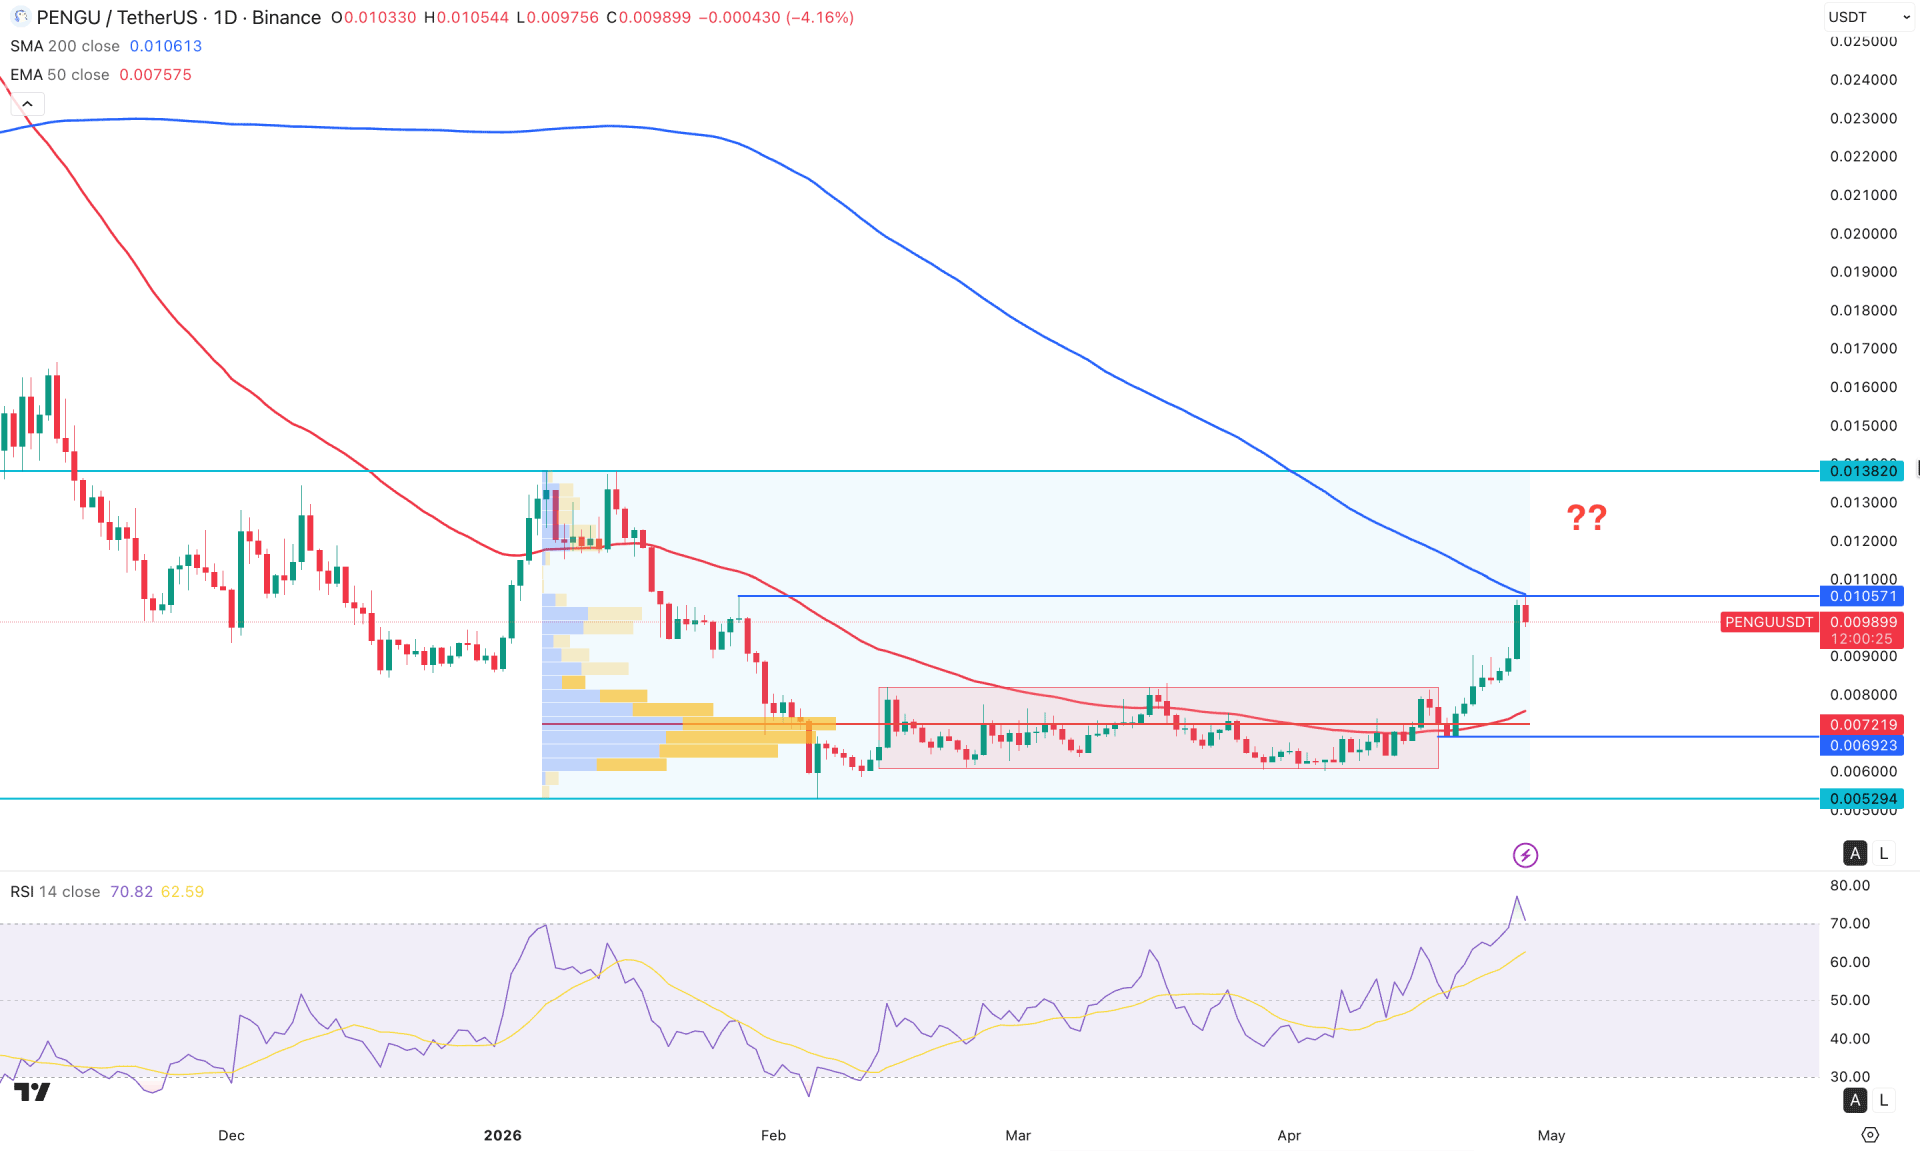
In the daily chart of PENGU/USDT, the recent price shows a valid bullish rebound with a rectangle pattern breakout. The existing price chart suggests that the price has rebounded from a record low, which could be a remarkable achievement for buyers.
In the higher timeframe, the monthly price suggests ongoing buying pressure for the first time since the last eight months. However, the month is yet to close, and investors might wait for a monthly close before validating the bullish rebound. The weekly price is also supportive for buyers, as three consecutive bullish weekly candles are present after two consecutive gravestone doji formations at the bottom.
In terms of volume, the buying pressure is also valid, as the largest activity level since the beginning of 2026 is at the 0.007219 level, which is within the rectangle pattern bottom. Moreover, the rectangle pattern breakout came after testing a high-volume support level, which signals a confluence of buying pressure.
In the main price chart, the rebound from the rectangle pattern bottom is valid, as the bullish breakout came with impulsive momentum. However, the price found resistance at the 0.010571 level, which aligns with the 200-day simple moving average. Primarily, the price is facing strong resistance at that point, which must be breached before further upward pressure is expected.
On the other hand, the 50-day EMA is the immediate support level to look at, which has a bullish slope from the high-volume area. As there is a gap between the price and the 50 EMA, it has expanded, creating a decent pullback correction possibility.
In the indicator window, the relative strength index is above the 70.00 overbought line for the first time in a year. It is a sign of an extreme bullish condition that signals a moderate bearish correction possibility. However, the strength of the trend looks positive, as the directional index is currently marked at the 32.78 level, which is above the 20.00 satisfactory point.
Based on the overall daily market outlook, the recent bullish rectangle pattern breakout is valid, but a proper downside correction with a retest is pending before anticipating a long wave.
As the most recent price found resistance at the 0.010571 level, investors might expect downside pressure from this area, where the 50 DEMA would be the immediate target level to look at. However, an immediate bullish breakout above the 200 SMA level could offer a strong bullish opportunity, with a target of testing the 0.013820 level.
The conservative approach is to wait for the price to test the rectangle resistance, which will become support. In that case, the 0.008000–0.006923 area would be a valid buying zone with confirmation from price action.
A failure to hold the bullish momentum at the 0.007219 high-volume line could be a challenging factor for buyers, as it could validate a pump-and-dump scenario and test the 0.005294 key support level.
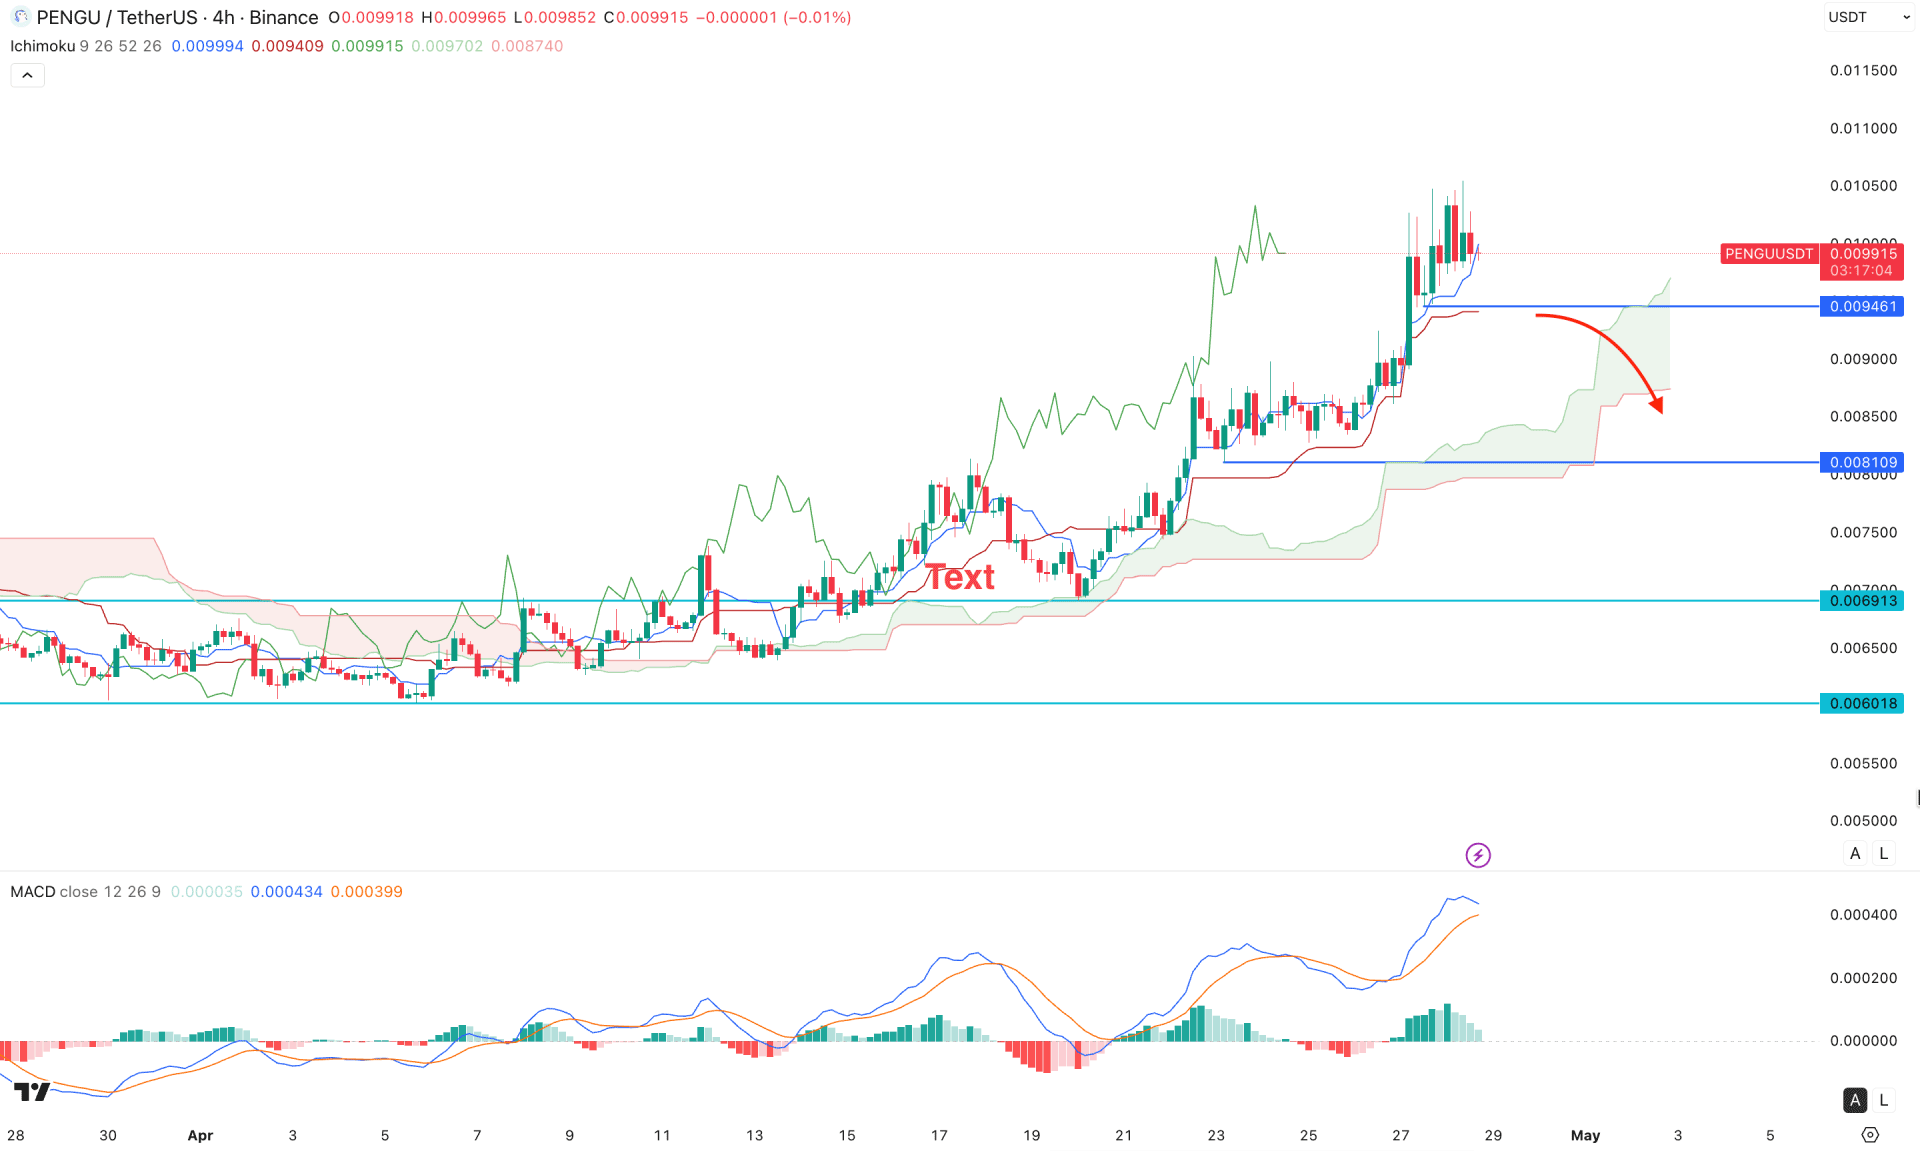
In the four-hour timeframe, the PENGU/USDT price is trading within buying pressure, and the most recent price is trading at the recent high. Primarily, the price is overextended at the top, with high volatility, signaling a decent correction.
As per the current structure, the price is hovering above the Kumo cloud support area for a considerable time, signaling a strong and stable bullish trend. Moreover, the future cloud is solid, as both lines are heading upward with strong thickness.
Also, the price is trading above the near-term support level, which is working as an additional bullish factor. However, the MACD histogram shows signs of a bearish correction, as it failed to hold above the neutral level while creating a new high. As a result, the MACD signal line has followed the momentum by becoming flat at the highest level of the month.
Based on this outlook, a bullish continuation opportunity is valid, where the immediate support is located at the 0.009461 level. A valid bullish reversal from this dynamic support level could extend the price toward the 0.011500 area.
On the other hand, a break below the 0.009461 support level could increase the possibility of testing the 0.008109 support level. Another bullish opportunity is present from this price range, but a failure to hold the price at this level could initiate extended selling pressure below the 0.006913 key support level.
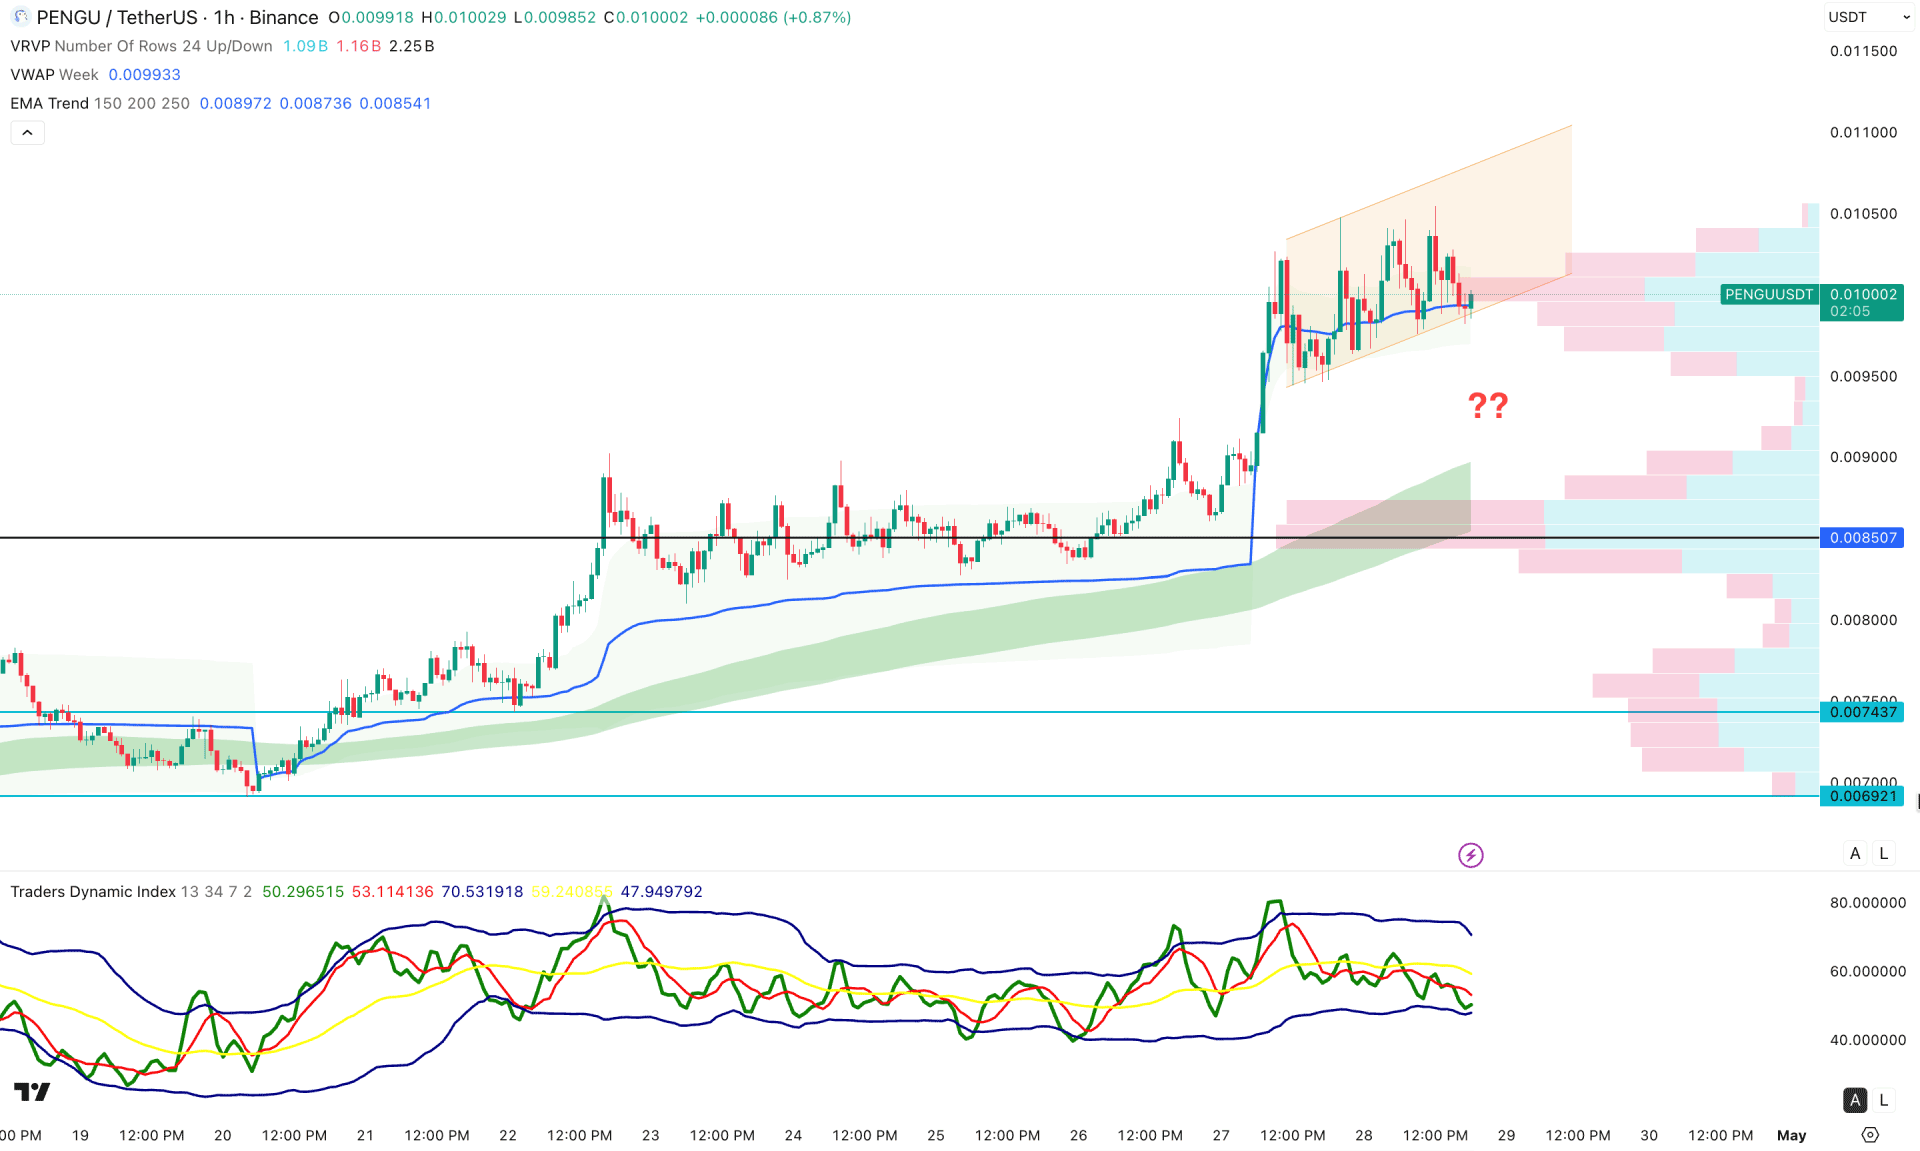
In the hourly timeframe, the price is trading within an ascending channel, and the most recent price is facing support at the channel.
The weekly VWAP level is the immediate support, from which a reversal candlestick is visible. However, the gap between the current price and the high-volume line has expanded, creating a possibility of a downside correction to fill the imbalance.
The EMA wave is also below the current price with a bullish slope, signaling major support.
The indicator window shows a similar story, where the current dynamic index is below the 50.00 neutral line with a sideways movement. It is a sign that the ongoing buying pressure within the ascending channel is having corrective momentum based on investor activity.
Based on the hourly market outlook, PENGU/USDT is trading within a corrective phase from higher levels. A failure to hold the price at the channel support could create an immediate short opportunity targeting the 0.009000 level.
On the other hand, the current market momentum is bullish at the channel support, which can extend the bullish move above the 0.010500 level.
Based on the overall market structure, PENGU/USDT is trading at the premium zone from where a decent downside recovery is possible. As the long-term market trend is still bearish, sufficient liquidity grab is pending before forming a long opportunity.


