
Published: September 3rd, 2025
Recently, Mythical Games, the developer of FIFA Rivals and the well-known NFT franchise Pudgy Penguins, announced the global release of its web3 smartphone game, Pudgy Party.
According to an announcement made to The Block, Pudgy Party is a fun party-royale game set in a world of thrilling mini-games, featuring a cast of well-known Pudgy Penguins figures with unique personalities, abilities, and quirks. To ensure that none of the parties are the same, each match is designed to appear novel and unpredictable, complete with evolving challenges and unexpected twists.
May 2024 saw the initial release of the Pudgy Party game's plans. A soulbound token known as "Earlier to the Party" was sent to pre-registered users earlier this week, granting them a non-transferable digital badge until the launch.
Pudgy Party, which can be downloaded for free on Android and iOS, comes after Pudgy Penguins released its PC game Pudgy Worlds, its Solana-founded PENGU token, and its penguin plush toys and other collectibles at Walmart outlets last year.
Based on floor prices, Pudgy Penguins is currently second in terms of NFT collections, according to The Block's statistics dashboard. With a market capitalization of $417.4 million, it is ranked fourth, while the benchmark is valued at $2.1 billion.
Let's see the future price of this coin from the PENGU/USDT technical analysis:
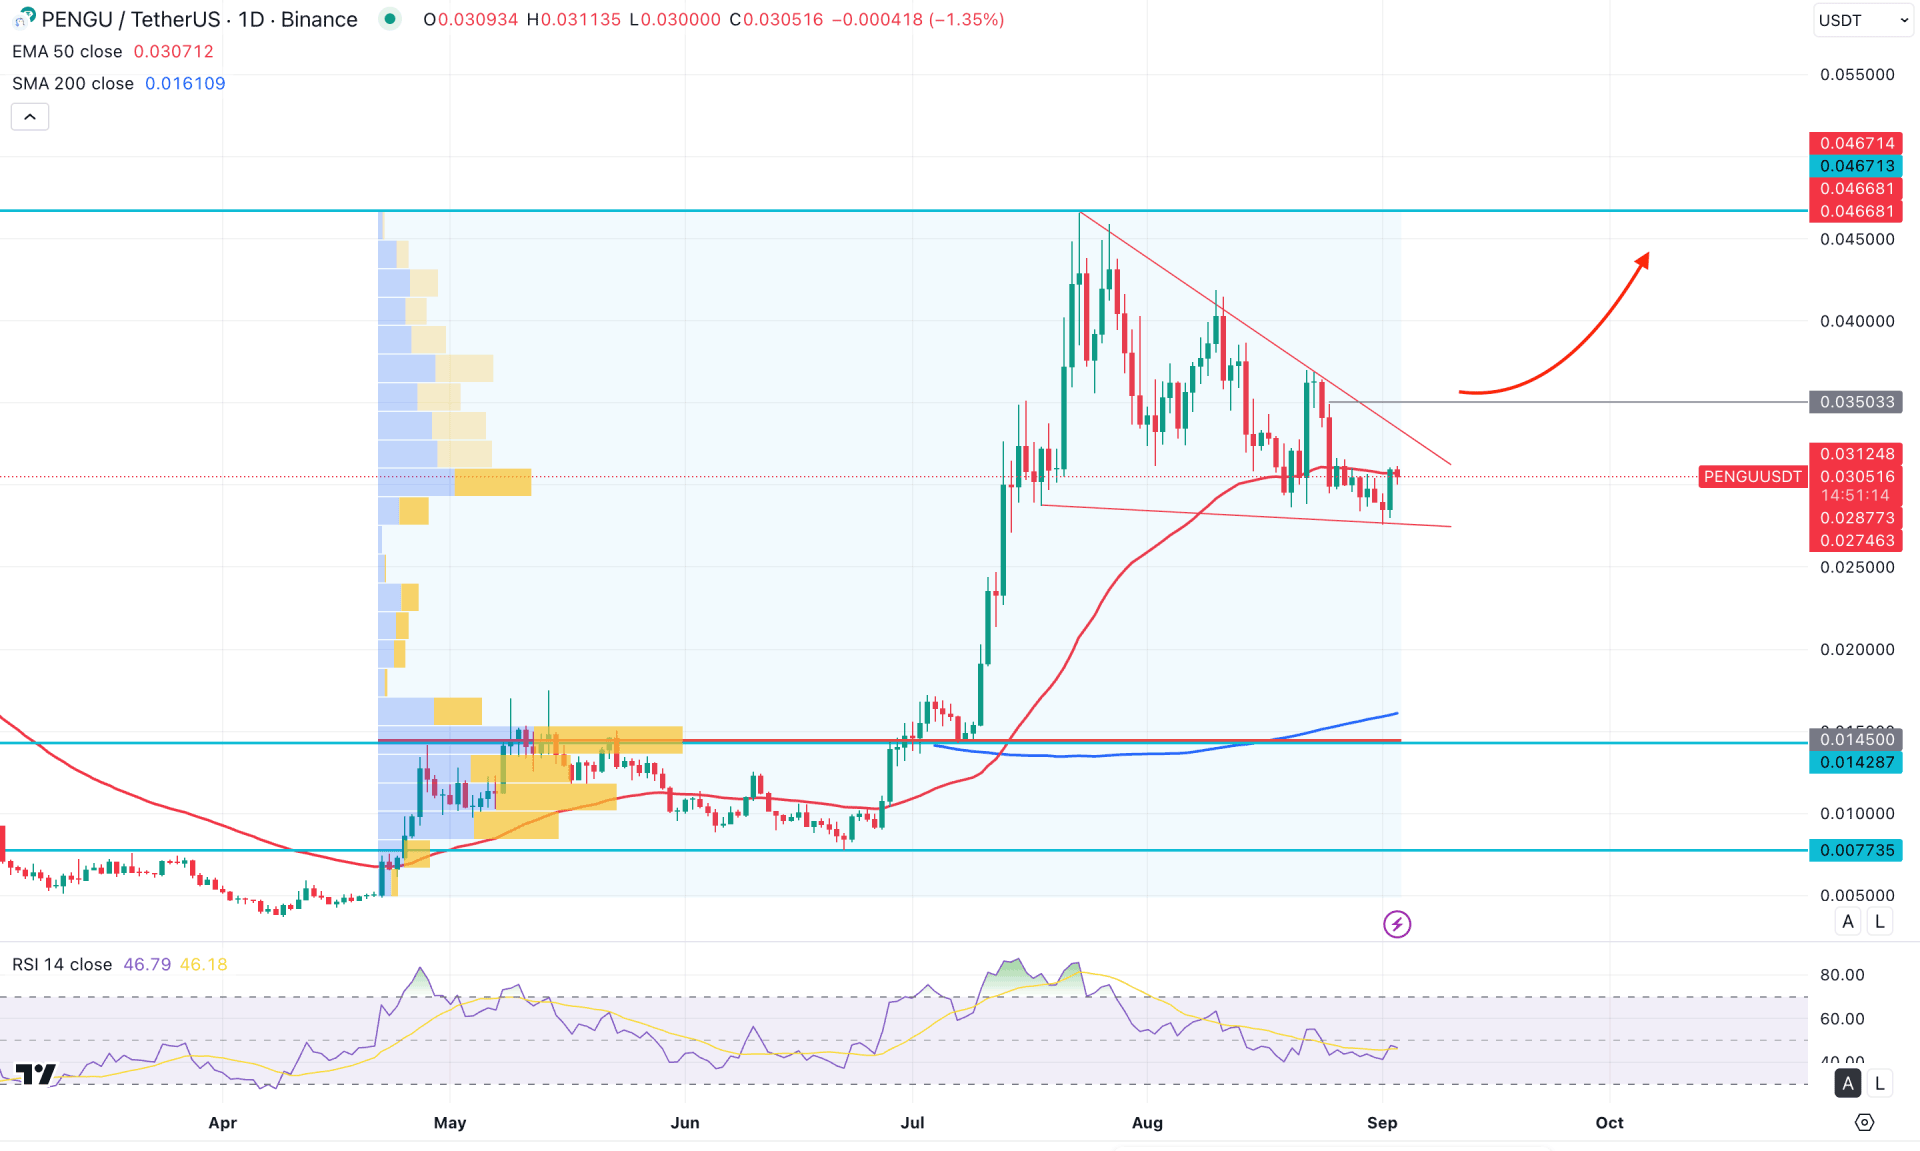
In the daily chart of PENGU/USDT, the overall market momentum remains bullish, despite a notable correction from the 0.04675 level. The sideways price action suggests a phase of accumulation, which may signal potential for upward movement in the coming days.
In the longer term, the bullish rebound from July 2025 remains solid. Although the latest monthly candle formed a bearish hammer, it is trading as an inside bar. In this case, a bullish breakout above the 0.0338 monthly flip zone could indicate a valid trend reversal.
From a volume perspective, the price is trading within the buyers' zone, as the highest activity levels from September 2024 are well below the current price. Overall, the price remains above the key high-volume area, indicating potential for a bullish continuation from the reaccumulation phase.
On the daily timeframe, the 200-day simple moving average is well below the current price, indicating potential for further downside correction before resuming its upward trend. However, the price is currently struggling to hold above the 50-day exponential moving average, where the latest daily candle closed as a bullish engulfing pattern. Although the price is still trading below the 50-day EMA, investors should closely monitor whether it can sustain above this level.
In the secondary indicator window, the Relative Strength Index (RSI) shows a possible downside correction. While RSI has recently rebounded from the overbought 70.00 level, further pressure may remain before buyers regain full control.
Based on the broader market outlook, momentum is currently sideways and could extend the correction in the coming days. In that case, the primary focus should be on a potential short-term correction if the price fails to hold above the 50-day EMA. Immediate support is located near the 0.02400 level, with further downside potential toward the 0.0145 area.
On the bullish side, a valid breakout above the 0.0350 level would open a long opportunity. In that case, the price is likely to continue its bullish run toward and beyond the 0.0466 resistance level.
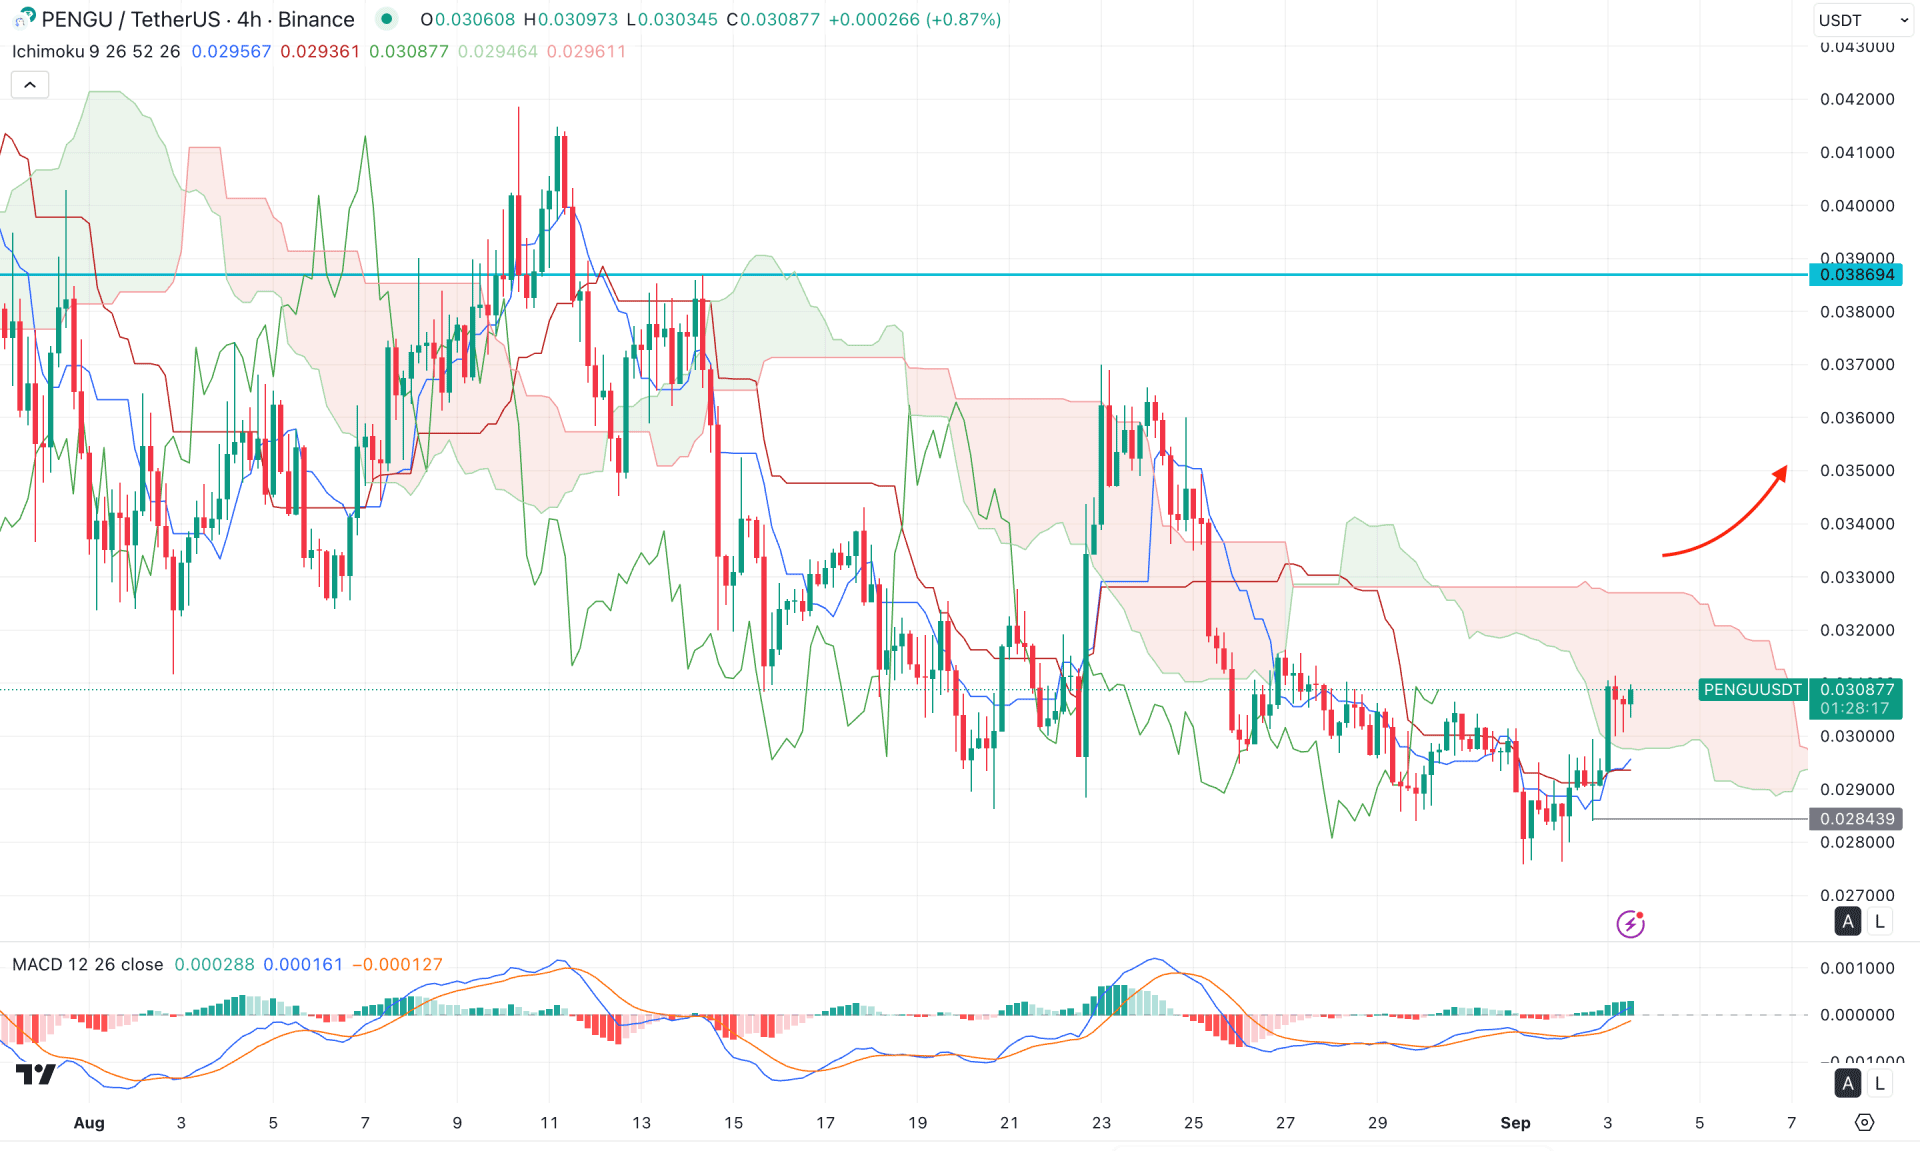
On the four-hour timeframe, the recent price action has turned sideways below the cloud area, signaling a struggle for sellers. However, the price is currently trading higher after a bullish channel breakout, though it is still struggling to overcome the cloud zone decisively. In this case, investors should monitor how the price reacts to a potential breakout above the cloud, as this could confirm a stronger upward trend.
In the secondary indicator window, bullish momentum is visible through the MACD signal line crossover, supported by multiple positive histogram bars.
Based on this outlook, investors may expect buying pressure to extend once the price successfully consolidates above the cloud area. In that scenario, the price could extend higher and face resistance near the 0.0386 level. On the other hand, the ongoing struggle to overcome the cloud zone remains visible, and the price could move lower below the dynamic support level at any time. A break below the 0.0284 level could open the door for a decline toward the 0.0240 area.

In the hourly timeframe, the recent price is trading sideways as no significant trend continuation is visible from mid-August. Investors should monitor how the price reacts at the current price, as a breakout is needed before anticipating a stable trend.
In the main chart, the visible range high volume level is closer to the current price, supported by the rising EMA wave. Moreover, the weekly VWAP line is below the current price and working as a major support.
On the other hand, the Traders Dynamic Index (TDI) failed to hold the momentum above the neutral level.
Based on this outlook, a bullish continuation with a consolidation above the 0.0311 level could be a long opportunity, aiming for the 0.3450 level.
However, the price is very corrective above the EMA wave, which signals pressure on the bulls. A failure to hold the price above the weekly VWAP line could be a bearish opportunity any time.
Based on the overall market momentum, PENGU/USDT is trading sideways in the intraday chart, where the major market momentum remains bullish. In that case, close attention is needed within the Falling Wedge as a valid bullish break could be a continuation signal.


