

Published: October 14th, 2026
Prologis Inc (PLD) is scheduled to release its third-quarter 2026 earnings this week. Analysts anticipate diluted earnings per share (EPS) of $1.58, representing a 6% increase from $1.49 reported in the same period last year.
The company has also demonstrated consistent earnings performance, meeting or exceeding analysts' EPS expectations in each of its previous four quarters.
For the full 2026 fiscal year, market estimates point to EPS of $6.27, up 7.9% from $5.81 in fiscal 2025. Earnings are expected to maintain their upward trajectory in fiscal 2027, with projections indicating a further 6.2% year-over-year increase to $6.66 per share.
Prologis' growing data centre operations, which offer an additional avenue for expansion, have supported the stock's gains in part. Investors may also be responding positively to the company's dividend growth and the prospect of lower long-term interest rates.
Let's examine the possible price movement of PLD from the perspective of technical analysis:
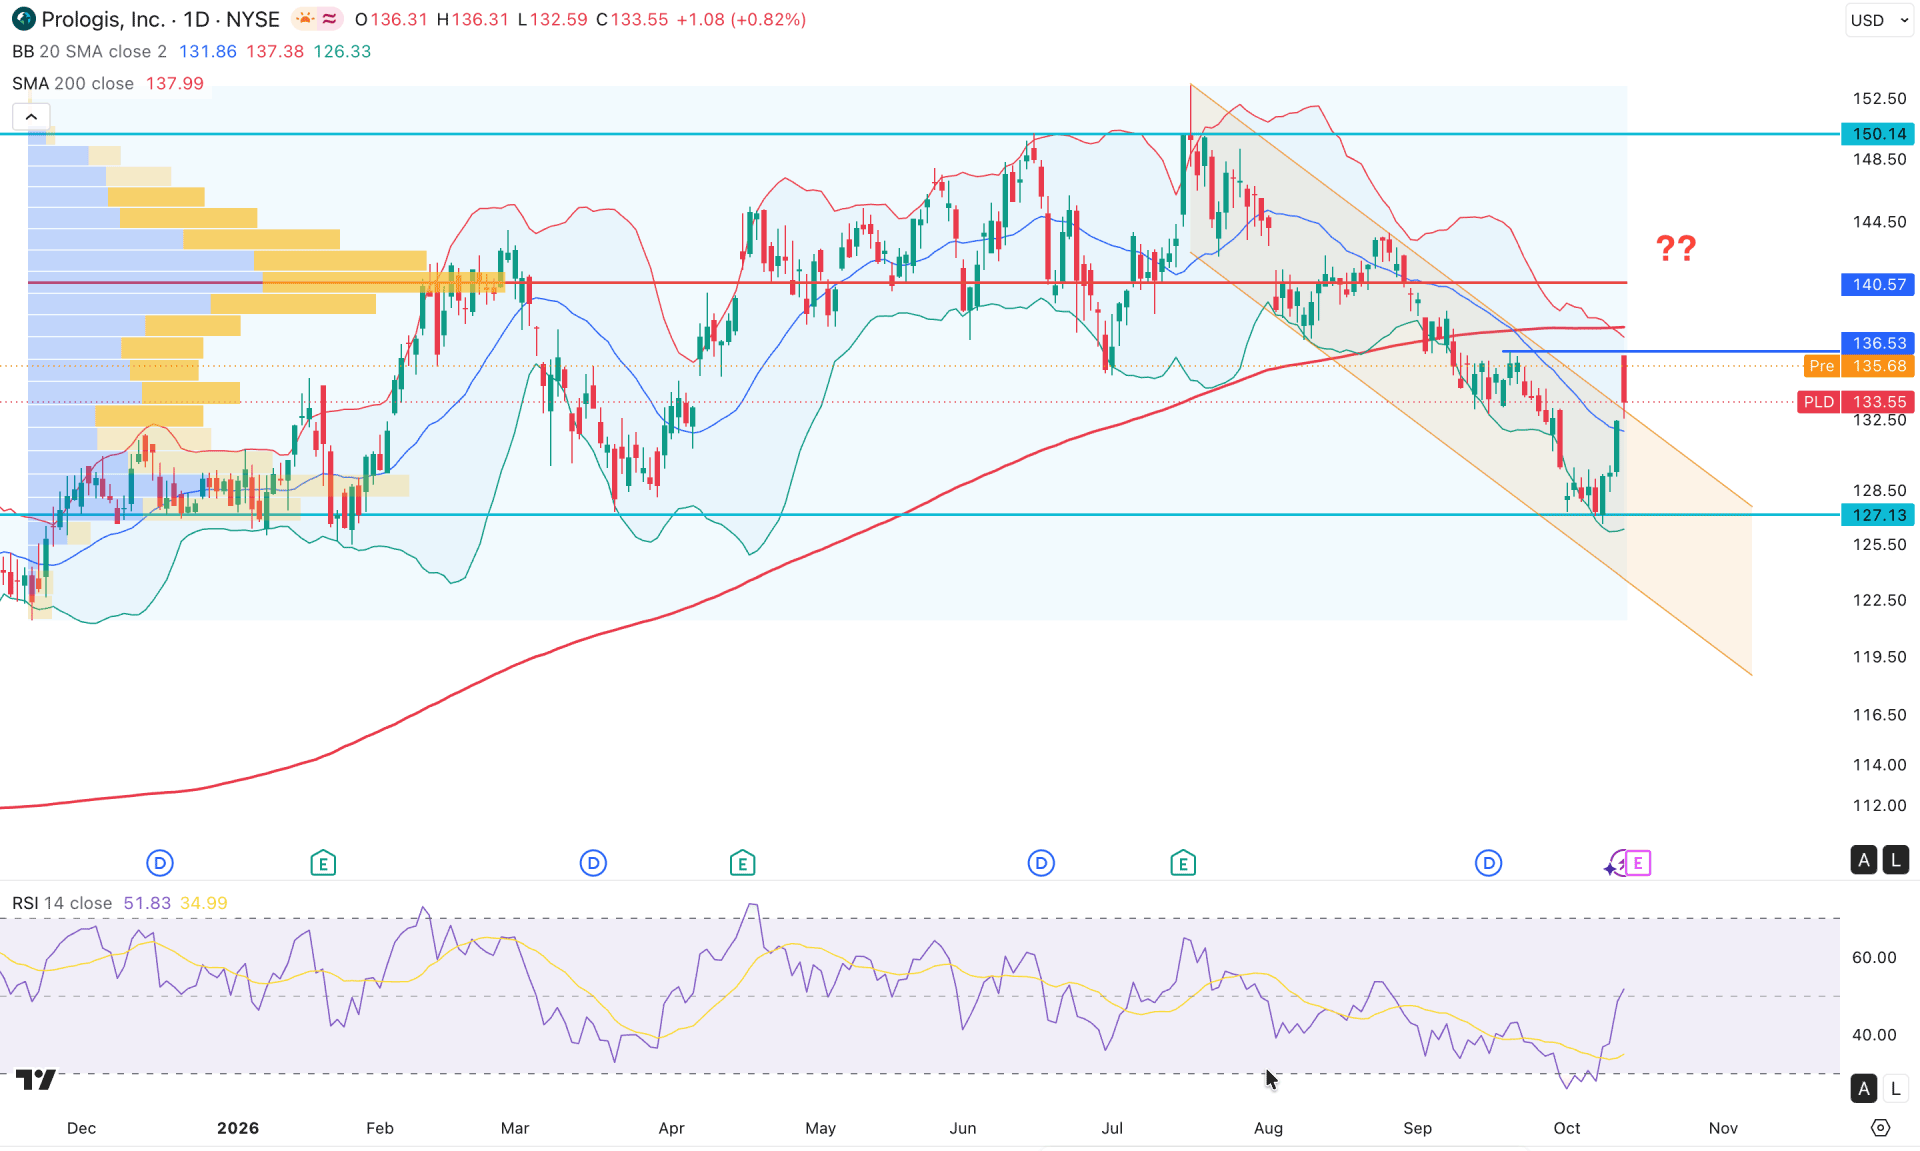
In the daily chart of PLD, a corrective bullish trend is visible, while the most recent price is trading sideways. However, a minor bullish activity is visible from the double-bottom support at the 127.22 level, which could be the first sign of possible bullish pressure.
On the higher timeframe, a bullish trend remains valid even if price is trading sideways after two consecutive bearish monthly candles. As the existing monthly low is still protected, we may expect a bullish continuation. The weekly timeframe shows extended downside pressure as price continues to move lower from the 150.14 weekly resistance level.
In terms of volume, selling pressure is emerging, as the largest activity level since November 2025 is at 140.57, above the current price. Primarily, this signals reversal activity in the premium price zone, where a trend reversal is possible.
On the main chart, price found support at the lower Bollinger band line, from where a rebound and recovery above the mid Bollinger band resistance is visible. As the current price is still trading above the mid Bollinger band line, we may expect further bullish continuation.
On the other hand, the long-term bullish rebound needs some validation from the 200 SMA, which is above the current price and the 136.53 swing high. In that case, a bullish recovery above this line could be the first sign of a bullish trend reversal that can resume the existing market trend.
The RSI shows bullish price action as the current line is hovering above the 50.00 line after testing the 30.00 oversold level.
Based on this outlook, price is trading sideways after a descending channel breakout. The price has yet to overcome the 136.53 resistance level to validate the channel breakout.
On the bullish side, a recovery above the 140.57 key resistance level is a strong opportunity, targeting 150.14 and above.
The alternative approach is to look for a bearish daily close below the midband line to extend the ongoing channel and create a new swing low below the 122.00 area.
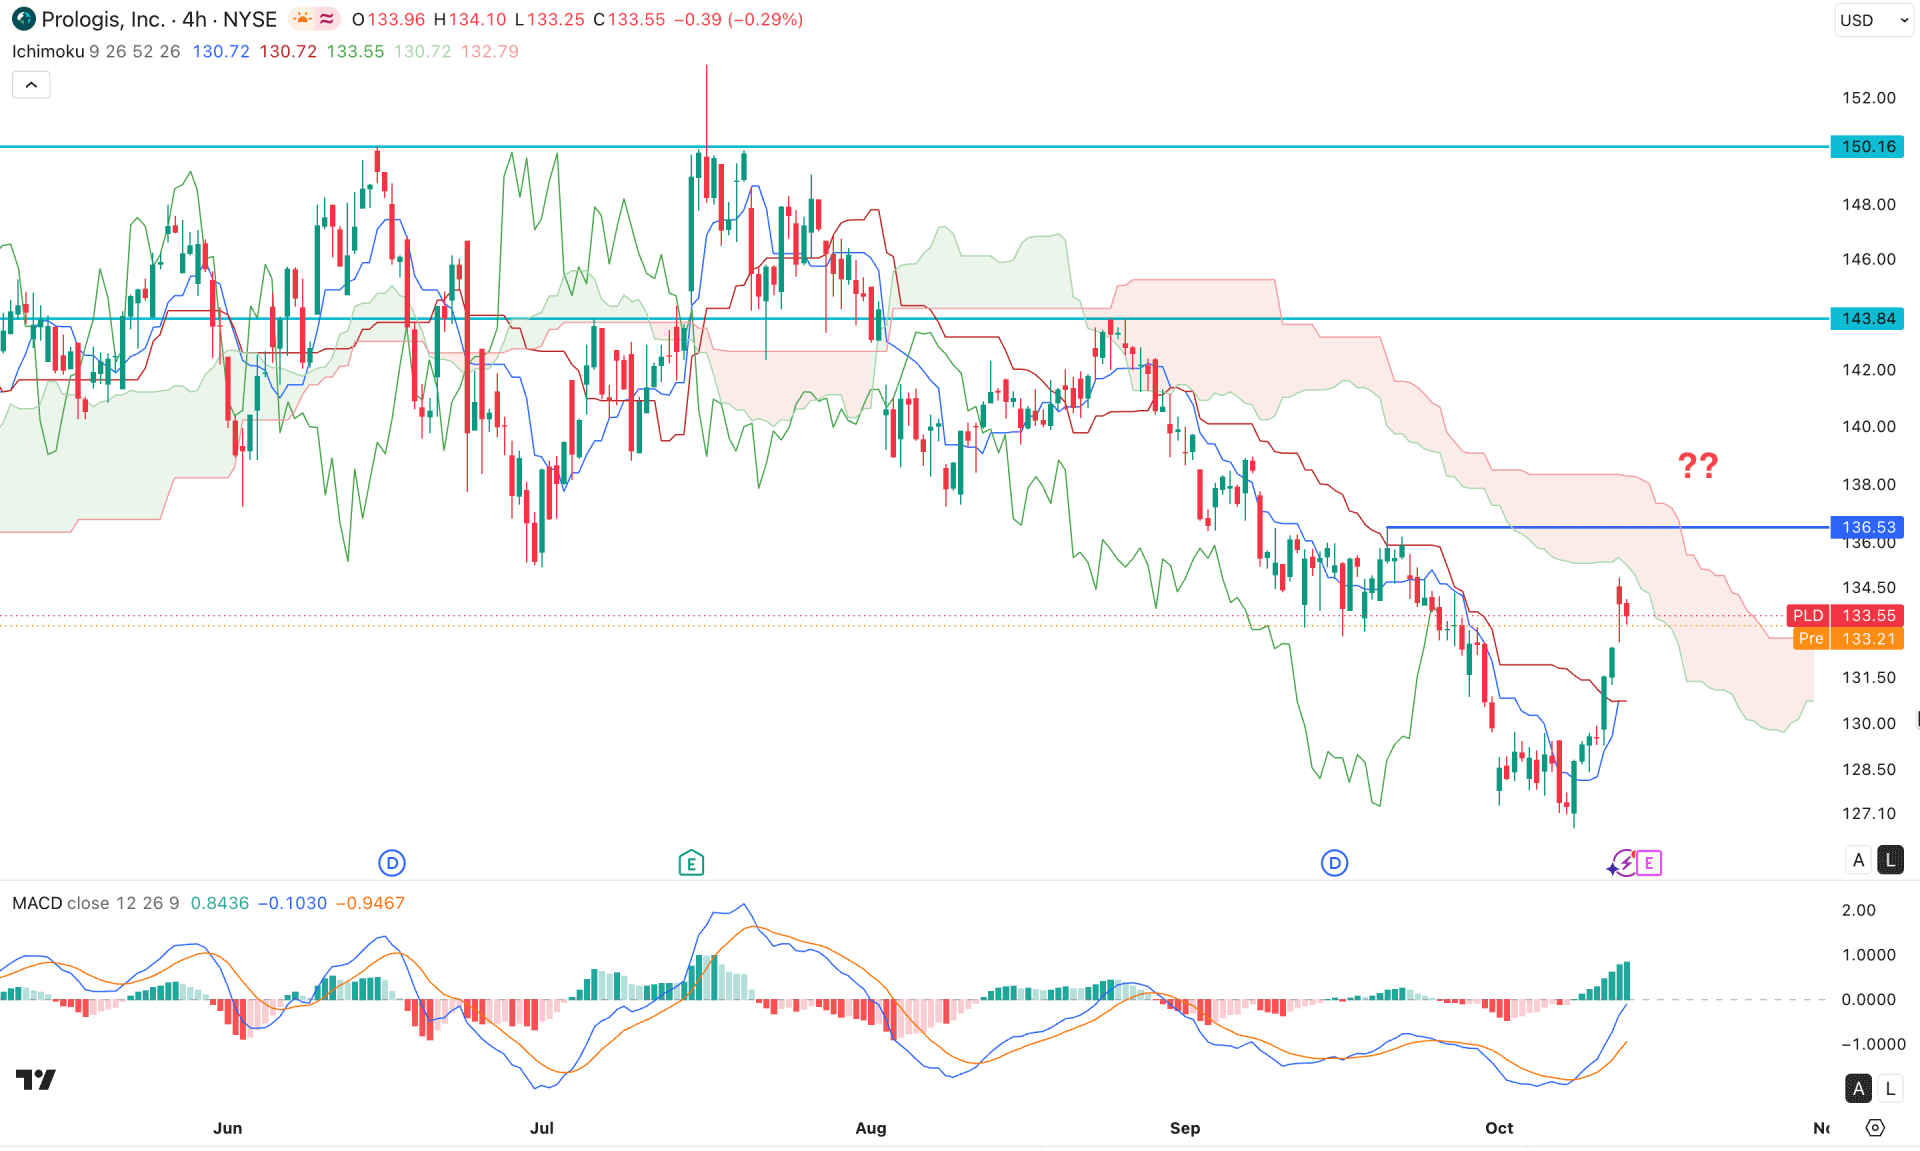
On the PLD four-hour chart, price is likely to form a bottom, as a bullish rebound is visible above the dynamic resistance level, countering impulsive momentum. However, price has yet to overcome the Kumo cloud resistance, which is acting as a major barrier above the 135.53 line.
In the secondary indicator window, the MACD histogram maintains the buying pressure by forming multiple bullish vertical lines. Moreover, the signal line has formed a bullish crossover at the bottom and reached the neutral area.
Based on this outlook, investors should closely monitor how the price reacts at the 136.53 resistance level. Primarily, breaking above this line could be a strong bullish signal, targeting the 143.84 level.
On the other hand, an immediate rebound below the key level could resume the existing trend at any time.
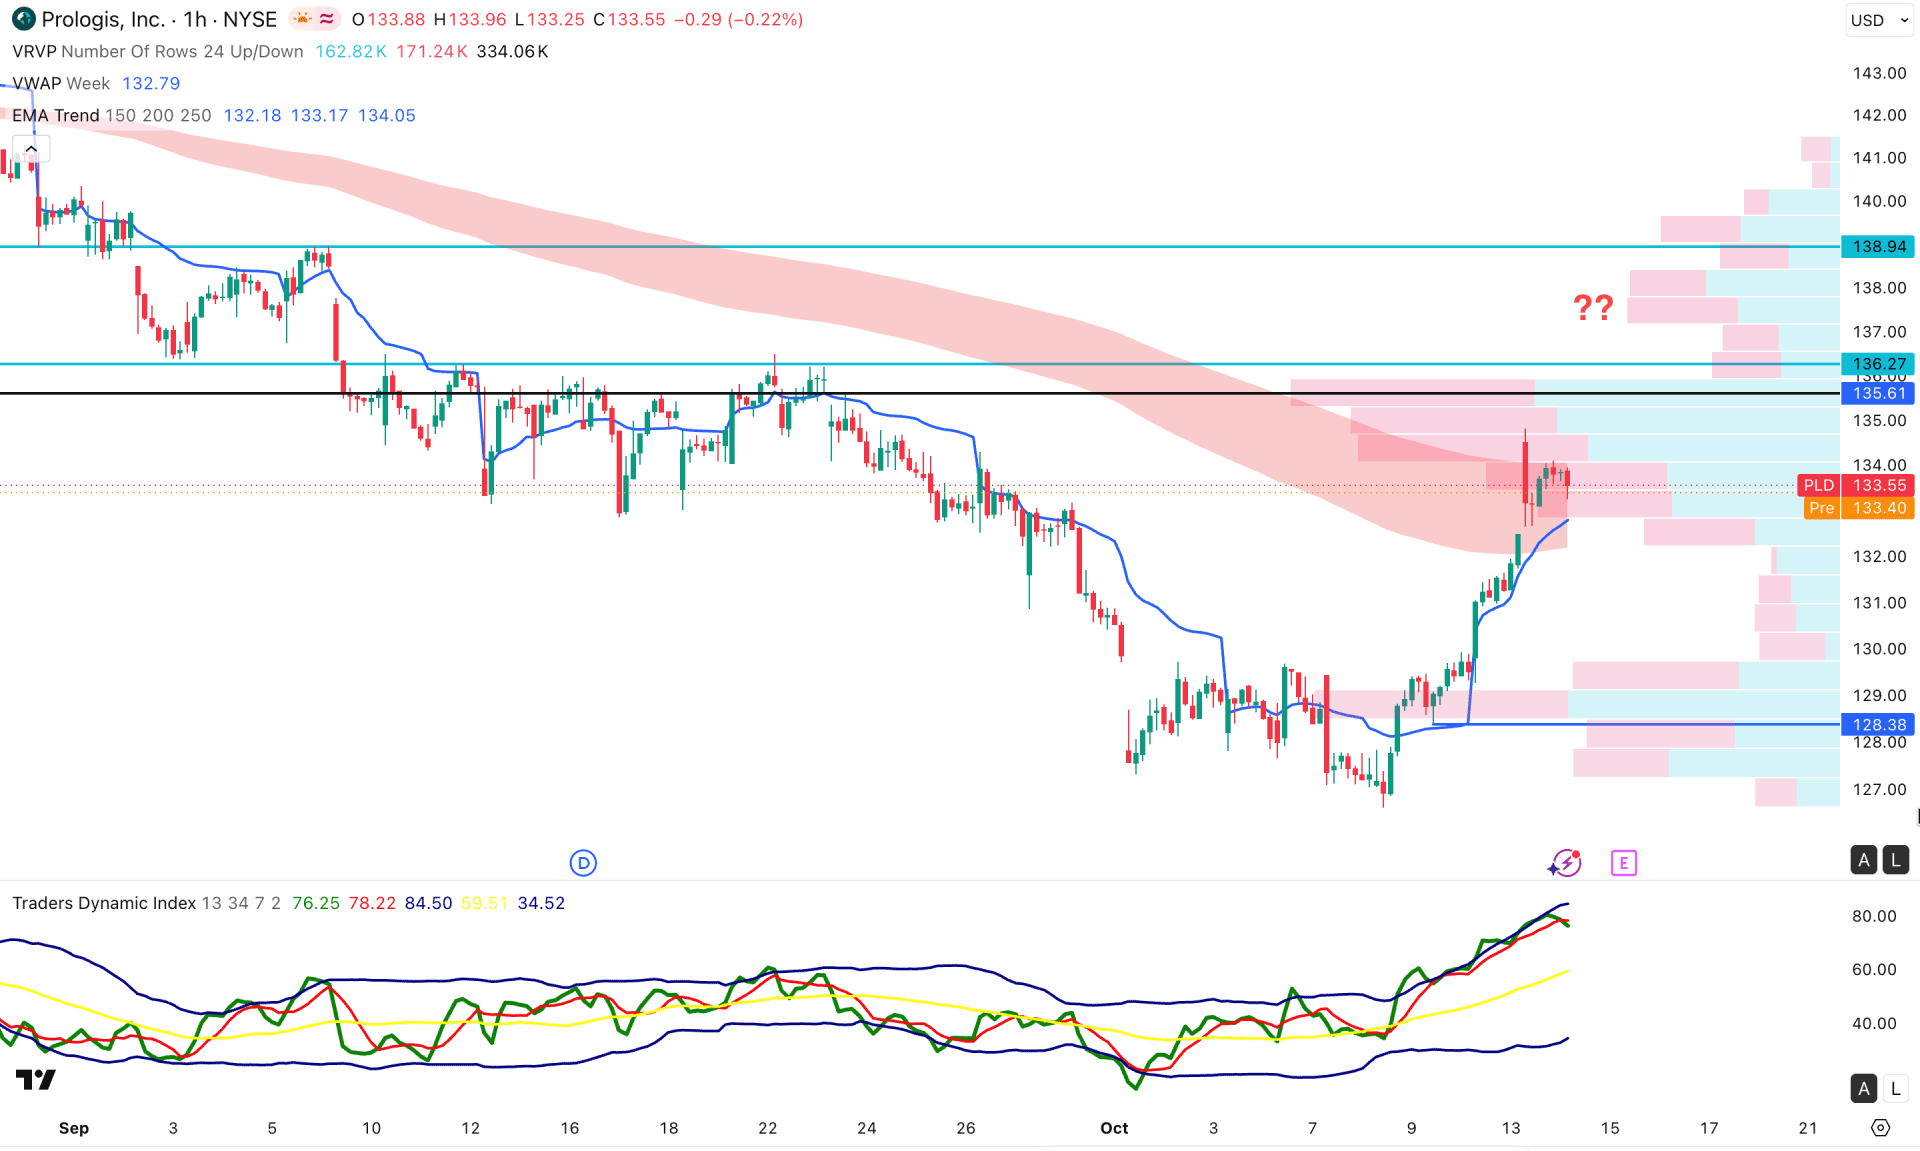
In the hourly timeframe, PLD is trading within a bullish structure as the price formed a range-bound market with a bullish breakout at the 128.38 support area. As a result, the weekly VWAP level fell below the current price and is acting as immediate support.
On the other hand, the high is at 135.61, just above the current price, and is acting as immediate resistance.
In the secondary indicator window, the Dynamic Index has reached the upper area, signaling an extremely bullish condition.
Based on market structure, a breakout above 135.61 could be the first sign of a bullish trend reversal, potentially taking price beyond 138.94.
Based on the overall market structure, PLD is trading in a structure where the recent rebound from the bottom signals a possible bullish continuation opportunity. Intraday price is still bearish, so a valid bullish breakout is needed before validating a daily channel breakout.


