
Published: February 14th, 2021
Gold price is typically represented on the XAU/USD pair. This outlook takes into account the outlook for gold, as determined primarily by the factors that affect risk sentiment in the markets.
Gold price surged to all-time highs at the peak of the coronavirus pandemic in 2020, as investors sought the safe-haven status of gold to preserve capital. However, gold has struggled to come close to those highs above the $2,000 mark, as actions by central banks restored the bull runs in the stock market, causing investors to shift back into risk-on sentiment.
So what is the outlook for gold in the first quarter of 2021?
The price of gold has been dictated primarily by the coronavirus and the actions of governments, biotechnology companies and policymakers in response to the virus. One of the major determinants of price action of gold is the addition of extra stimulus, especially on the fiscal side. The latest is the $1.9 trillion stimulus proposed by US President Joe Biden. This package will demand more printing of the US Dollar to fund the stimulus and is expected to be a USD-negative event.
However, other things came with the pandemic, such as loss of jobs. Therefore, gold price will continue to be subject to several employment data such as the jobless claims and the Non-Farm Payrolls (NFP) report. Any market news or rumours that circulate around these headlines could produce volatility on gold prices.
The monthly chart shows that gold is in an uptrend, despite the retracement that occurred in the 4th quarter of 2020. However, the lower highs on the chart is a sign of dwindling buying momentum, and may indicate that the uptrend move may have stalled.
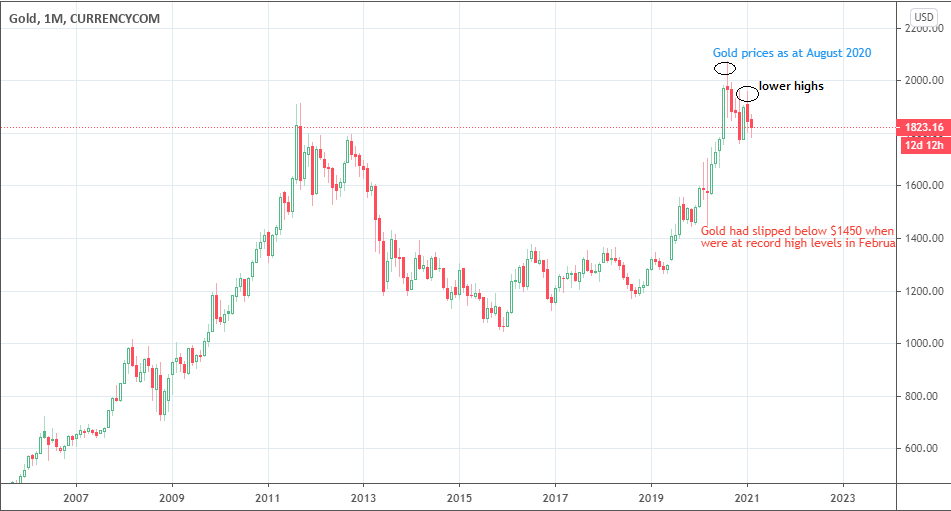
XAU/USD Monthly Chart: February 14th, 2021
In the long-term, traders can expect gold prices to cool off further, especially if more recovery is seen in the stock markets and the cryptocurrency market continues to experience a massive boom. On the weekly chart which displays the secondary trend action, the price candles have formed a symmetrical triangle. The last active candle displays a pinbar resting on the triangle's lower border, which suggest that price may have found support. However, the presence of the triangle suggests that price may be set for a big move. 80% of the time, the symmetrical triangle breakout assumes the direction in which price entered it, and 20% of the time, it occurs as a topping pattern.
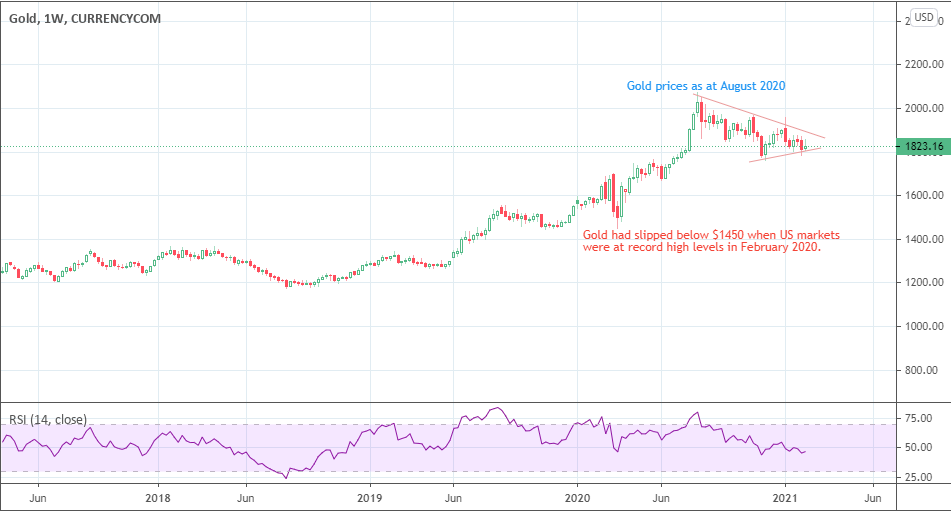
XAU/USD Weekly Chart: February 14th, 2021
The RSI has broken below the midline of the vertical range (50.0 mark). This is a leading indicator and it suggests that there could be more downside in the offing. A look at the pinbar shows that sellers forced back the price from the weekly highs and despite the higher close, the price remains under pressure.
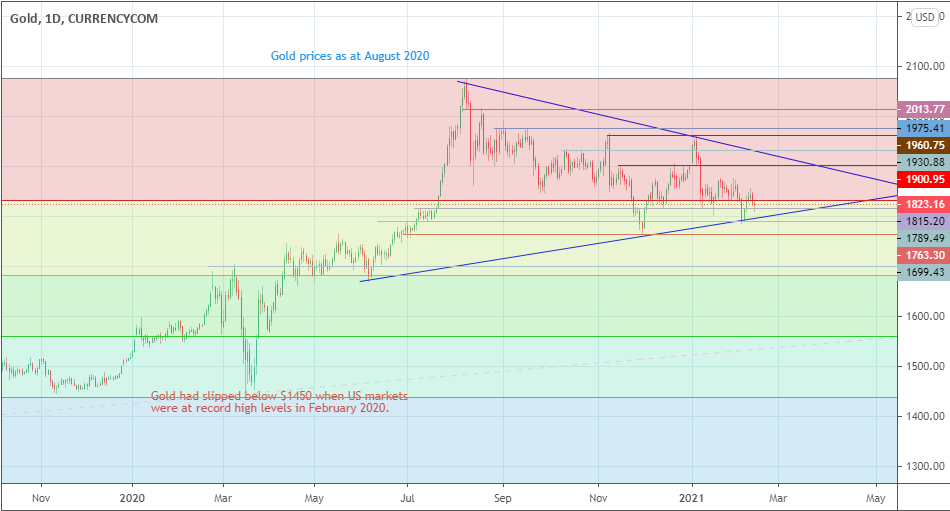
The daily chart seems to support the notion that the momentum is with the bears. The RSI indicator shows that the indicator line tested the midline point, was rejected at that level and has turned lower. The symmetrical triangle is shown, along with the levels of support and resistance that have dictated price action for the last four months.
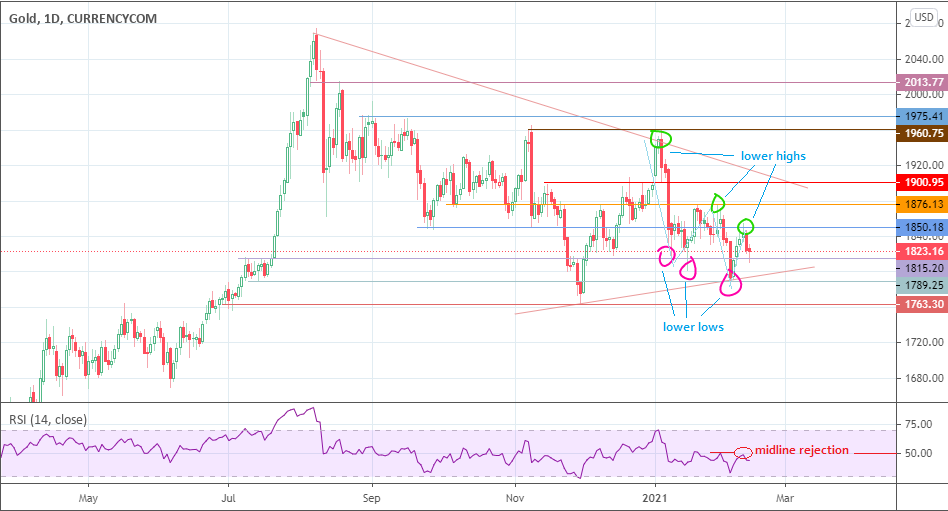
XAU/USD Daily Chart: February 14th, 2021
The daily chart reveals that price is forming lower lows and lower highs, and therefore the minor trend is actually bearish. Price action in the last two weeks got rejected at the 1850.18 resistance level, accompanied by bearish action in the last two days of the previous trading week. The downside move of February 12, 2021 was rejected at the 1815.20 support level, as bulls pushed back further attempts of sellers to drop the price.
The resolution of the symmetrical triangle will dictate price action in the near term as well as the medium term, with the horizontal levels of support and resistance also playing a role in the near term.
Presently, the momentum of price action is with the bears as they challenge the 1815.20 price support. If this support breaks down, then the XAU/USD pair would be on its way to testing the triangle’s lower border, where it intersects with the 1789.25 support level. Only a breakdown of this support (and by extension, the symmetrical triangle) will allow sellers on the XAU/USD drive down gold prices towards 1763.30 as the initial target. The long-term measured move from the breakdown of the triangle could see XAU/USD facing a decline towards 1559.07 (50% Fibonacci retracement from the 1 December 2015 low to the 3 August 2020 peak). This move would have to take out the 38.2% Fibonacci retracement at 1559.07 as well.
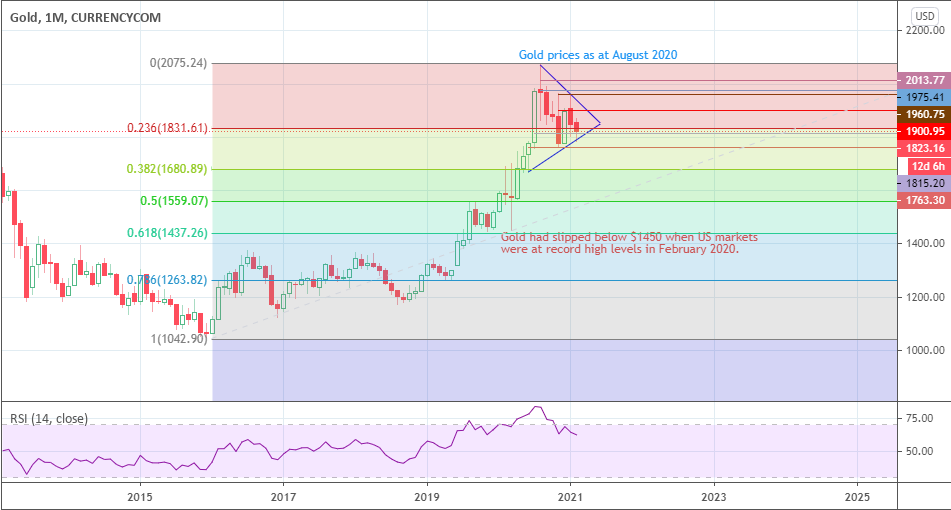
Gold (XAU/USD) Monthly Chart Showing Support Targets
In the medium term, downside targets exist at several points between these key areas. 1789.49 and 1699.43 are notable support targets as well.
On the flip side, a breakout of the symmetrical triangle would conform to the expectation of the pattern. This move would allow gold prices to target the 1900.95, 1930.88 (9 October and 23 October 2020 highs). 1960.75 and 1975.41 are also potential price resistance targets that bulls would need to overcome if prices continue to advance. The measured move could see gold prices recover the 2013.77 price area, (18 August 2020 high). The all-time high continues to reside at the 7 August high of 2074.70.
Gold (XAU/USD) Near-term Price Targets
The long-term trend is visible on the monthly chart and continues to retain bullish bias. However, the medium-term and short-term outlook on the weekly and daily charts seem to indicate that there could be a further correction in the XAU/USD before the long-term uptrend will resume. However, the pair will also be impacted by the proposed $1.9 trillion stimulus from the US government when it is eventually passed by the US Congress.


