
Published: February 18th, 2021
This analysis report focuses on the USDTRY, which is the combination of the US Dollar and the Turkish Lira. The Lira has been selected as the counter currency on which this discussion is focussed, as it carries the best example of the carry trade that is currently at play in the FX market.
What is a carry trade? A carry trade is a simple forex strategy where the trader buys the currency with a higher interest rate, at the expense of the other currency in the pairing that carries a low interest rate. The aim of the carry trade strategy is to profit from the interest rate differential between the two currencies in the pairing.
The coming of the coronavirus in 2019 hit every country of the world very hard. The pandemic and the negative economic impact that came with it forced many central banks to cut interest rates to record lows. This was the case in many developed countries, and especially the countries whose currencies constitute the major currencies traded in forex. The interest rate in the US was slashed to 0.1% and as of the time of writing this piece, it remains at that level.
In many emerging market countries, interest rates were also slashed, but not as much as the developed countries had to endure. In Turkey, other considerations which were mostly political, also came to bear. Following a significant weakening of the Lira against the Dollar, the USDTRY pair soared to an all-time high of 8.57775 on 6 November 2020. Angered by the slump in the Lira’s value, Turkish President Recep Erdogan replaced the incumbent Central Bank Chief Murat Uysal, and brought in Naci Ağbal with a mandate to steady the ship.
Before Naci Ağbal joined the CBRT, President Erdogan had replaced Murat Cetinkaya in 2019 with Murat Uysal, after Erdogan and Cetinkaya had disagreed on monetary policy direction. Under Uysal, the Central Bank of the Republic of Turkey embarked on one of the most ambitious rate-easing cycles, dropping interest rates from 24.00% in July 2019 to 8.25% in September 2020. By the time Uysal left the position in December 2020, interest rates were back to 17.00%. So we have a situation where there is a 16.9% interest rate difference between the USD and the TRY, presenting a carry trade opportunity. This means that every investment into Lira-denominated assets (such as the Turkish government bonds) will earn interest based off the 1-week repo rate of 17.00%, while investment into USD-denominated assets only has a potential to earn 0.1% interest. Naturally, investment capital leaves a low-yield environment to a high-yield one. In times of economic upheaval as was seen in 2020, investment instruments that can deliver yield such as carry trades, are used in the FX market. These carry trades will determine the price direction for affected pairs, as it did USDTRY pair.
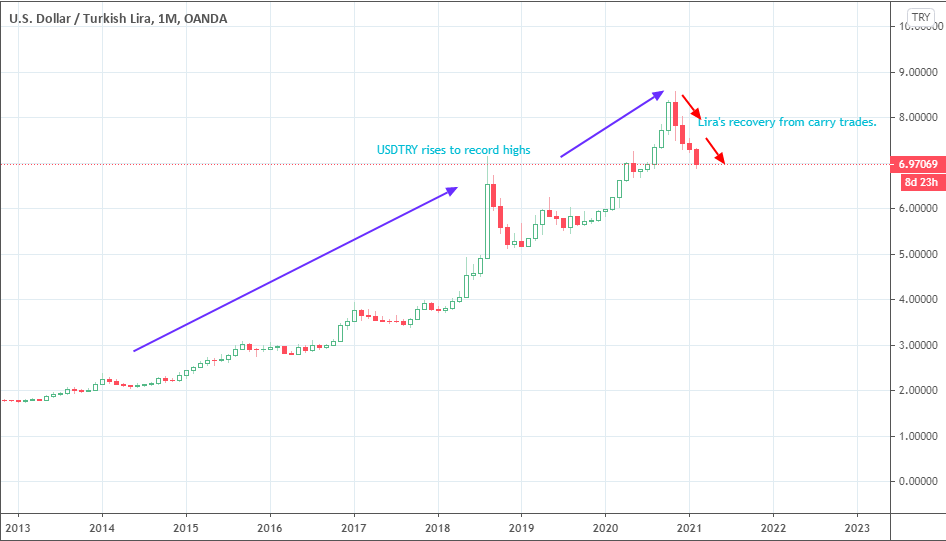
USDTRY Monthly Chart: February 18th, 2021
A look at the monthly chart of the USDTRY shows that between 2013 and 2020, the Lira weakened significantly against the US Dollar. However, the carry trade opportunity has allowed the Lira to claw back some of these losses, as investment funds pour into the Lira and exit the US Dollar in order to gain from the interest rate differential.
With the background into the USDTRY’s fundamentals described above, how can traders benefit from the carry trade opportunity on this pair?
A look at the daily chart of the USDTRY shows that the price action formed a bearish flag in January 2020. The bearish flag was completed when price broke out of its lower border on January 28, 2021, with a bearish engulfing candlestick and an outside day candle confirming the breakdown.
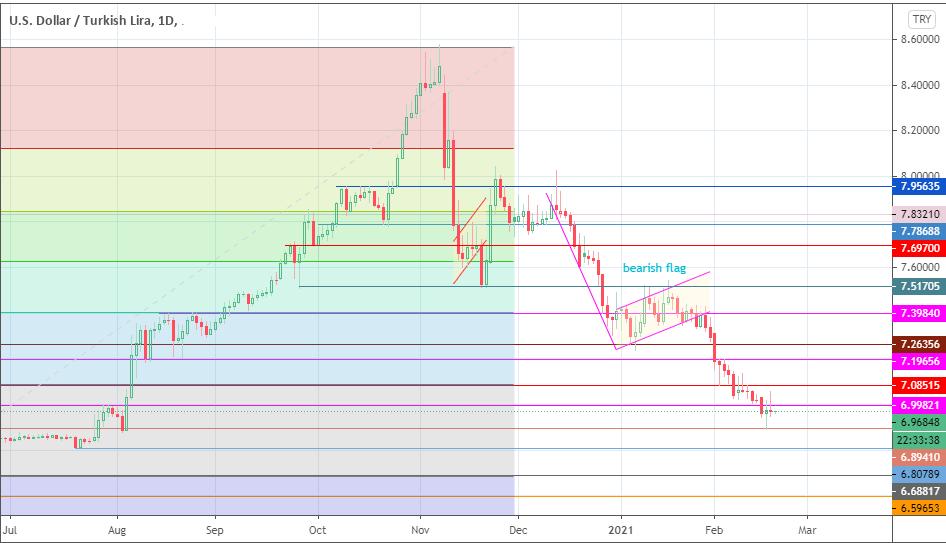
USDTRY Daily Chart: February 18th, 2021
The daily chart has been expanded in this snapshot below to show the breakdown situation. The bearish engulfing pattern received additional confirmation from the outside day candle for the downtrend to continue.
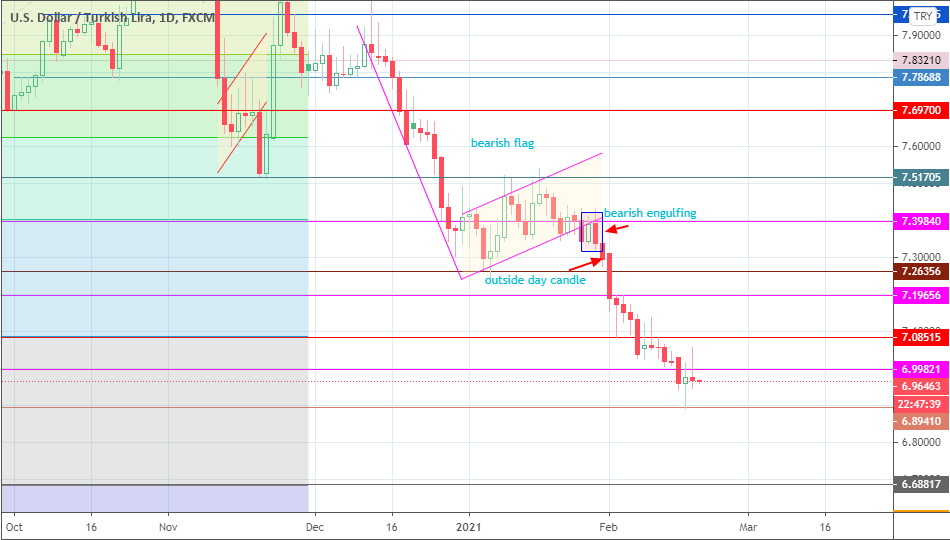
USDTRY Daily Chart Showing Breakdown of Bearish Flag
Typically, a bearish flag’s evolution is considered complete when the asset’s break of the pattern achieves a price length on the chart’s Y-axis that equals the length of the original move (i.e. the pole) that preceded the pattern’s consolidation area (the flag). A look at the daily chart reveals that this measured move has been completed with the price rejection and bounce at the 6.89410 support line.
The CBRT is scheduled to hold its February meeting to decide the latest interest rates on February 18. Analysts are predicting that the Central Bank of the Republic of Turkey (CBRT) will hold interest rates at 17.00%. If this is the case, and we continue to see rising bond yields in the US (which is responsible for the USD's recent rise this week), then the USDTRY may recover more ground. Such a recovery move has to break above 6.99821. If the breakout is successful, we could see the USDTRY targeting 7.08515 (2 February low and 10 February high). Above this level, further potential targets for bulls to achieve are 7.19656 and 7.39840. Achieving these targets will depend on whether the USD will continue to see some strengthening as per events in the US bond markets.
On the other hand, if the CBRT decides to raise interest rates, this could lead to further strengthening on the Lira, sending the USDTRY lower towards 6.89410. If this level gives way, then the 22 July 2020 lows at 6.80789 become the next potential target in line. 6.68817 and 6.59653 are additional price support targets below current levels.
The long-term trend is visible on the monthly chart and remains bullish as the recent gains of the Lira are more of a corrective move on the 8-year trend move.
The medium-term outlook is seen on the weekly chart. Price action remains bullish despite the corrective move which has now retraced towards the 88.6% Fibonacci retracement level. An ascending support trendline connects the lows of August 2019 to March 2020. The price is starting to approach this trendline and only a breakdown of this trendline switches the medium-term sentiment from bullish to bearish.
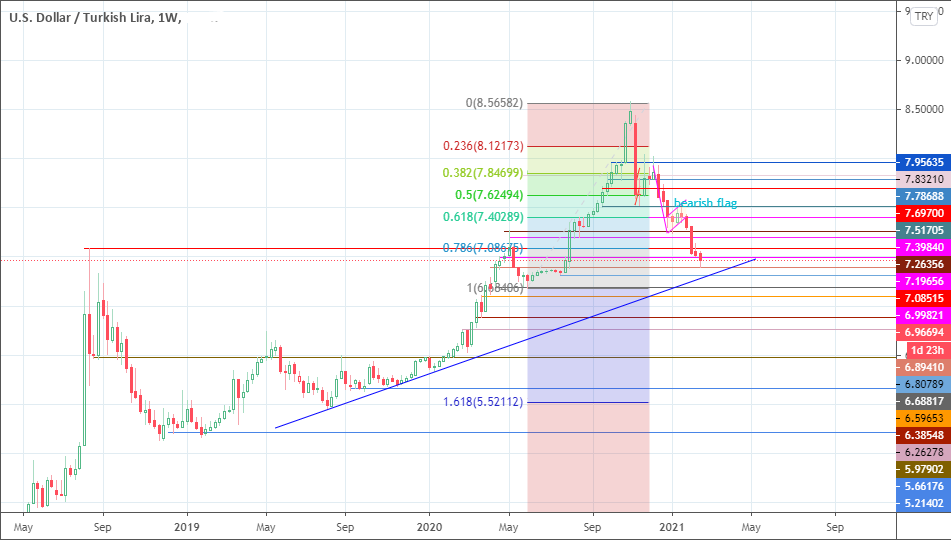
USDTRY Weekly Chart: February 18th, 2021
The daily chart is regarded as the short-term picture. Price action sentiment now switches from bearish to neutral, as the bearish pattern has been completed. Moreover, price action in the last five trading days has been range-bound, hence the neutral position. The February 2021 CBRT meeting will determine whether sentiment will shift back to a bearish one or bullish in the short term.


