Published: January 7th, 2021
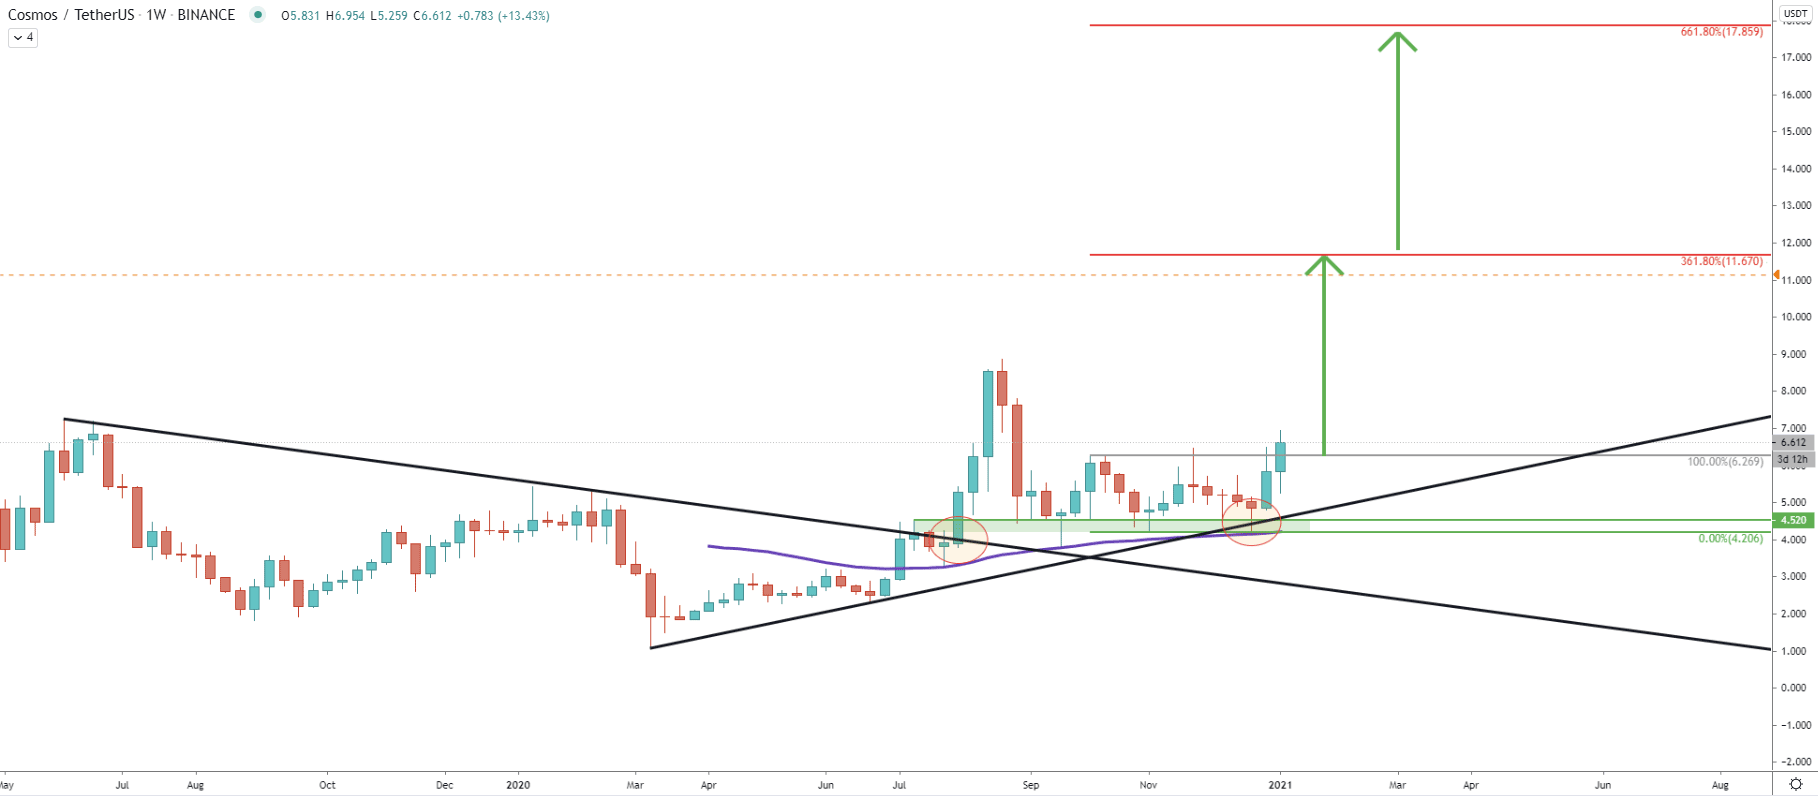
Atom remains a very attractive coin, which is currently ranked at #29 by the total cryptocurrency market capitalization. Certainly, it is under the radar of all major investors and perhaps now is the time when the buyers could be looking at ATOM/USDT extremely closely. This is because the price has broken above the downtrend trendline of the weekly chart and has reached an $8.87 high. But then correction followed and the most interesting fact is that it has reached the trendline breakout point, where it formed a strong support area near $4.5. This support was rejected at least 3 consecutive times, which shows that bulls are strongly defending this demand area.
A few weeks ago, ATOM/USDT cleanly rejected the 50 Exponential Moving Average along with the uptrend trendline. After that, prie started to produce higher highs, and currently, it seems that $6.3 resistance is being broken. Maybe this is the very beginning of the long-term uptrend continuation, which might result in a price increase towards the $18 resistance. We’ll talk about the resistance in the following chart.
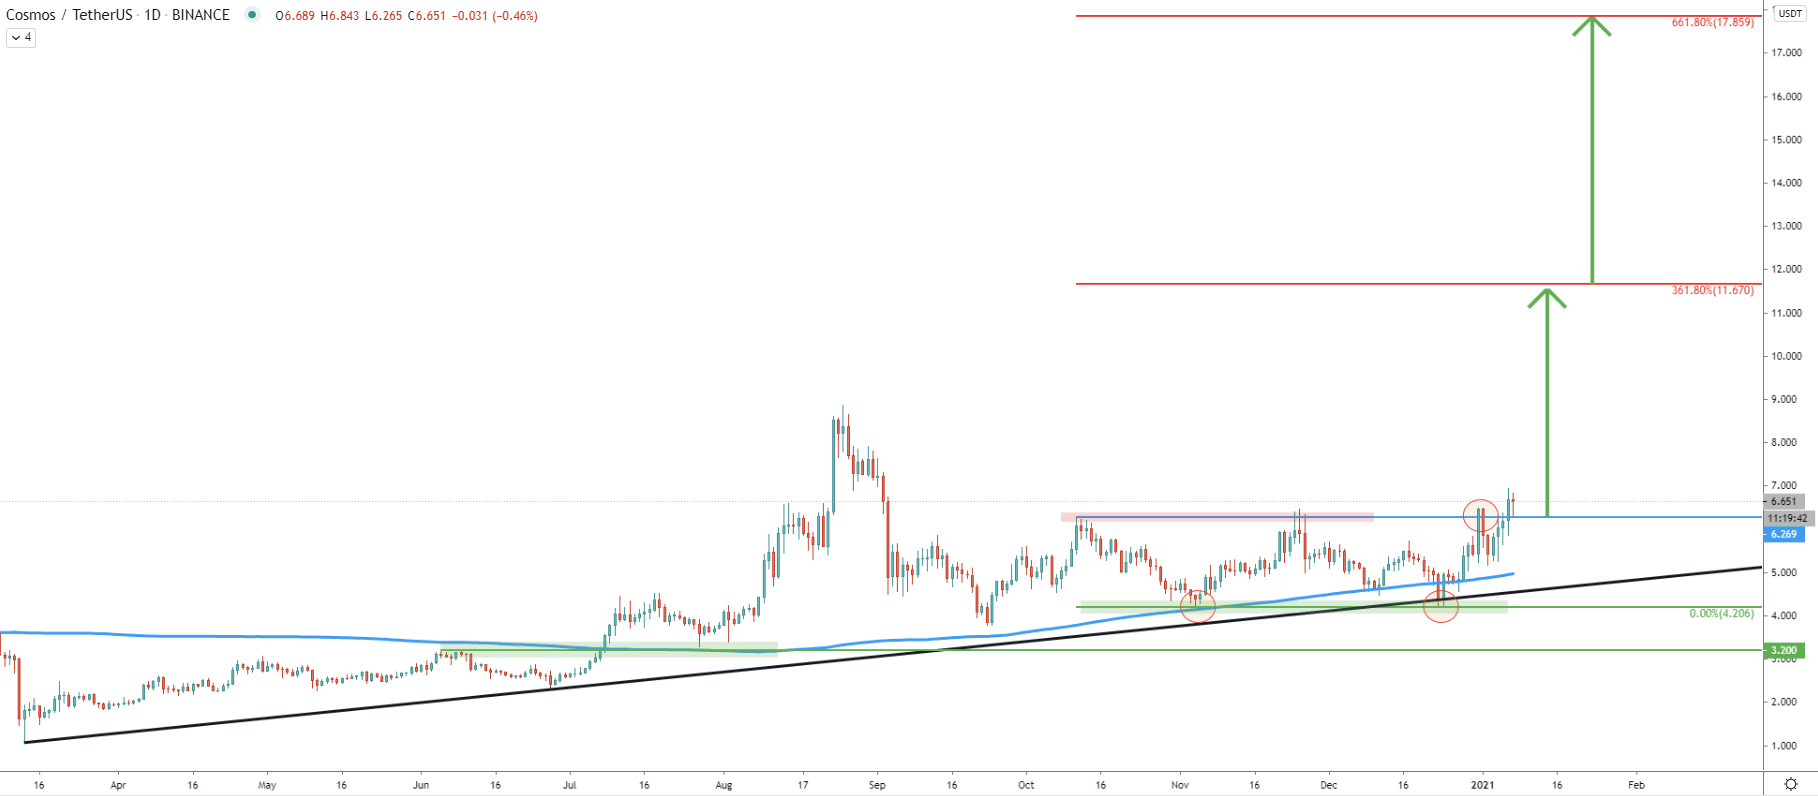
On the daily chart, the price remains above the 200 Exponential Moving Average and clearly, the pattern is bullish. Fibonacci retracement indicator was applied to the corrective wave down, where price has rejected the 300 EMA cleanly back in November 2020. It shows us two key resistance levels, namely 361.8% Fibs at $11.67 and 661.8% Fibs at $17.85. In the following charts, we’ll observe how they correspond to other Fibonacci resistance levels.
Clearly, the price is rejecting the uptrend trendline and the $4.20 support area. And recently there was a confirmed break above the $6.26 key resistance. Then price corrected down, after which produced a new higher high. Today COSMOS price has bounced off the previous level of resistance, which now is acting as the support. This might increase the buying pressure substantially, resulting in exponential growth over the coming weeks.
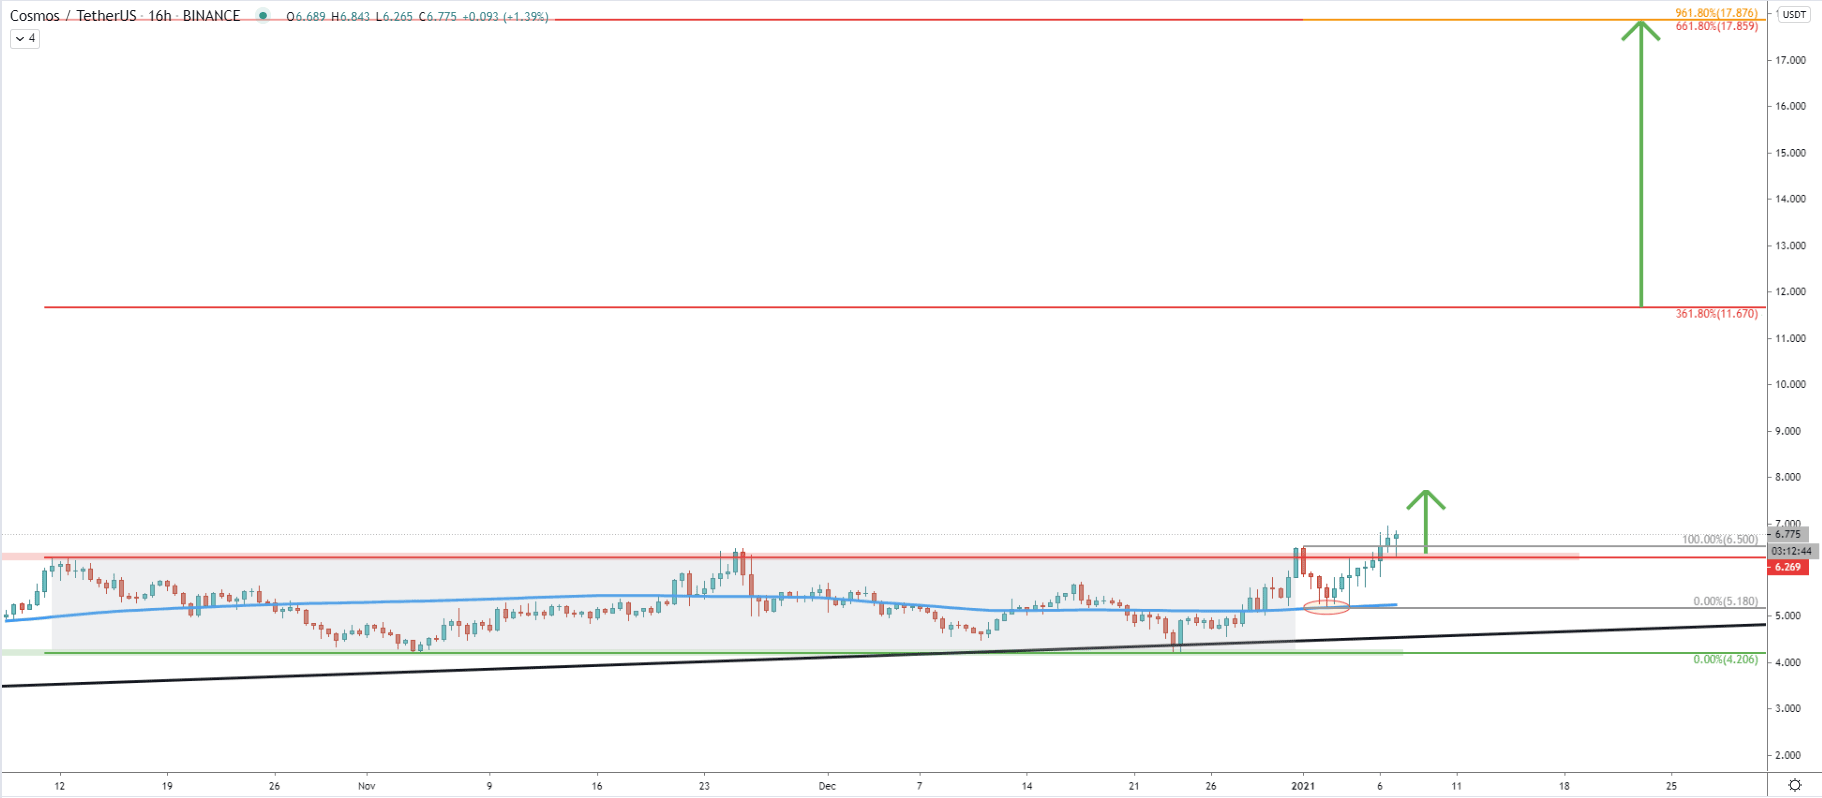
On the 16-hour chart, we can observe the range trading between $4.2 support and $6.3 resistance, which was lasting three months. But after the confirmed breakout, on the pullback, the price rejected the 200 EMA cleanly, and now ATOM starting to rise once again. Fibonacci retracement indicator was applied to the corrective wave down, where price bounced off the 200 EMA. It shows, that 961.8% Fibs exactly corresponds to the 661.8% Fibs as per the weekly chart. This might indicate, that the final upside target for the potentially incoming rally could be at $17.85, which is over 160% from the current price.
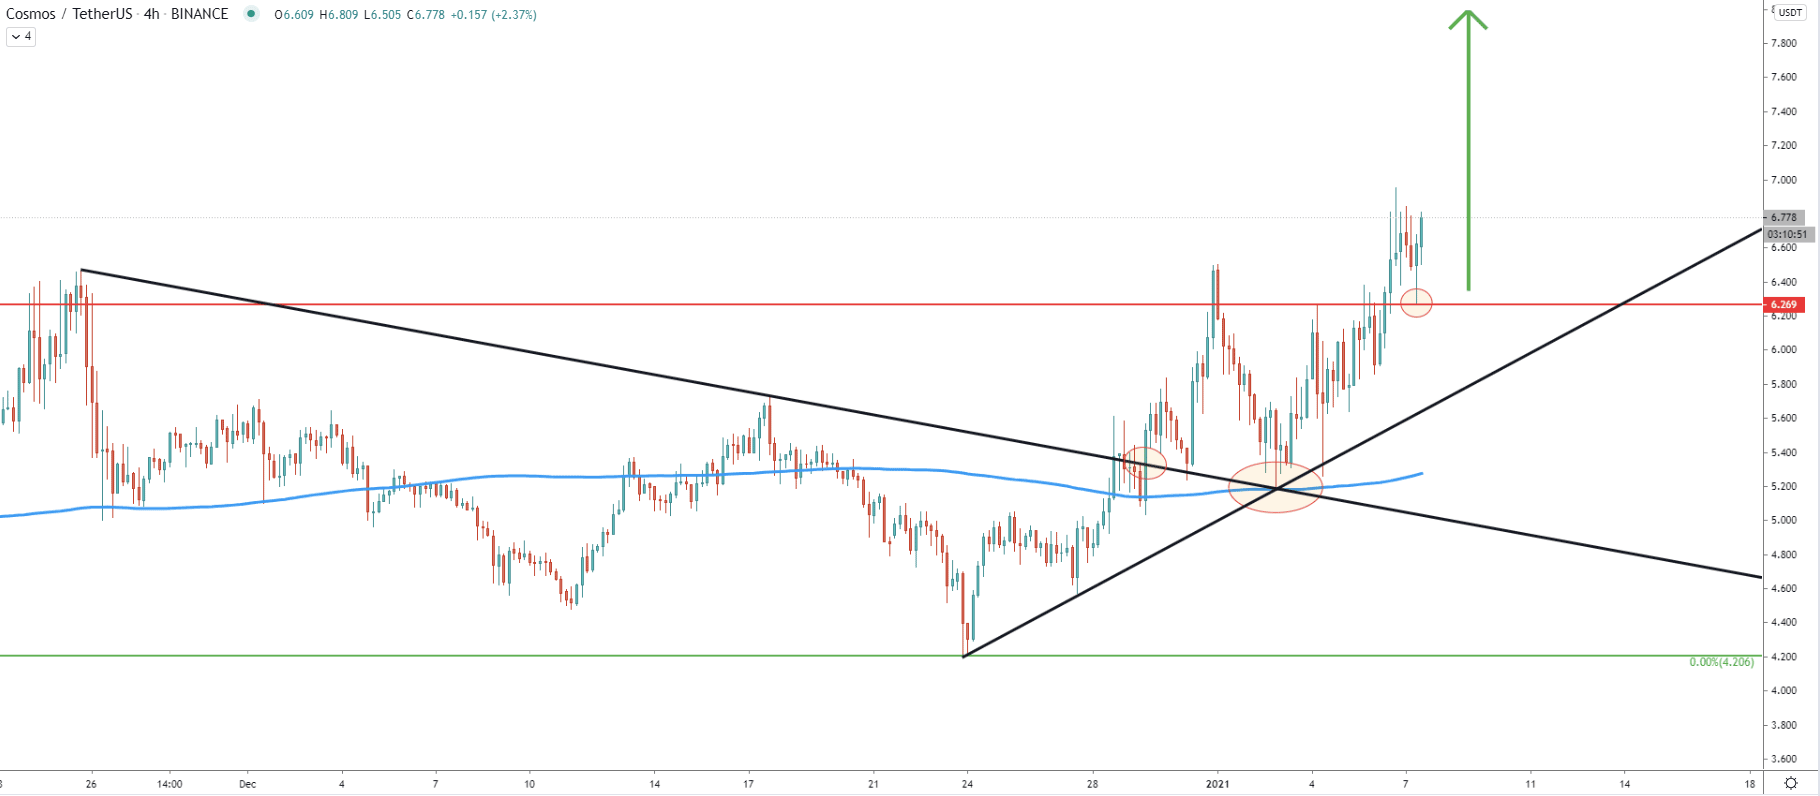
On the 4-hour chart, there was a break above the downtrend trendline. On the correction down, the price cleanly rejected the downtrend trendline, which acted as the support. Along with it, the uptrend trendline and the 200 EMA were also rejected, showing that $5.18 has become a key local support level. This might imply that the ATOM/USDT price can potentially decline towards this support before/if an uptrend will continue. But considering the price bounce off the $6.26 support today, it seems like teh uptrend is about to continue.
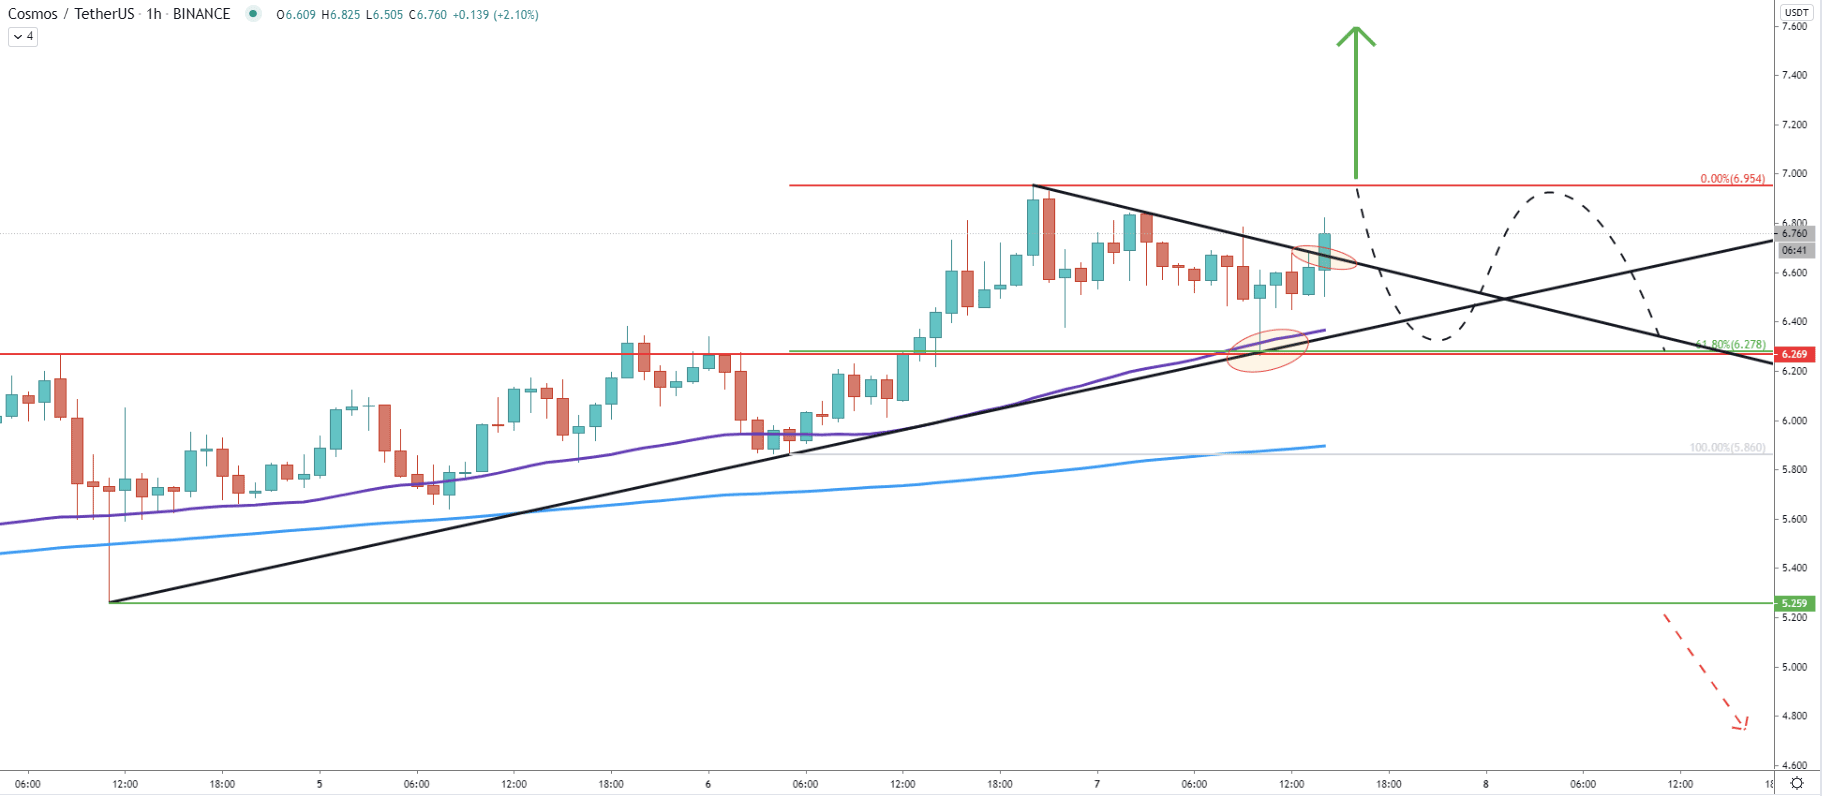
Today’s price bounced off the 200 EMA and the simple uptrend trendline. At the same time, the 61.8% Fibonacci support at $6.27 got rejected. Following the rejection, the price went up and broke above the downtrend trenldine. Right now, the price could be stuck between the support at $6.27 and resistance at $6.95. Perhaps break above the recently produced high, in other words, the current resistance will be that trigger for the buyers, and buying volume can increase significantly.
ATOM/USDT price action strongly favors the continuation of an uptrend, which might result in a 160% growth over the coming weeks. But at the same time, there might be a consolidation phase that will take place for a couple of days, before/if the uptrend continues.
As per the daily chart, there are two key resistance levels. The first could be at $11.67, while the second and the most important resistance is located at $17.85.
As per the hourly chart, a break below the $6.26 support might trigger a stronger downside correction. Although, only a break below the $5.25 support will completely invalidate bullish outlook and most likely price will start to move lower.
Support: 6.27, 5.25, 4.20
Resistance: 6.95, 11.67, 17.85