
Published: July 7th, 2022
Polygon (MATIC) is a well-structured Ethereum scaling and infrastructure development platform that can transform Ethereum into a full-fledged multi-chain system. As a result, users can make inter-chain transactions with other platforms like Cosmos, Polkadot, Avalanche, etc. Furthermore, the utilization of Ethereum security ensures openness and transparency on the Polygon network.
In the Polygon network, the native token MATIC plays an essential role by securing the system and activating governance. The MATIC token is backed by a Layer 2 scaling solution by Coinbase and Binance. Moreover, it combines the Plasma framework and proof of stake mechanism to ensure maximum scalability and autonomy of smart contracts.
There are almost 8.01B MATIC in circulation from the 10.0B maximum supply. This instrument grabbed buyers' attention by moving 64% up from the 23 June low, although the broader market direction is still bearish.
Let’s see the future price direction from the MATIC/USDT Technical analysis:
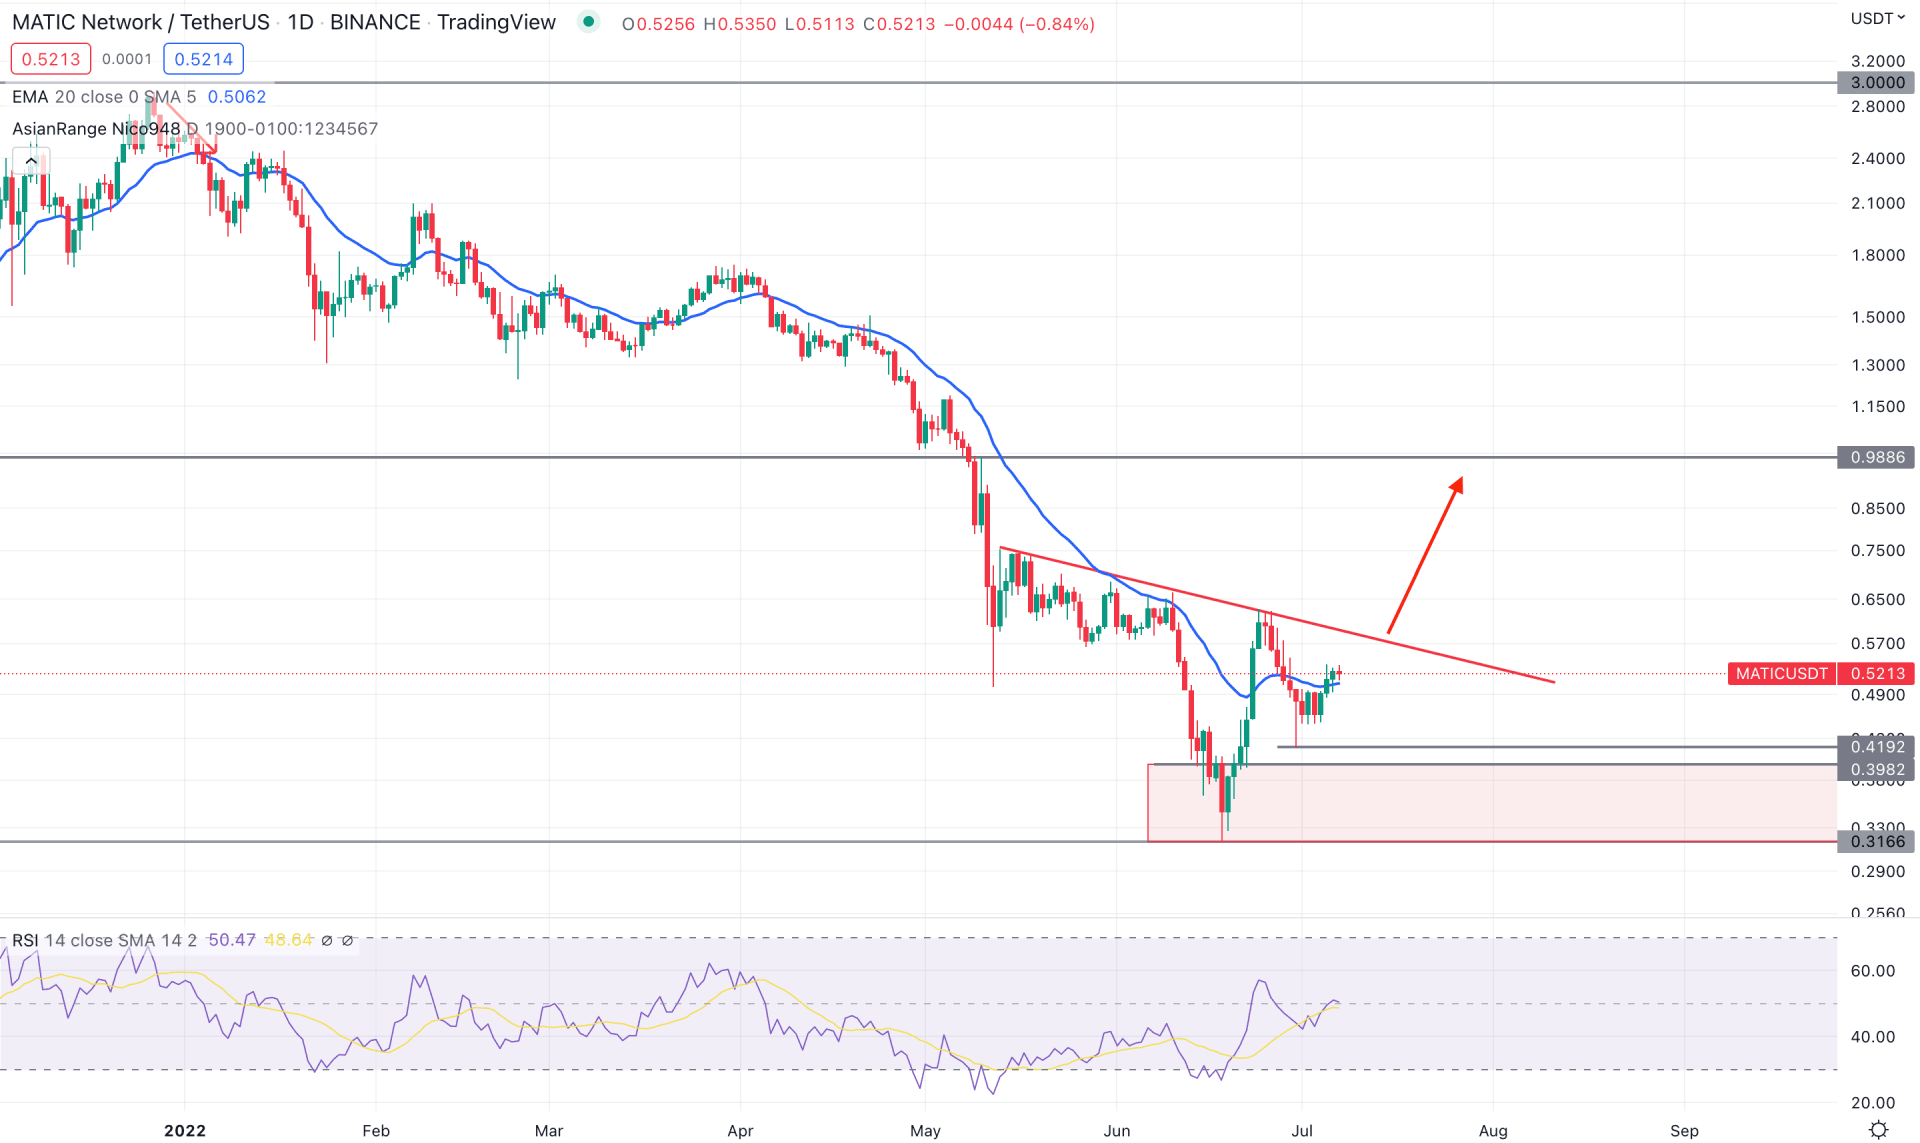
The MATIC/USDT daily chart shows how the selling pressure faced a counter-impulsive momentum from the June 2022 low. The price moved down from the symmetrical triangle breakout and reached the 0.3166 level without any correction. However, the bullish two-bar rejection from the 0.3166 low appeared with intense buying pressure, making a bullish breakout above the dynamic 20 days moving average level. Later on, bears tried to regain their momentum, but another daily candle above the dynamic 20 EMA raised a question regarding bears' momentum in the market.
The above images show the Relative Strength Index indicator on the separate window that tested the oversold 30 level and rebounded higher to the neutral 50.00 area. Moreover, the recent exhaustion below the 0.500 swing opened a bullish pre-breakout structure at the trendline resistance.
Based on the daily price structure, investors can consider the upcoming price direction bullish as long as it trades above the dynamic 20 EMA on the daily chart. In that case, the primary aim is to test the 0.9886 resistance level in the coming days. On the other hand, the alternative approach is to wait for a bearish break below the 0.4192 level to consider the existing bearish trend as valid.
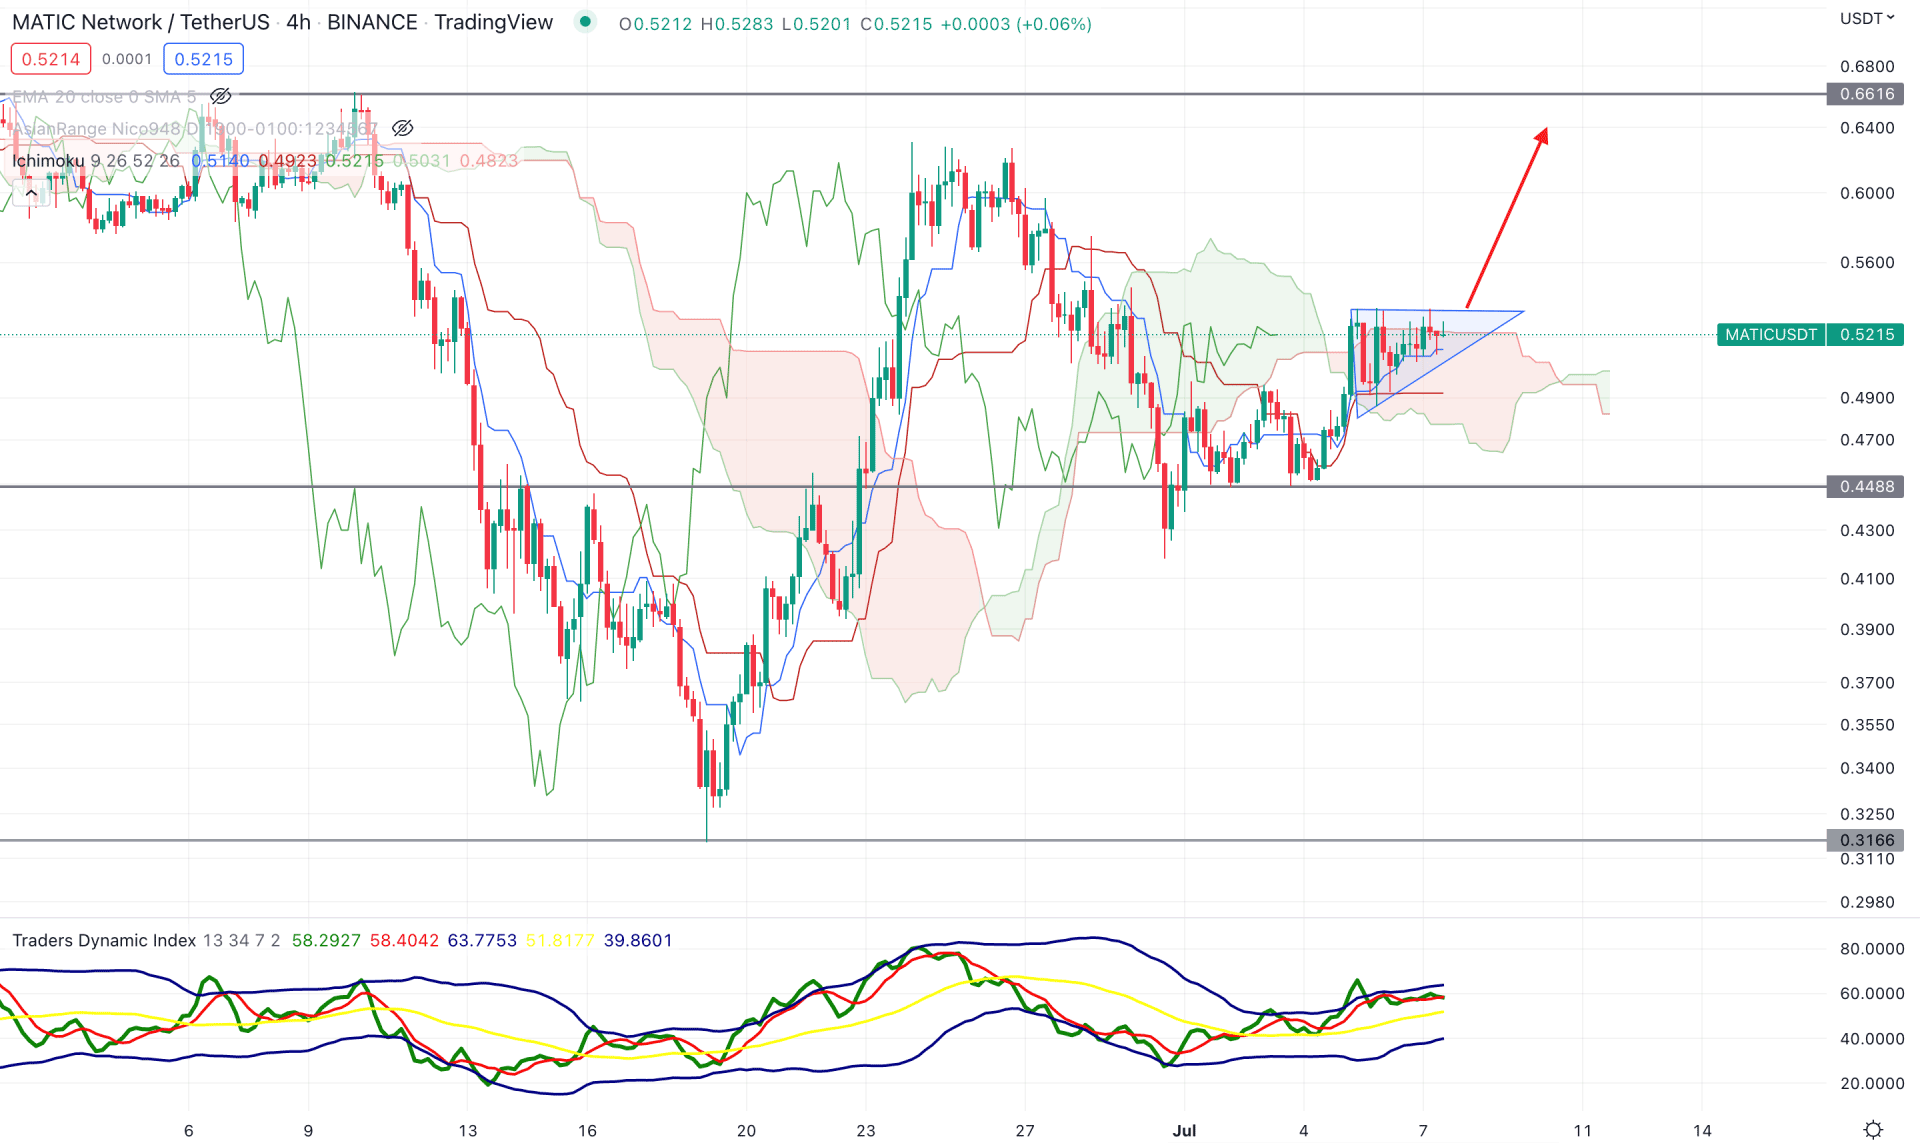
In the H4 chart, the market direction remains within the beginning phase of a bullish trend where the Future cloud is bullish. Moreover, the recent selling pressure below the cloud support rebounded immediately, indicating that bears are less interested in this pair. Although the current price hovers above the dynamic Tenkan Sen, the ascending triangle formation signifies that bulls are building orders at that level.
In the indicator window, the Traders Dynamic Index shows strong buyers’ pressure. The TDI line is steady above the 50.00 level with a possibility of reaching the upper band zone. On the other hand, the dynamic Tenkan Sen is below the price, working as a support level, while the Kijun Sen is flat.
Based on the H4 price action, a new H4 candle above the triangle resistance would be a solid bullish opportunity in this pair, where the main aim is to test the 0.6616 level. On the other hand, a bearish opportunity awaits an H4 candle below the 0.4488 level, where the main aim is to test the 0.3166 level.
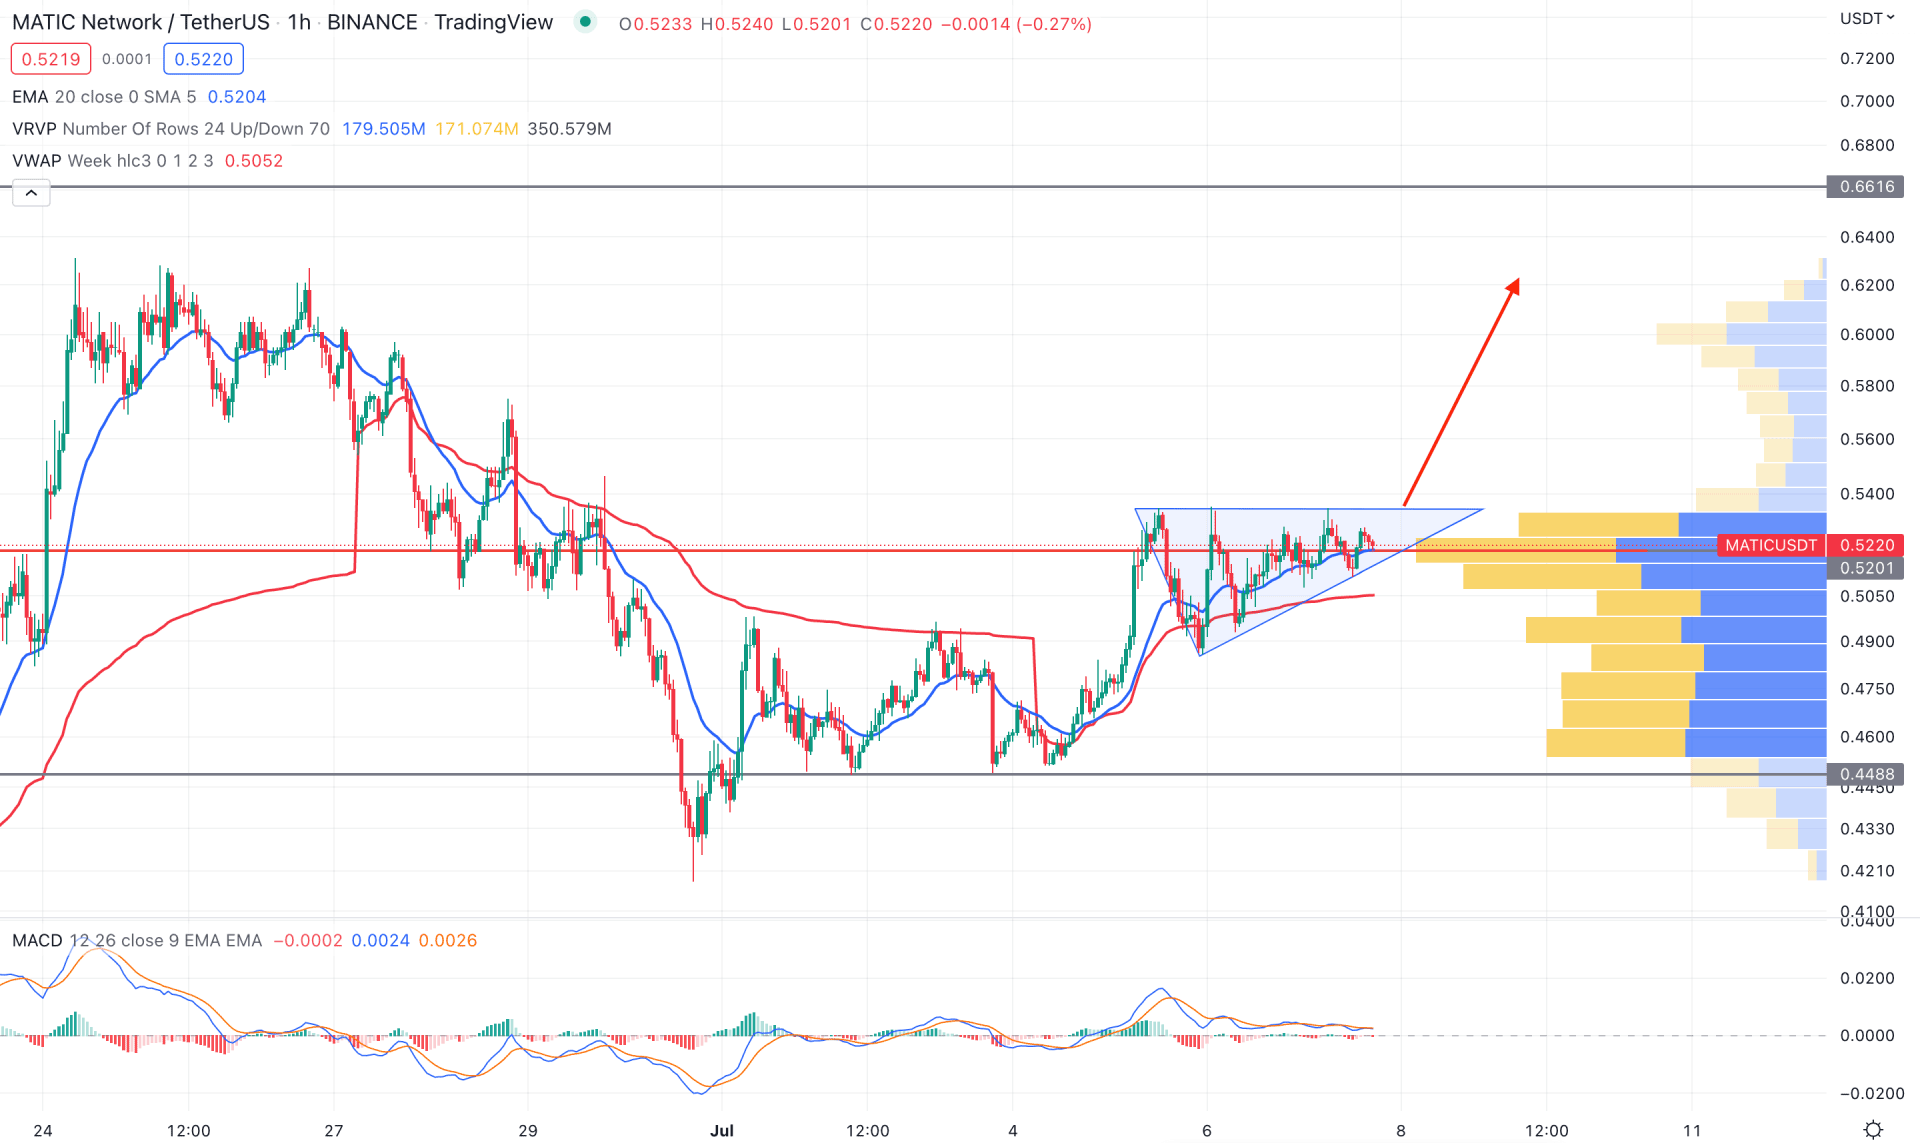
In the H1 timeframe, the bullish recovery above the dynamic 20 EMA appeared as the first sign of an upcoming bullish trend. However, based on the volume analysis, the highest trading volume was found at the 0.5201 level, which is just below the current market price. Therefore, any strong bullish H1 candle above the triangle resistance would be backed by solid volume support.
In the indicator window, the MACD Histogram is extremely corrective while the current price trades within an ascending triangle. Therefore, a bullish MACD Histogram with a breakout above the triangle zone would provide a decent bullish opportunity in this pair.
The current price trades above dynamic 20 EMA and weekly VWAP, while the latest high volume level is below the price. The combination of these conditions defines the buying momentum potential for this pair. If the price trades above the VWAP support, the upside potentiality to test the 0.6616 level will be valid. The break below the 0.5000 level may invalidate the possibility and resume the selling pressure.
Based on the current multi-timeframe analysis, MATIC/USDT is more likely to move above the trend line to grab the buy-side liquidity. In that case, any bullish breakout from the intraday ascending triangle would provide a decent trading opportunity.


