
Published: November 3rd, 2022
MATIC is the native token of the Polygon Network that showed decent performance in recent trading days. The coin has been trading at more than 10% of its value in the last 24 hours, grabbing massive investors' attention.
The bullish pressure in MATIC/USDT price came after Meta announced that it would allow users to mint and sell NFTs from the Polygon network through Instagram.
The social media giant disclosed that it would test new features among a small group of people in the US before expanding the feature to other areas of the world.
The bullish pressure in MATIC came while the broader crypto market was bearish. As of now, the overall crypto market cap is at $1 trillion, down by 1.0% in the last 24 hours.
Bitcoin trades more than 1% down in the last 24 hours, where the $20,000.00 level is working as an important support level.
Let’s see the future price of Polygon Network (MATIC) from the MATIC/USDT technical analysis:
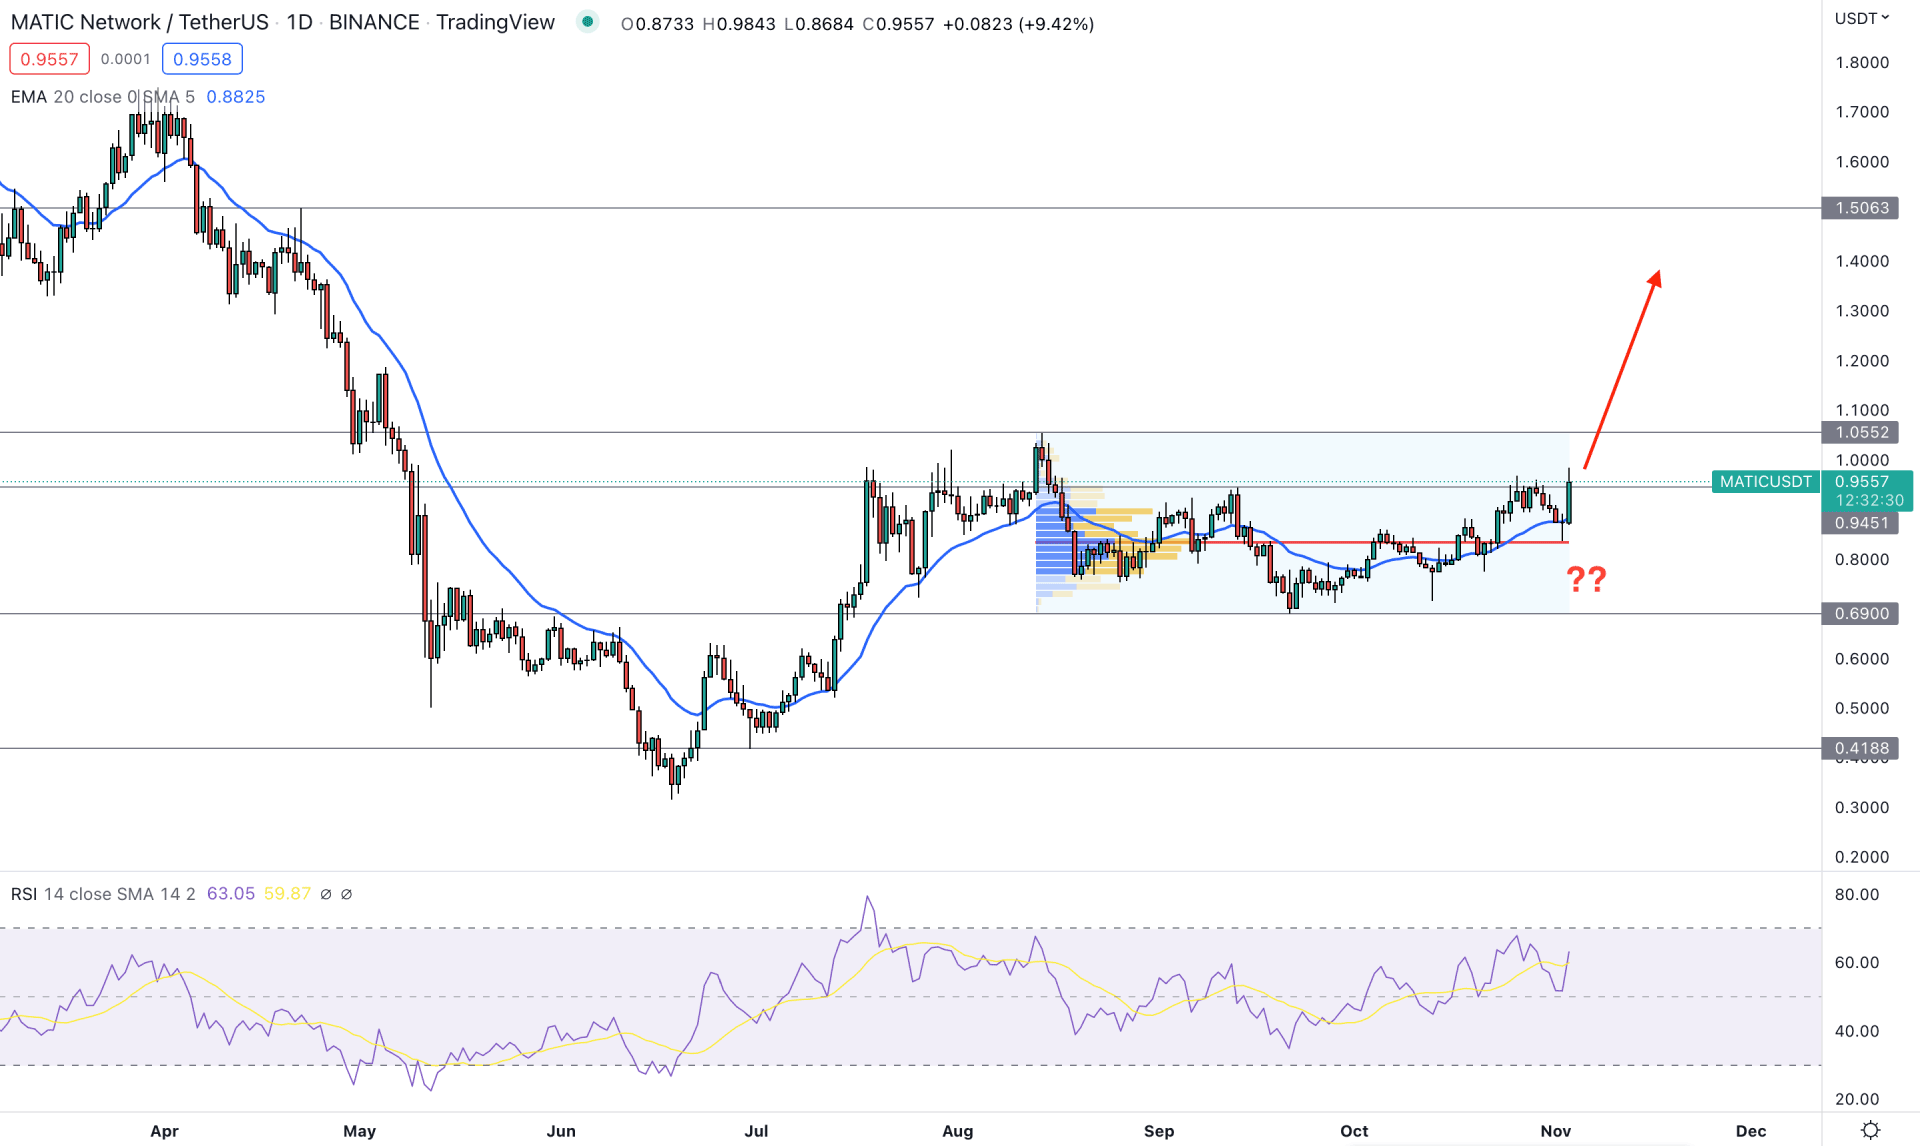
MATIC/USDT daily chart shows how selling pressure has weakened after making a significant low in June 2022. Price made a sharp selling pressure to the 0.315 level and formed a bullish breakout, followed by a Cup and Handle price pattern. If you are with our previous MATIC/USDT technical analysis, you are already in a huge gain.
In the recent chart, the price remained corrective in a zone where the current bullish pressure is solid above the fixed range high volume level from the August high to October Low. In that case, the primary trading idea of this instrument is to find a bullish opportunity as long as it remains above the 0.833 high volume level.
According to the current position of the 20 days Exponential Moving Average, the buying pressure is supported by short-term and medium-term investors, which could offer a decent trend trading opportunity.
The indicator window also shows the same scenario as the current RSI level is above the 50% area and yet to reach the overbought 70% level.
Based on the current daily structure, the buying possibility is valid in this pair if any intraday bullish signal appears. In that case, the target for the upside pressure would be towards the 1.50 level in the coming days.
However, breaking below the 0.6900 level could alter the current bullish scenario. In that case, bears may regain momentum by taking the price down to the 0.4188 key support level.
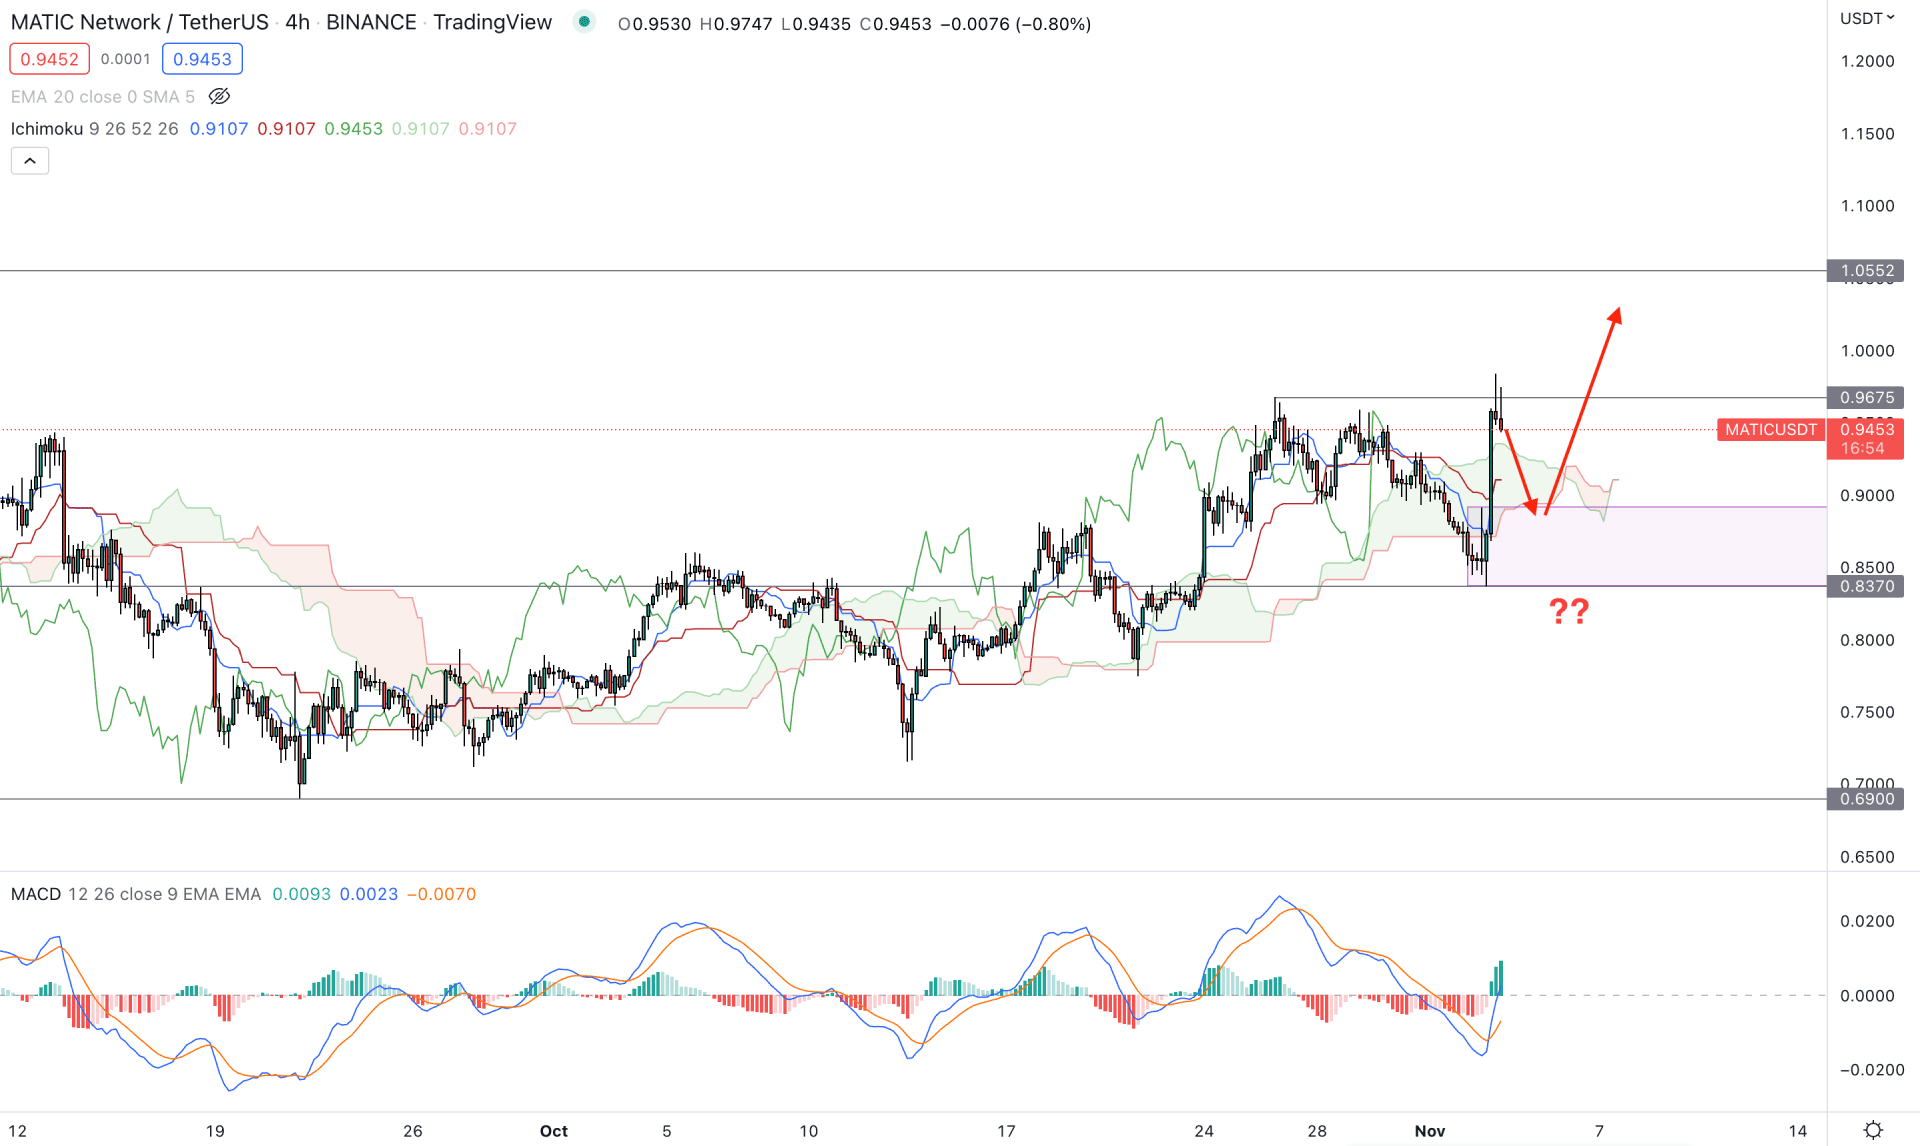
In the H4 chart, MATIC price shows a decent bullish opportunity as the current price has been above the Kumo Cloud for a considerable time. Moreover, the recent price action shows a new swing high above the 0.9676 level, which could trigger buyers’ interest in this instrument.
However, a minor bearish correction is still pending in this instrument as there is a gap between the price and the future cloud. Moreover, the thickness of the future cloud is not solid, which needs the price to hold above the cloud support to indicate strength in the bullish trend.
The MACD Histogram is bullish in the indicator window, where the MACD lines form a bullish crossover.
In this H4 structure, a minor bearish correction and bullish pressure could trigger a buying possibility where the main aim is to reach the 1.0552 resistance level. However, an alternative approach is available if an H4 candle closes below the 0.8370 support level. In that case, the selling pressure could extend towards the 0.6900 area.
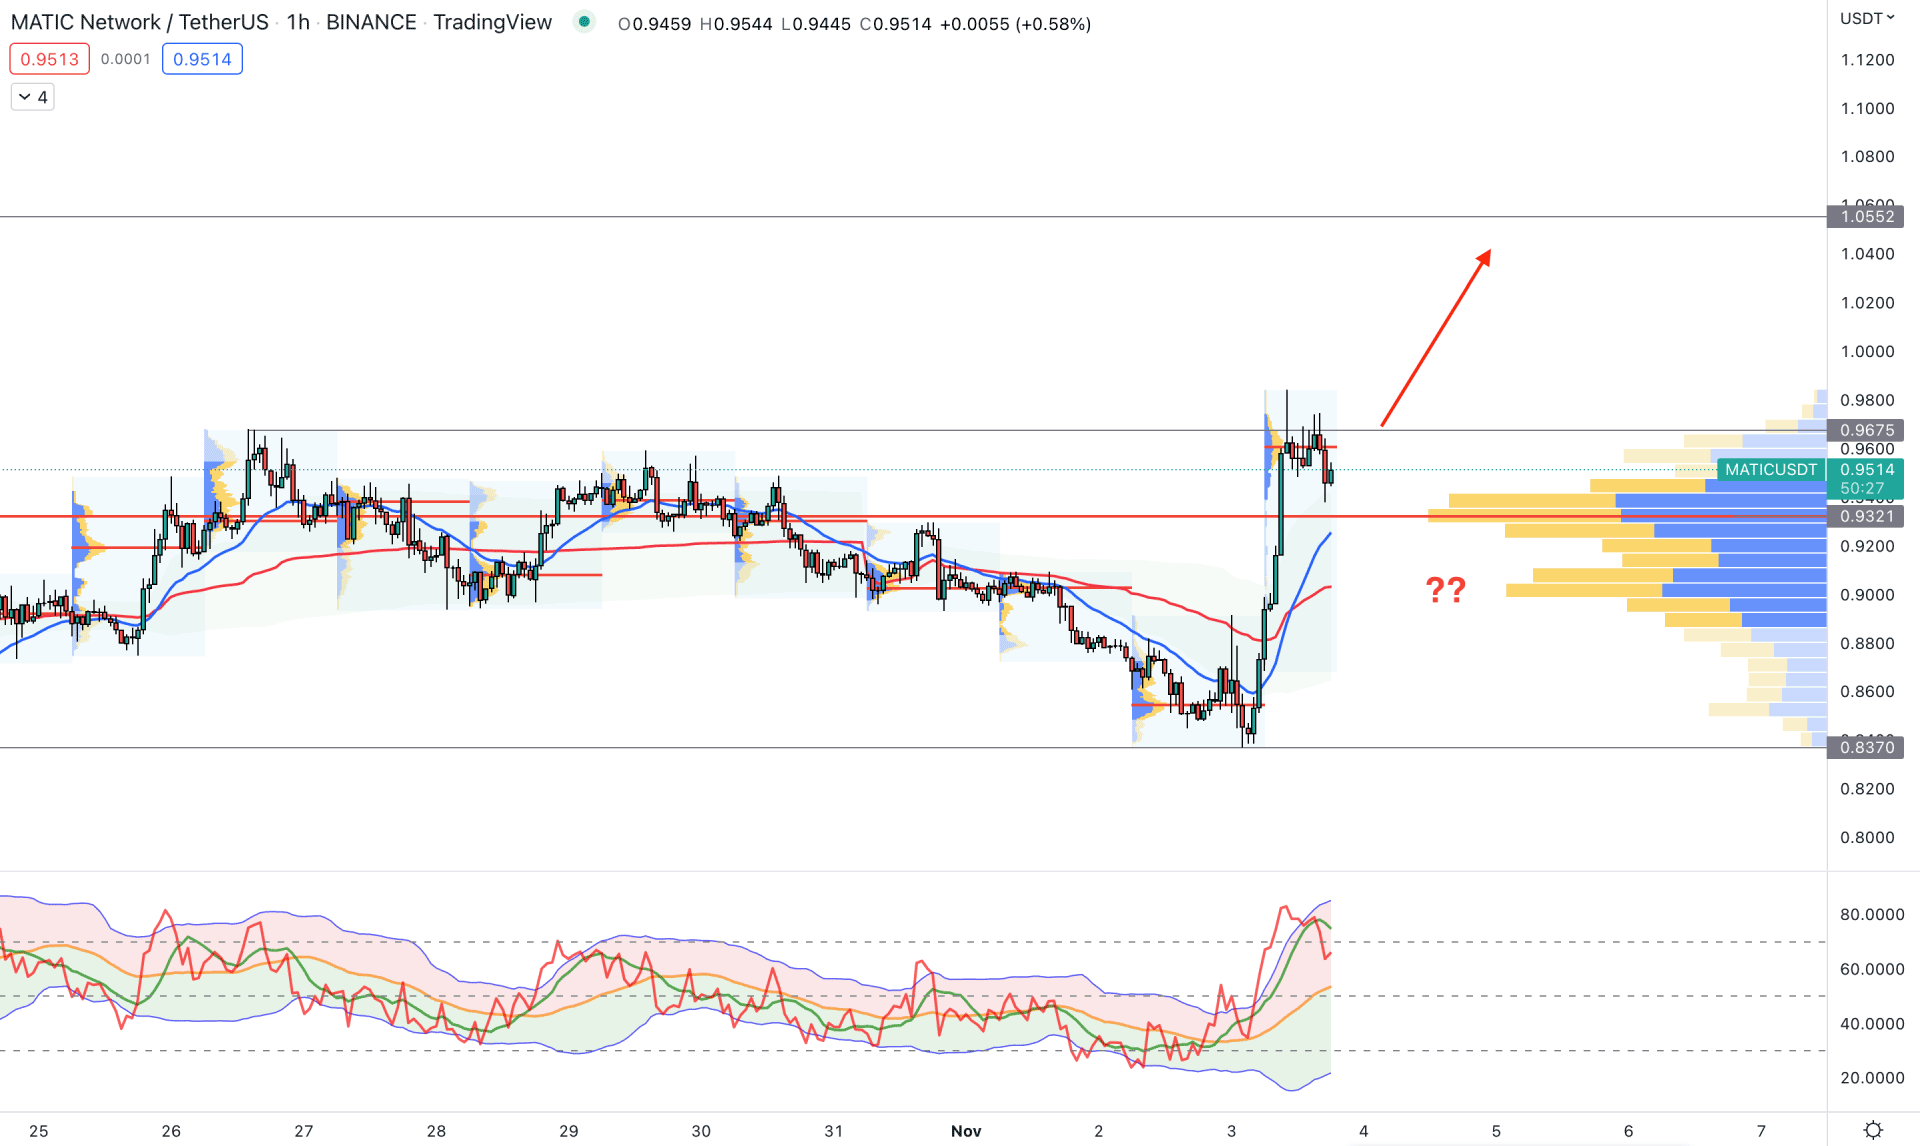
The significant part of the H1 timeframe is that the current price is trading within a bullish impulsive wave, where the visible range high volume level is closer to the price. In that case, the primary idea is that the price could jump again following the buying pressure with the support from volume.
The dynamic 20 EMA and weekly VWAP are below the price, which signifies that bulls are active in the market and can extend the momentum at any time.
Based on the H1 chart, an immediate buying pressure with an H1 close above the 0.9675 level could increase the bullish possibility towards the 1.0552 level. However, breaking below 0.9200 could extend the correction towards the 0.8370 level.
Based on the current multi-timeframe analysis, MATIC/USDT is more likely to move higher where special attention to the intraday price is needed. However, a minor bearish correction is still pending in this instrument, which could validate the bullish signal.


