
Published: December 7th, 2022
The central bank of the Republic of Indonesia, Bank Indonesia (BI), has announced that CBDC, its central bank digital currency, will be used in the metaverse. This a highly positive move for blockchain networks that can host the biggest metaverse ecosystems, including Polygon.
Perry Warjiyo, BI governor, announced an event that said the digital rupiah currency of the central bank can also be compatible with other digital currencies of central banks in the future.
From this influx, blockchain networks will benefit like others that have already attracted significant metaverse adoption.
Arguably Polygon is one of the already succeeded protocols in global onboarding brands such as Reddit, Meta, Starbucks, Nike, Instagram, and other big players. Polygon already onboarded Flipkart, an Asian e-commerce giant with links to Walmart.
The influx of digital fiat can gain more attraction, and in the future, Polygon may become a scaling solution for CBDC. The consequence would also be positive for the native token of the Ethereum layer-2 scaling solution MATIC.
Technically, the MATIC price is trading above an important support level, while the broader fundamental outlook is bullish.
Should you invest in MATIC/USDT? Let’s see the future outlook of Polygon (MATIC) from the MATIC/USDT technical analysis:
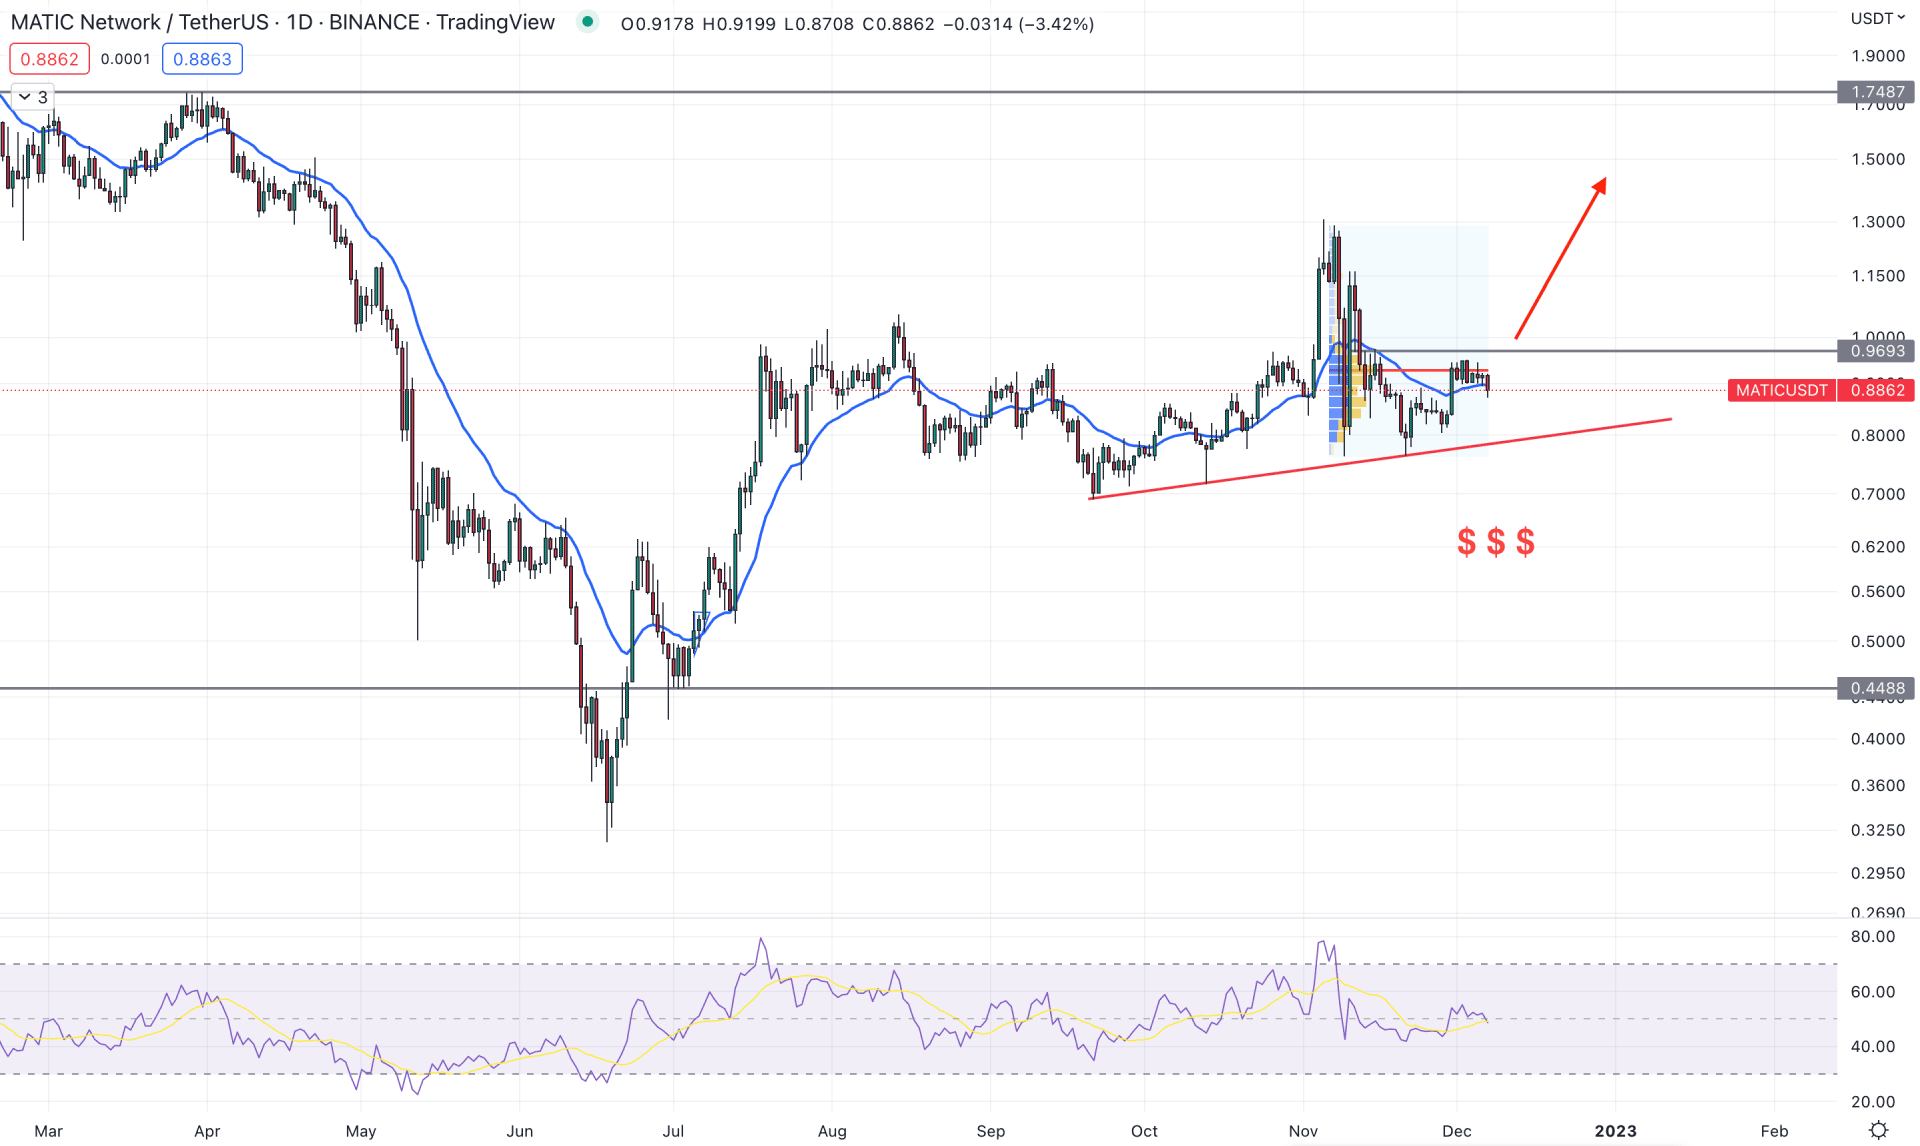
The daily price of MATIC/USDT is interesting as bulls and bears both tried to take control in recent trading days, which is a sign of a possible breakout.
The selling pressure in this instrument has faded after reaching the 0.3160 swing low from where bulls formed a counter-impulsive pressure. After making a bullish cup and handle pattern breakout, bulls are still active in the market as it is trading sideways after making a new swing high at the 1.3071 level.
On the other hand, the highest trading volume level from November high to low is at 0.9316 level, which is just above the current price and working as an immediate resistance. Therefore, as long as the current price is trading below this level, sellers have a higher possibility of taking control of the price.
The dynamic 20 days Exponential Moving Average is acting as resistance while the current RSI level is at the 50% neutral level.
Based on the daily outlook of MATIC/USD, the bearish possibility is solid as the current price is facing a bearish daily close from the 0.9361 level. In that case, bears have a higher possibility of grabbing the sell-side liquidity below the trendline support.
On the other hand, the bullish possibility needs a daily candle close above the 0.9693 resistance level, which will open room for reaching the 1.7487 resistance level.
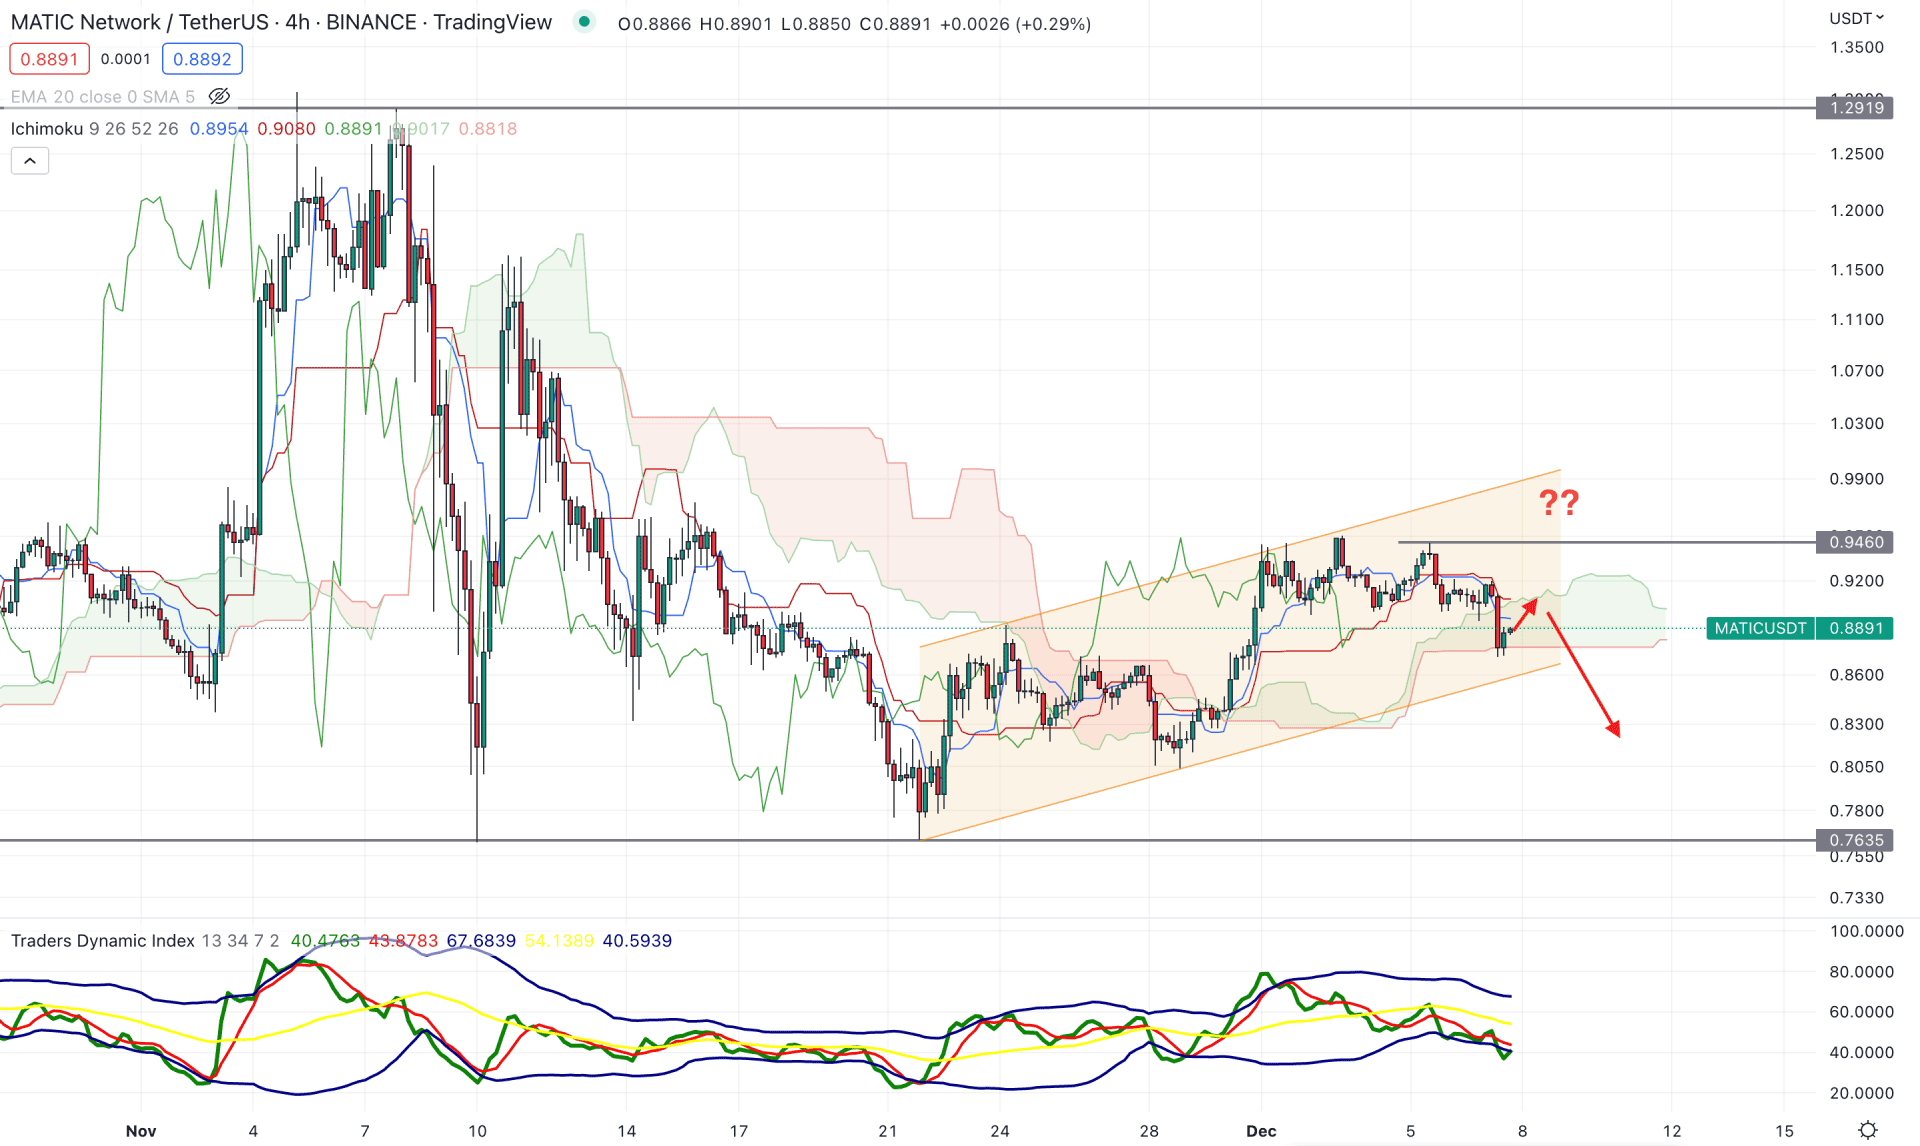
In the H4 timeframe, the current price is trading within an ascending channel formation where any bearish breakout could offer a short opportunity.
Although the price showed a bullish breakout above the Cloud support, it failed to form a new higher high. In that case, a bearish recovery would come with a high probable sell setup. The future cloud is still bullish, where the Senkou Span A is above the Senkou Span B but the thickness of the cloud is not solid.
Based on the h4 outlook, a new bearish H4 candle below the channel support would validate the bearish possibility, targeting the 0.7635 level.
On the other hand, the alternative approach is to wait for the price to form a bullish recovery by making a new high above the 0.9460 level, which could increase the possibility of reaching the 1.1500 area.
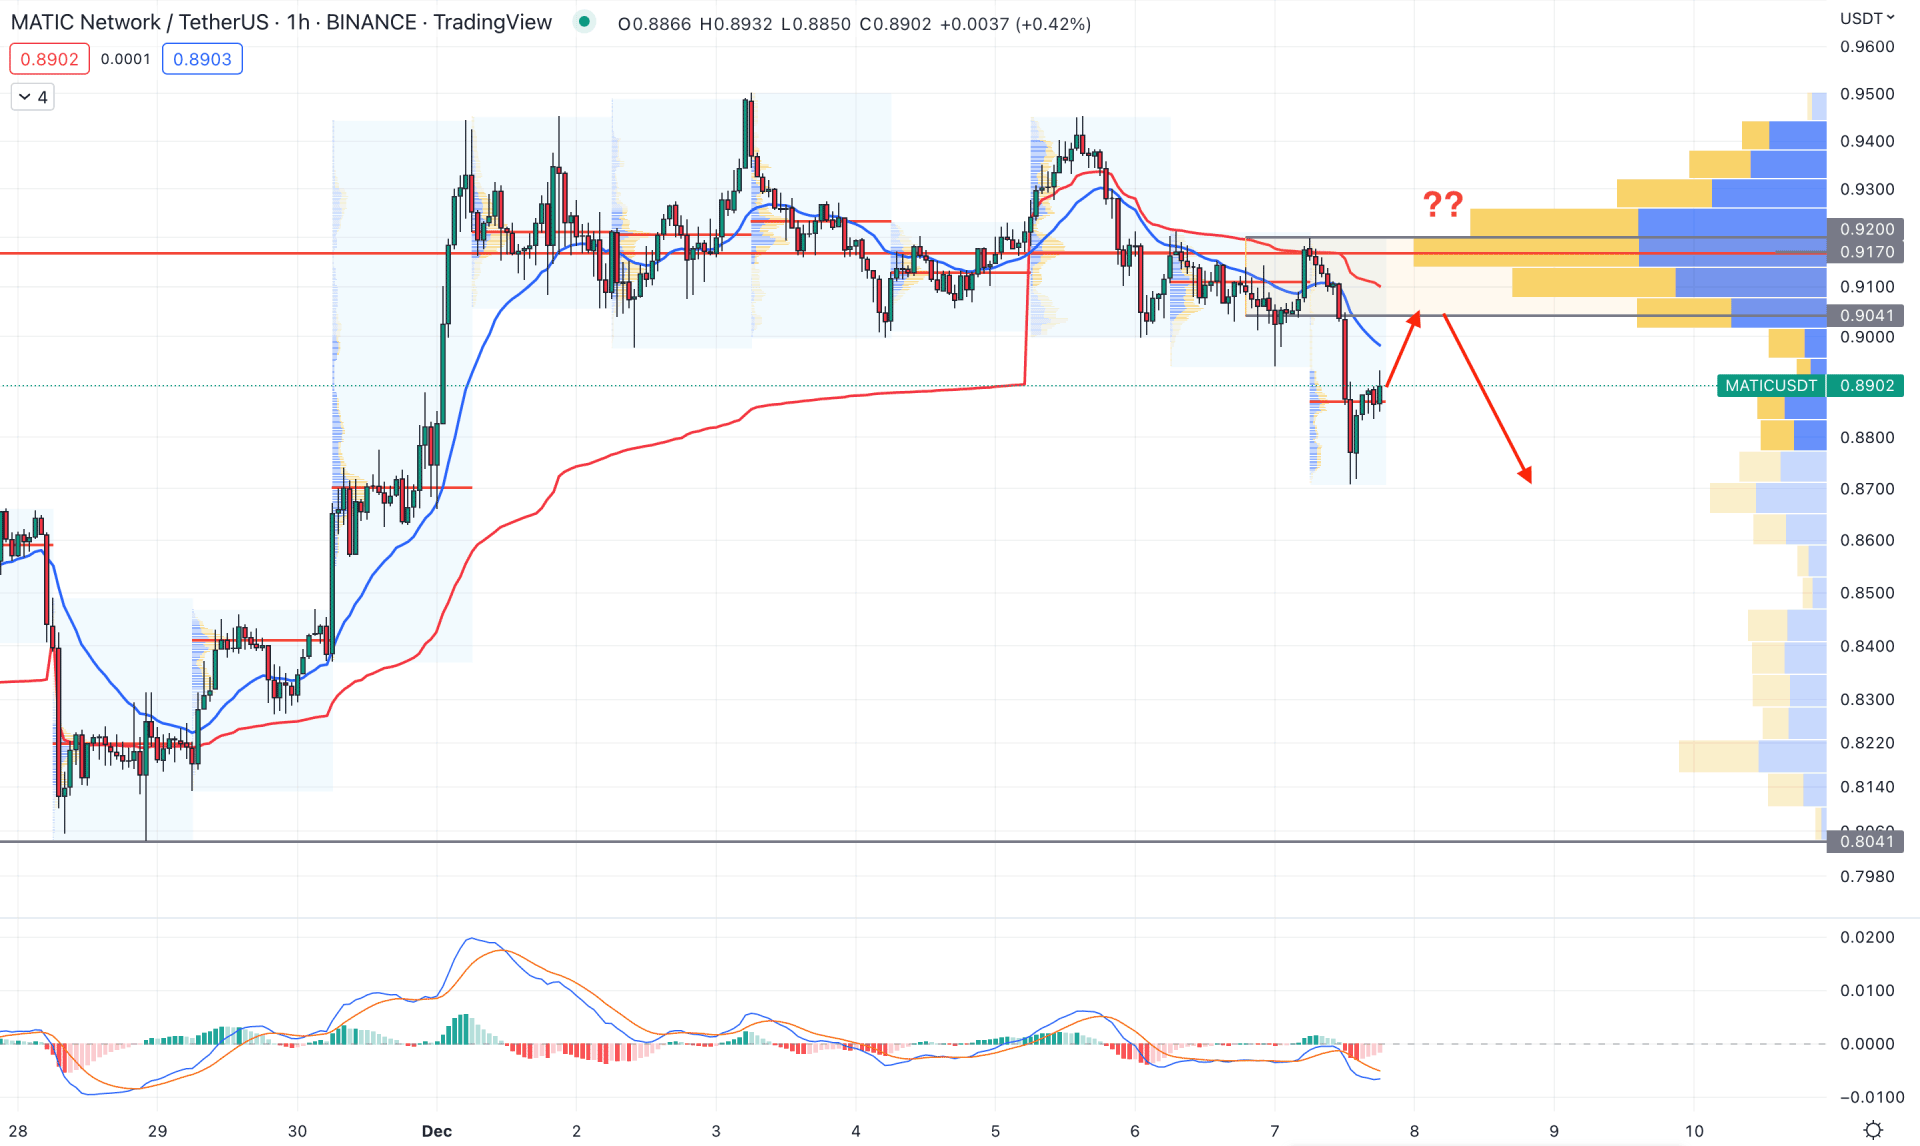
In the MATIC/USD hourly chart, the bearish possibility is clearly visible. The current price is trading below the visible range high volume level of 0.9170, which is a primary reason for looking at short setups.
Moreover, the weekly VWAP and dynamic 20 EMA are above the price, working as resistance levels. The MACD Histogram is also in the bearish territory, while MACD EMA’s are below the neutral line.
Based on the current price behavior, a bullish recovery is pending and any bearish rejection from the 0.9200 to 0.9041 area could offer a short opportunity, targeting the 0.8050 area.
The alternative approach is to wait for the price to move beyond the 0.9200 level, before aiming for the 0.9600 psychological level.
Based on the current findings, MATIC/USDT is not a buy yet. Investors should closely monitor how the price trades at the near-term resistance level as a bullish breakout is needed above the 0.9693 level before opening a long position.


