
Published: March 15th, 2022
Polygon is an Ethereum based token that provides a cheaper and faster transaction than Ethereum through the layer 2 sidechain. In 2021, MATIC price showed a 21000% gain from 0.012 to 2.42 level. Still the current price is 900% up from the 2021 low. It is clear that the huge gain is backed by higher investors' attention to the instrument. However, the major drawback of this network is its high transaction cost than other competitive networks.
On the other hand, Polygon works as a Layer 2 solution backed by Coinbase and Binance. It uses proof-stake and Plasma Framework as network validators. This allows the network to create and manage unlimited decentralized apps without any drawbacks.
MATIC is the native token for the Polygon network that runs through the ERC-20 Ethereum blockchain. There are 7.69 Billion Matic tokens in supply against the 10 Billion max supply. This token is currently trading 53% down from the December 2021 peak. However, the near-term price action and the squeeze to the symmetrical triangle might provide a buying opportunity in the MATIC/USDT price.
Let’s see the upcoming price direction from the MATIC/USDT technical analysis:
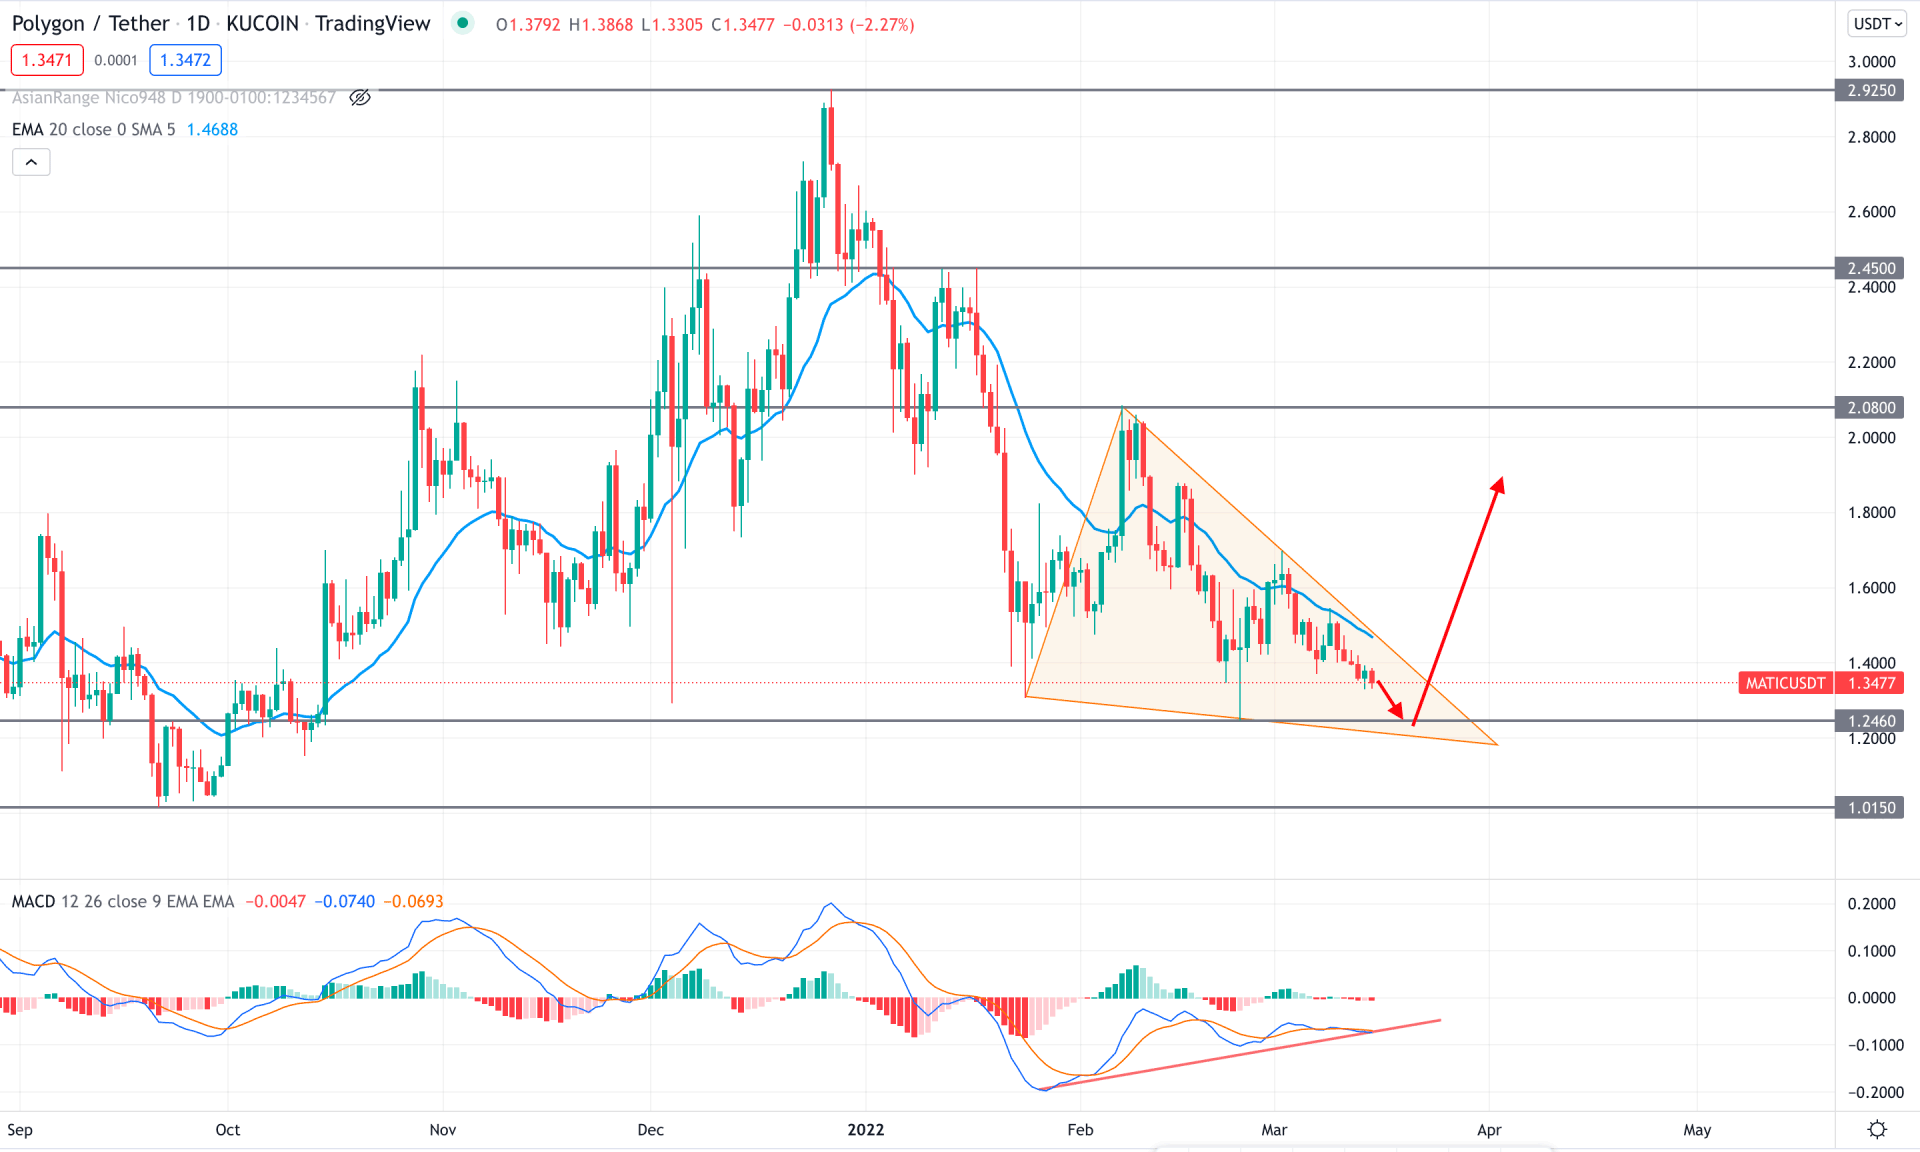
The MATIC/USDT daily chart shows that the price is trading within a strong bearish trend starting from the December 2021 peak. Moreover, the bearish pressure increased as the bullish swing in February 2022 failed to hold the momentum above the 2.0800 key resistance level. The bearish pressure resumed with the bullish rejection and moved sideways after testing the 1.2460 low. The recent price action squeezes the existing bearish momentum through a symmetrical triangle formation, which is an important price action tool.
The above image shows how the price formed a divergence with the MACD line, where the price made new swing lows in the chart, but MACD lines failed to follow it. On the other hand, the MACD Histogram remained corrective to the neutral zero level, indicating a possible breakout in the triangle pattern. The price is still below the dynamic 20 EMA, where a bullish correction is pending to complete the triangle pattern.
Based on the current price action, the buying opportunity in this pair is available from 1.2460 to 1.0150 area, from where a strong bullish rejection candlestick might increase the bullish possibility. In that case, investors should closely monitor the intraday price action to find an affordable buying price.
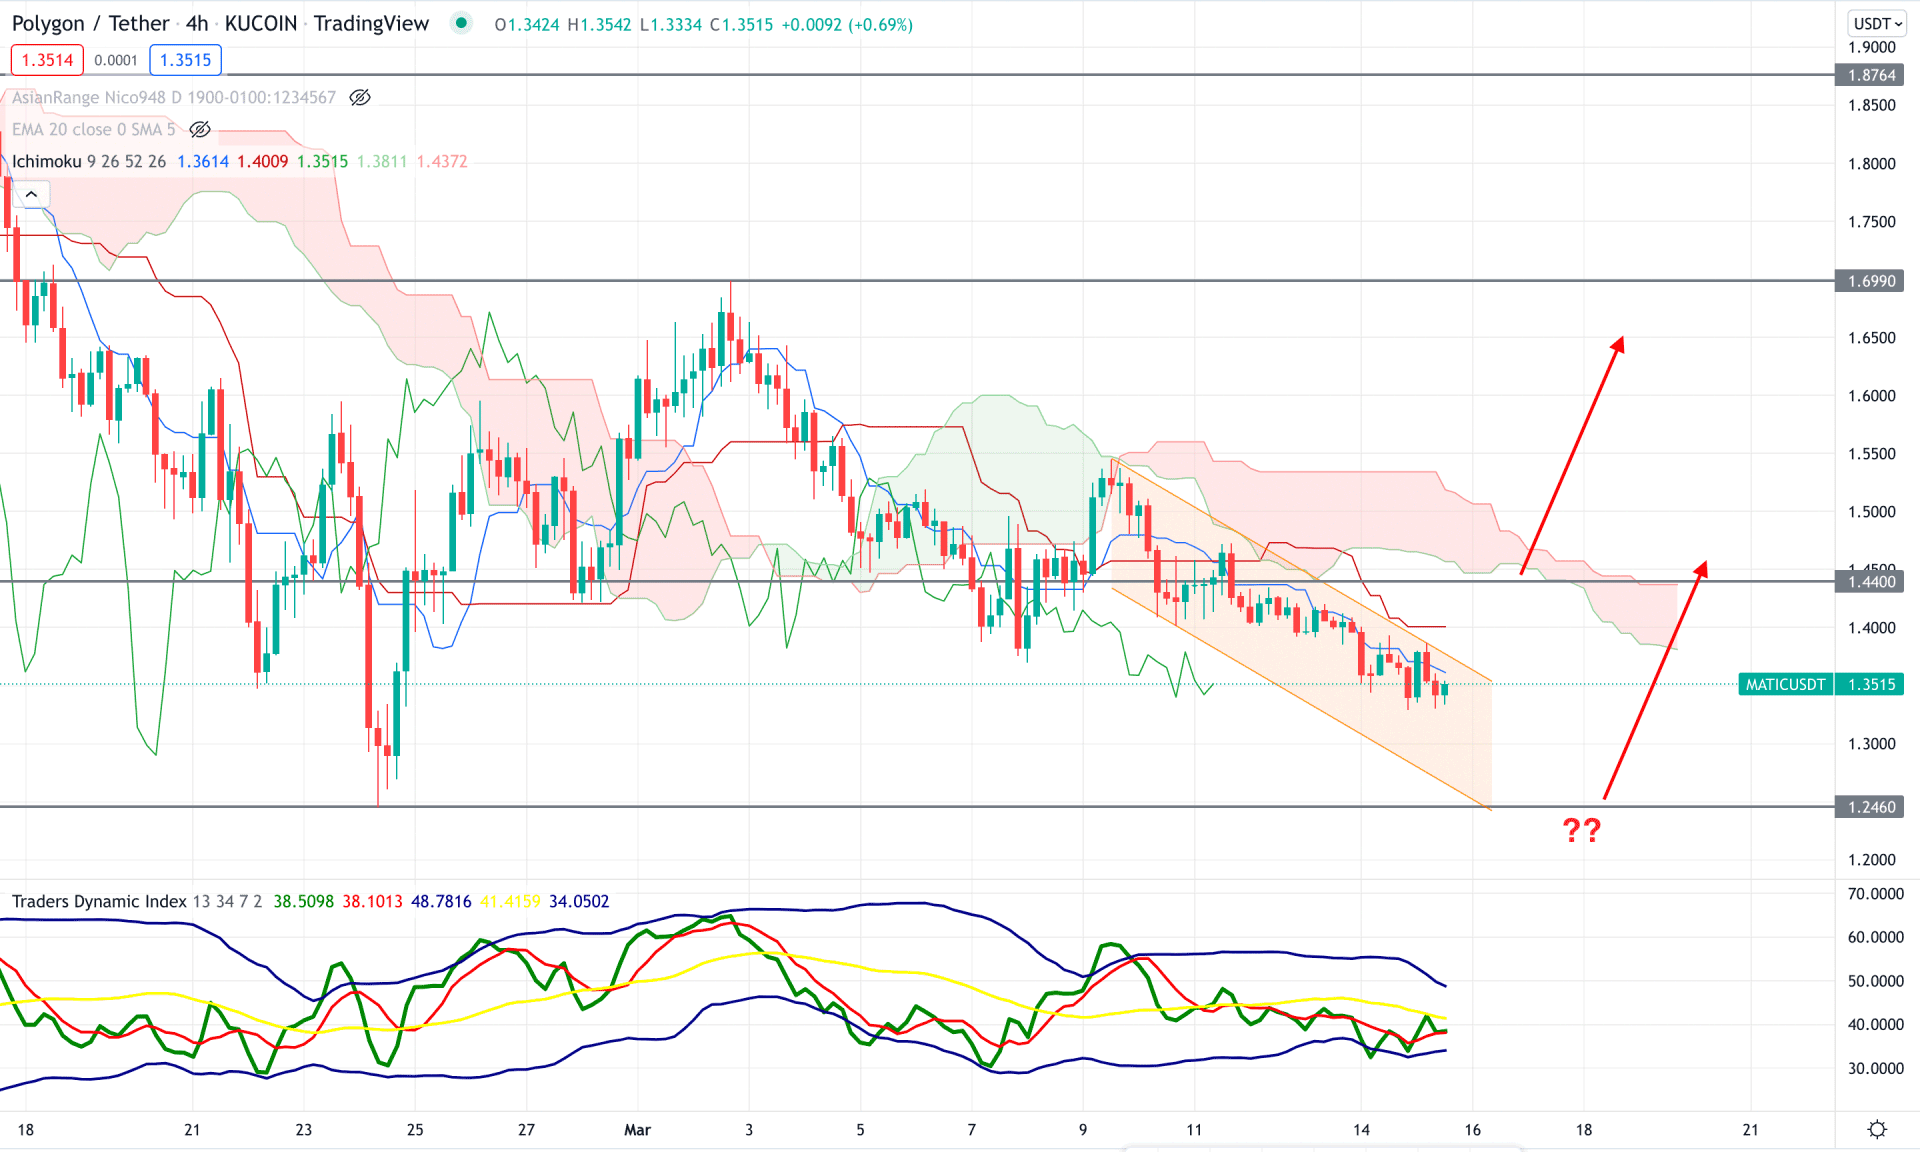
In the MATIC/USDT H4 chart, the current market trend is bearish as the price failed to hold the bullish momentum above the Kumo Cloud on 9th March. Later on, bears took the price below the dynamic Kijun line while the future cloud extended its selling momentum.
The above image shows how the Traders Dynamic Index shows a corrective bearish momentum where the midline is below the 50 level. Meanwhile, the current price formed a bearish rejection from the dynamic Tenkan Sen while the near-term support level is at 1.2460 level.
Based on the current price structure, bulls should wait for a bullish cloud breakout before going long in this pair towards the target of 1.6990 resistance level. On the other hand, extending the current bearish trend with a bearish rejection from dynamic Kijun Sen might lower the price towards the 1.2000 area.
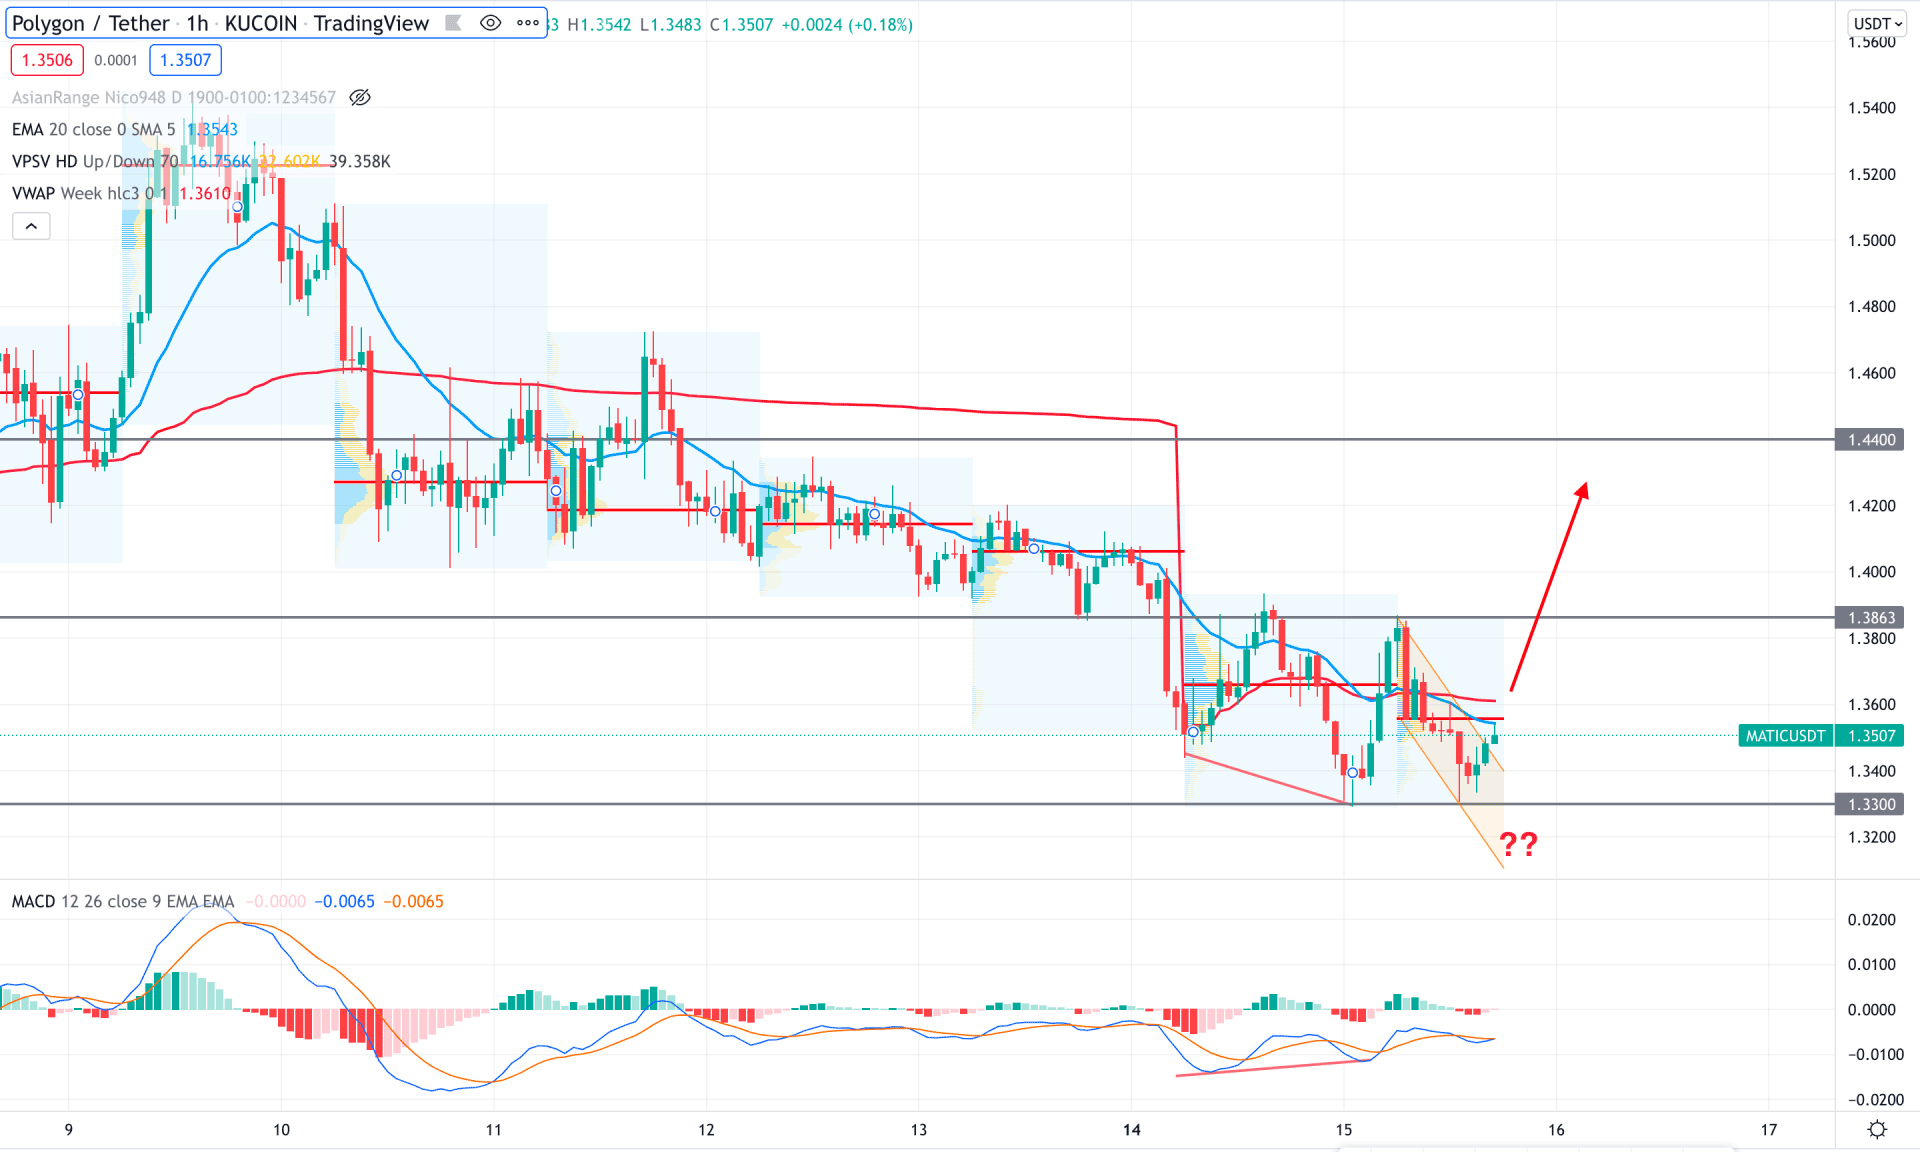
In the intraday chart, the MATIC/USDT is trading within a bearish trend in the intraday chart where the current price failed to hold the selling momentum below the 1.3300 key support level. However, the intraday high volume level is above the price, while the dynamic 20 EMA works as minor support.
The above image shows how the price formed a bearish rejection from dynamic weekly VWAP where the regular divergence is active with the MACD line. In that case, investors should find the price above the 1.3600 swing high with a bullish H1 candle to consider the upcoming price direction as bullish towards the 1.4400 level. On the other hand, the alternative approach is to wait for a bearish H1 candle below the 1.3300 level to lower the price towards the 1.3000 area.
Based on the current multi-timeframe analysis, MATIC/USDT bulls should await the symmetrical triangle breakout towards the upside to consider the upcoming price direction as bullish. In that case, any buying opportunity from the hourly chart might provide the best trading entry from the dynamic level breakout.


