
Published: February 9th, 2023
According to the latest update by the Polkadot management, the Moonbeam ecosystem has seen a boost in its cross-chain capabilities with the collaboration between Stella Swap, Squid, and Axelar network. This collaboration has allowed dApps built on Moonbeam to have access to new cross-chain functionality and a more seamless user experience.
Bitgreen, a sustainability-focused layer one on Polkadot, has launched two projects, one in Africa and another in Peru, to support sustainability efforts. These developments, along with Polkadot's continued ranking as the blockchain with the highest development activity in the past 30 days, demonstrate the growing momentum behind this platform.
Efinity has also contributed to Polkadot's NFT ecosystem by allowing users to create their own NFT collections within Efinity using Polkadot.
Additionally, Subsocial, a web3 social protocol that is moving to Polkadot, announced that developers building on its platform would be able to use the Crust Network for content storage, ensuring that user data is secure and free from censorship.
Santiment's data showed that following this announcement, Polkadot's NFT ecosystem has seen growth, as reflected by an increase in total NFT trade counts and trade volume in USD.
Should you follow the fundamentals? Let’s see the best price to buy this instrument from DOT/USDT technical analysis:
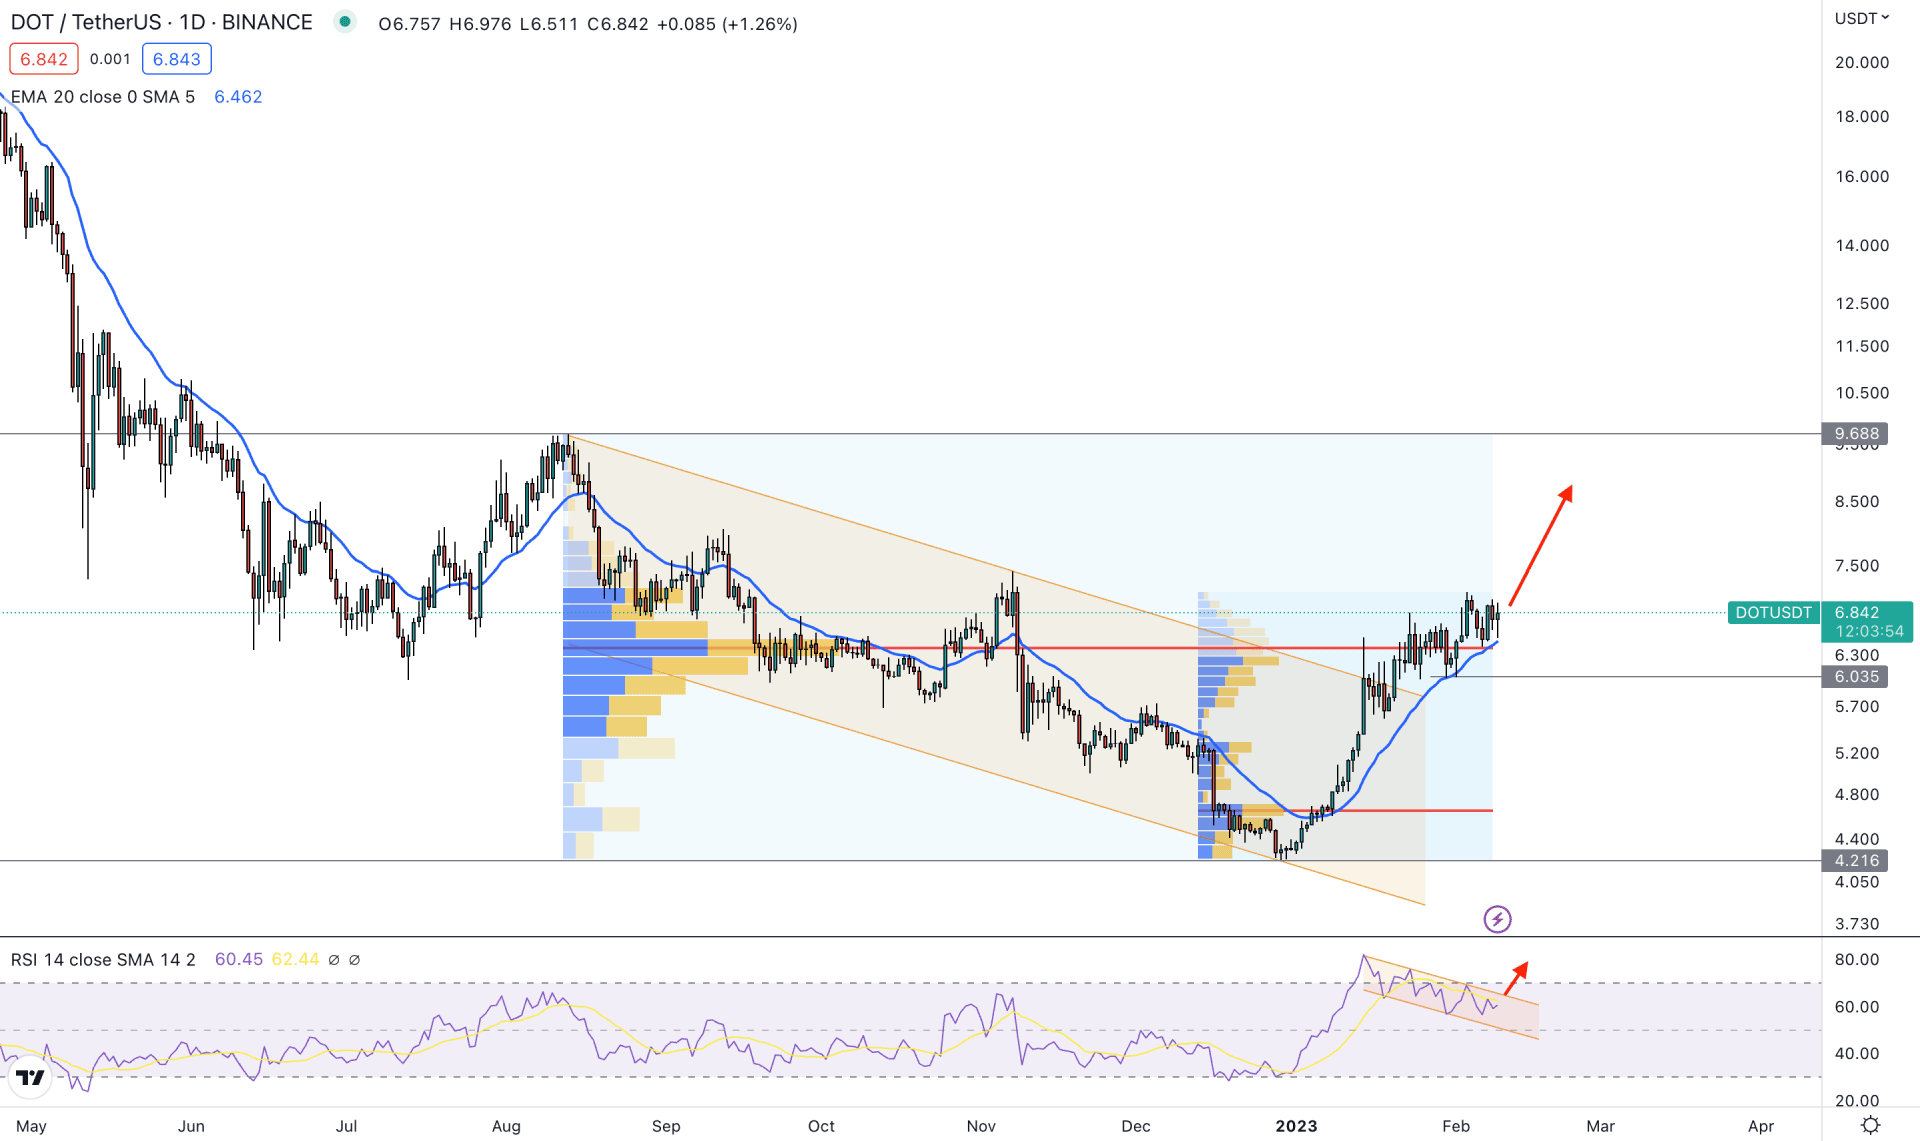
In the DOT/USDT daily chart, the broader market outlook is bullish as the current price is trading higher, with a dynamic 20 EMA carry.
Based on the visible range high volume level, the highest activity level from August to February was just below the current price, where the immediate support level is at 6.035 level. Moreover, another high volume level from the December low to the January high is at 4.652 level. It is a sign that the buying pressure from December 2022 came with institutional traders' interest, and they still hold the position.
Indeed, we cannot hold any trade for a very long time, so it is important to identify the tradable range. Based on the current price behavior, the top of the tradable range is 9.688 level from where a strong downside pressure had come in August 2022. On the downside, an immediate bullish recovery with an increased volume is spotted at the 4.219 level, which will be the bottom of the range. As the current market outlook is bullish, traders should maintain the 9.688 level as the primary target level.
In the main price chart, buying pressure is visible from the dynamic 20 EMA as it works as a support, with a bullish pre-breakout structure. The 6.035 level is also working as an immediate static support level.
The indicator window shows the same story: the RSI is holding a strong position above the 50% level with a bullish channel breakout possibility.
Based on the current daily outlook of DOT/USDT, any intraday buying pressure can increase the price towards the 9.00 area in the coming days. On the other hand, breaking below the 6.00 level with a daily candle close would eliminate the buying possibility and open rooms for reaching the 4.654 area.
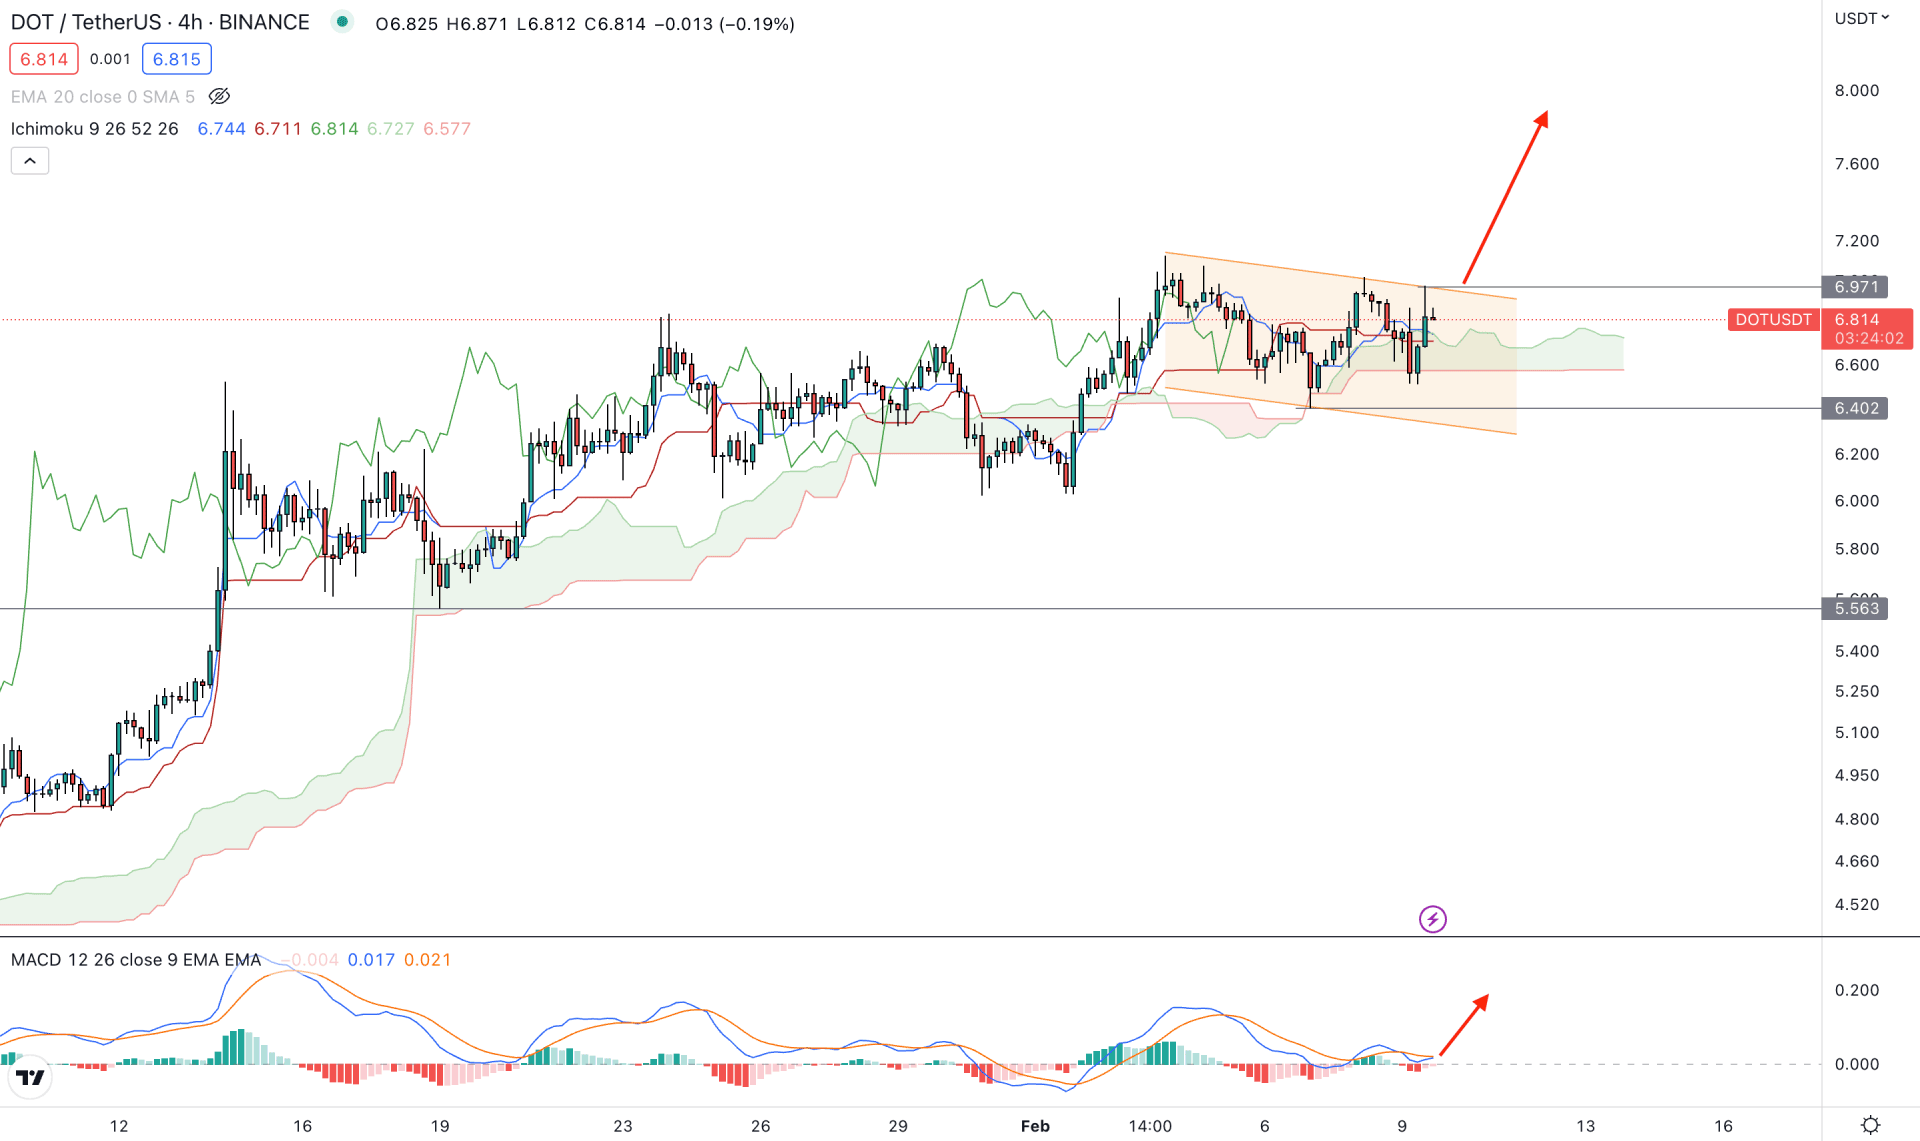
The price is trading within a bullish trend in the hourly time frame where the current momentum is corrective. In that case, another impulsive buying pressure is possible, but investors should closely monitor how it trades at the near-term support area.
The Senkou Span B is flat in the future cloud, which signifies a corrective nature from medium-term investors. On the other hand, Senkou Span A is coming down, which also signals less activity from bulls.
In the indicator window, the corrective price action is visible as the MACD Histogram is at the neutral zone. However, the upcoming price direction is still towards the buyers’ side.
Based on the H4 outlook, a bullish channel breakout and an H4 close above 6.971 could offer a bullish trend continuation opportunity, targeting the 8.00 area.
Conversely, a bearish pressure below the 6.30 level with a valid breakout could lower the price towards the 5.563 area.
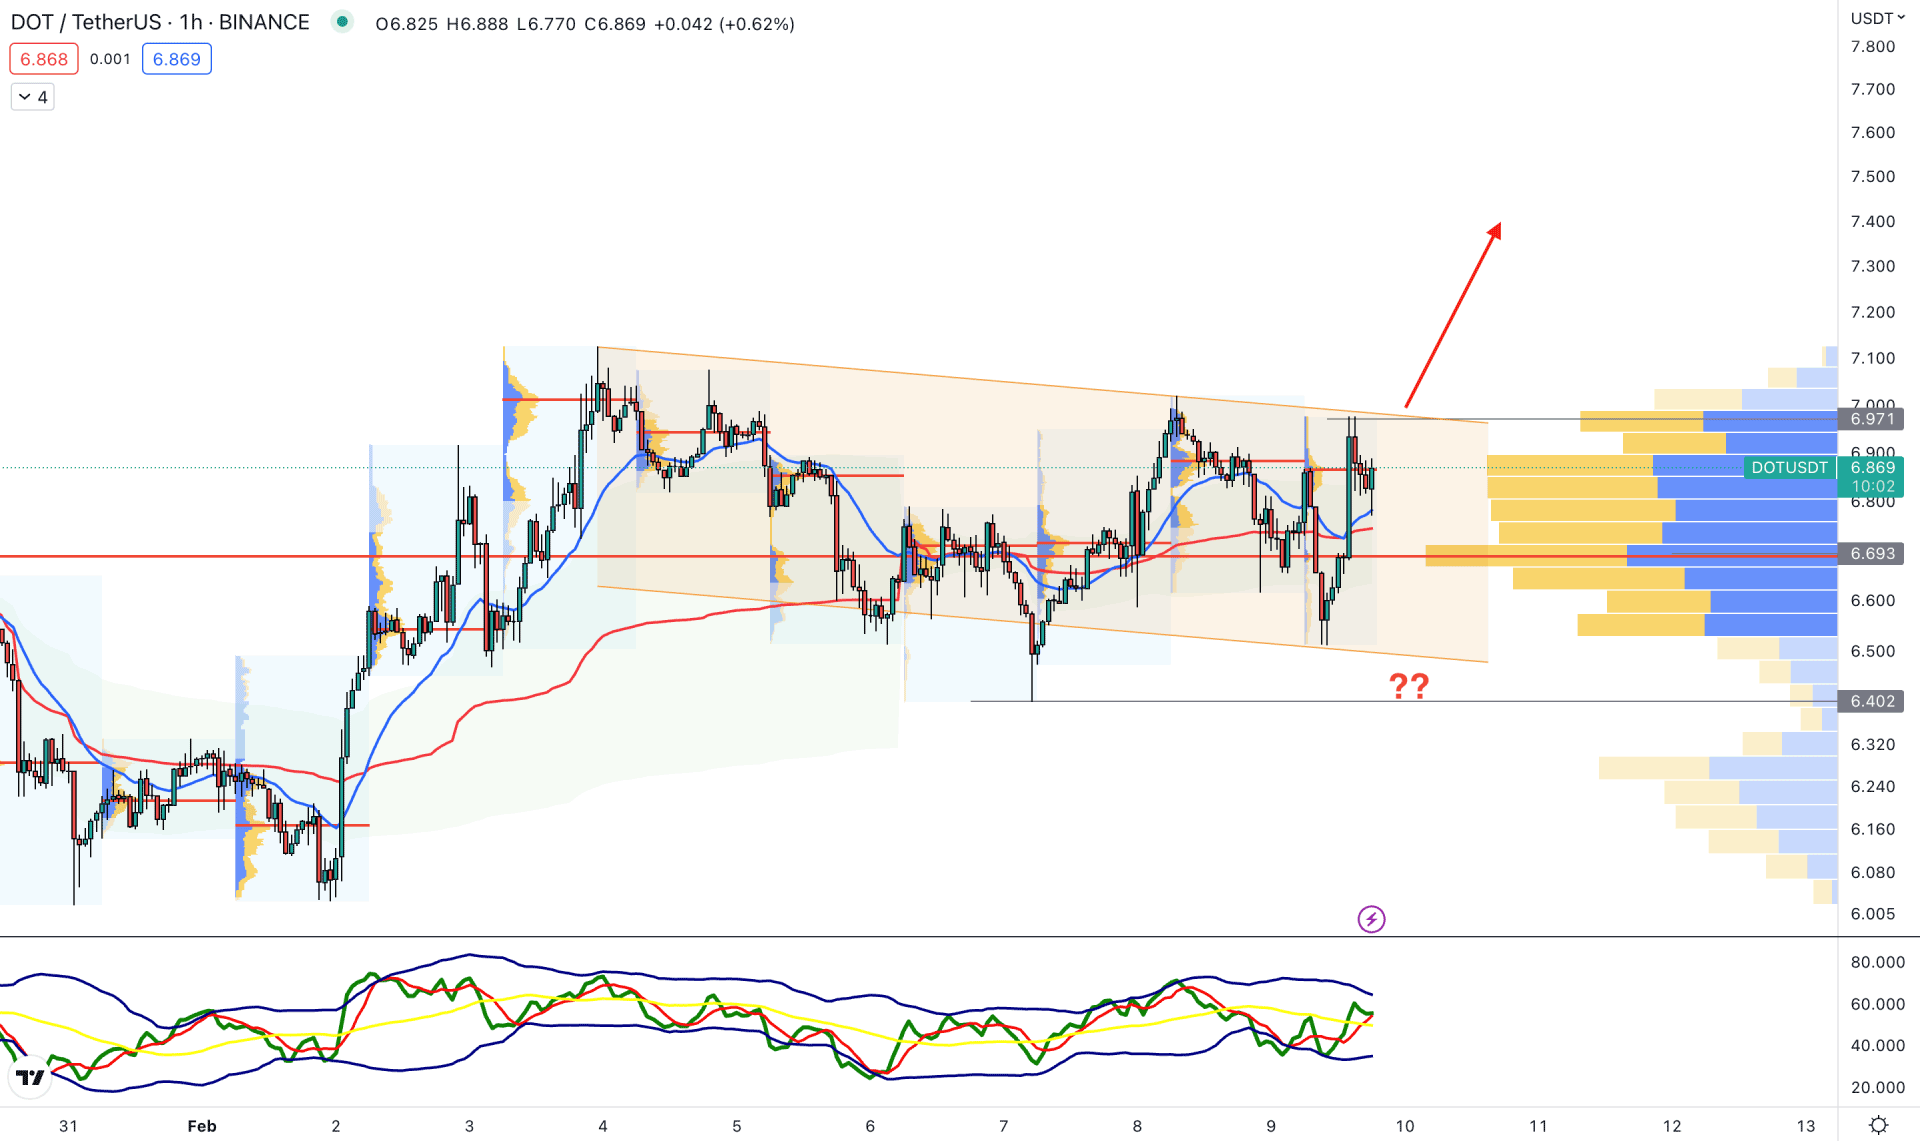
In the hourly chart, the current price is trading within a bullish trend where the visible range high volume level of 6.693 works as a support. Moreover, a descending channel backs up the buying pressure besides dynamic levels.
The 20 EMA dynamic level is below the price and working as a support. Meanwhile, the Traders’ Dynamic Index (TDI) shows buying pressure as it showed a rebound from the lower band.
Based on this price behavior, investors should consider the upcoming price direction as bullish, where a new H1 candle above the 7.00 level would be a bullish signal. On the downside, a break below the 6.40 level with an H1 close is needed to consider the upside possibility as invalid.
Based on the current price behavior, DOT/USDT is more likely to increase in the coming days, where the daily price already showed a bullish signal. Investors should monitor the hourly chart for a perfect breakout before joining the higher timeframe’s direction.


