
Published: August 4th, 2021
Polkadot aims to set up a more scalable parachain that can process transactions in a parallel manner. Therefore, investors can process more transactions in a second than Ethereum. Moreover, this system allows people to have more governance on their DOT tokens than others.
If we compare Polkadot with Ethereum, certain characteristics will keep this ecosystem ahead. Polkadot allows people to create their apps by communicating with ledgers of the relay chain, while Ethereum focuses on using “smart contracts.”
In a long-term view, there is a strong possibility that Polkadot will overtake Ethereum in the DeFi industry. However, investors should closely monitor how the current problems of the system are solved in the next update. Nevertheless, the recent development is impressive, and investors should see how the price reverses from the 2021 market crash.
Let’s see the upcoming price direction from the Polkadot (DOT) technical analysis:
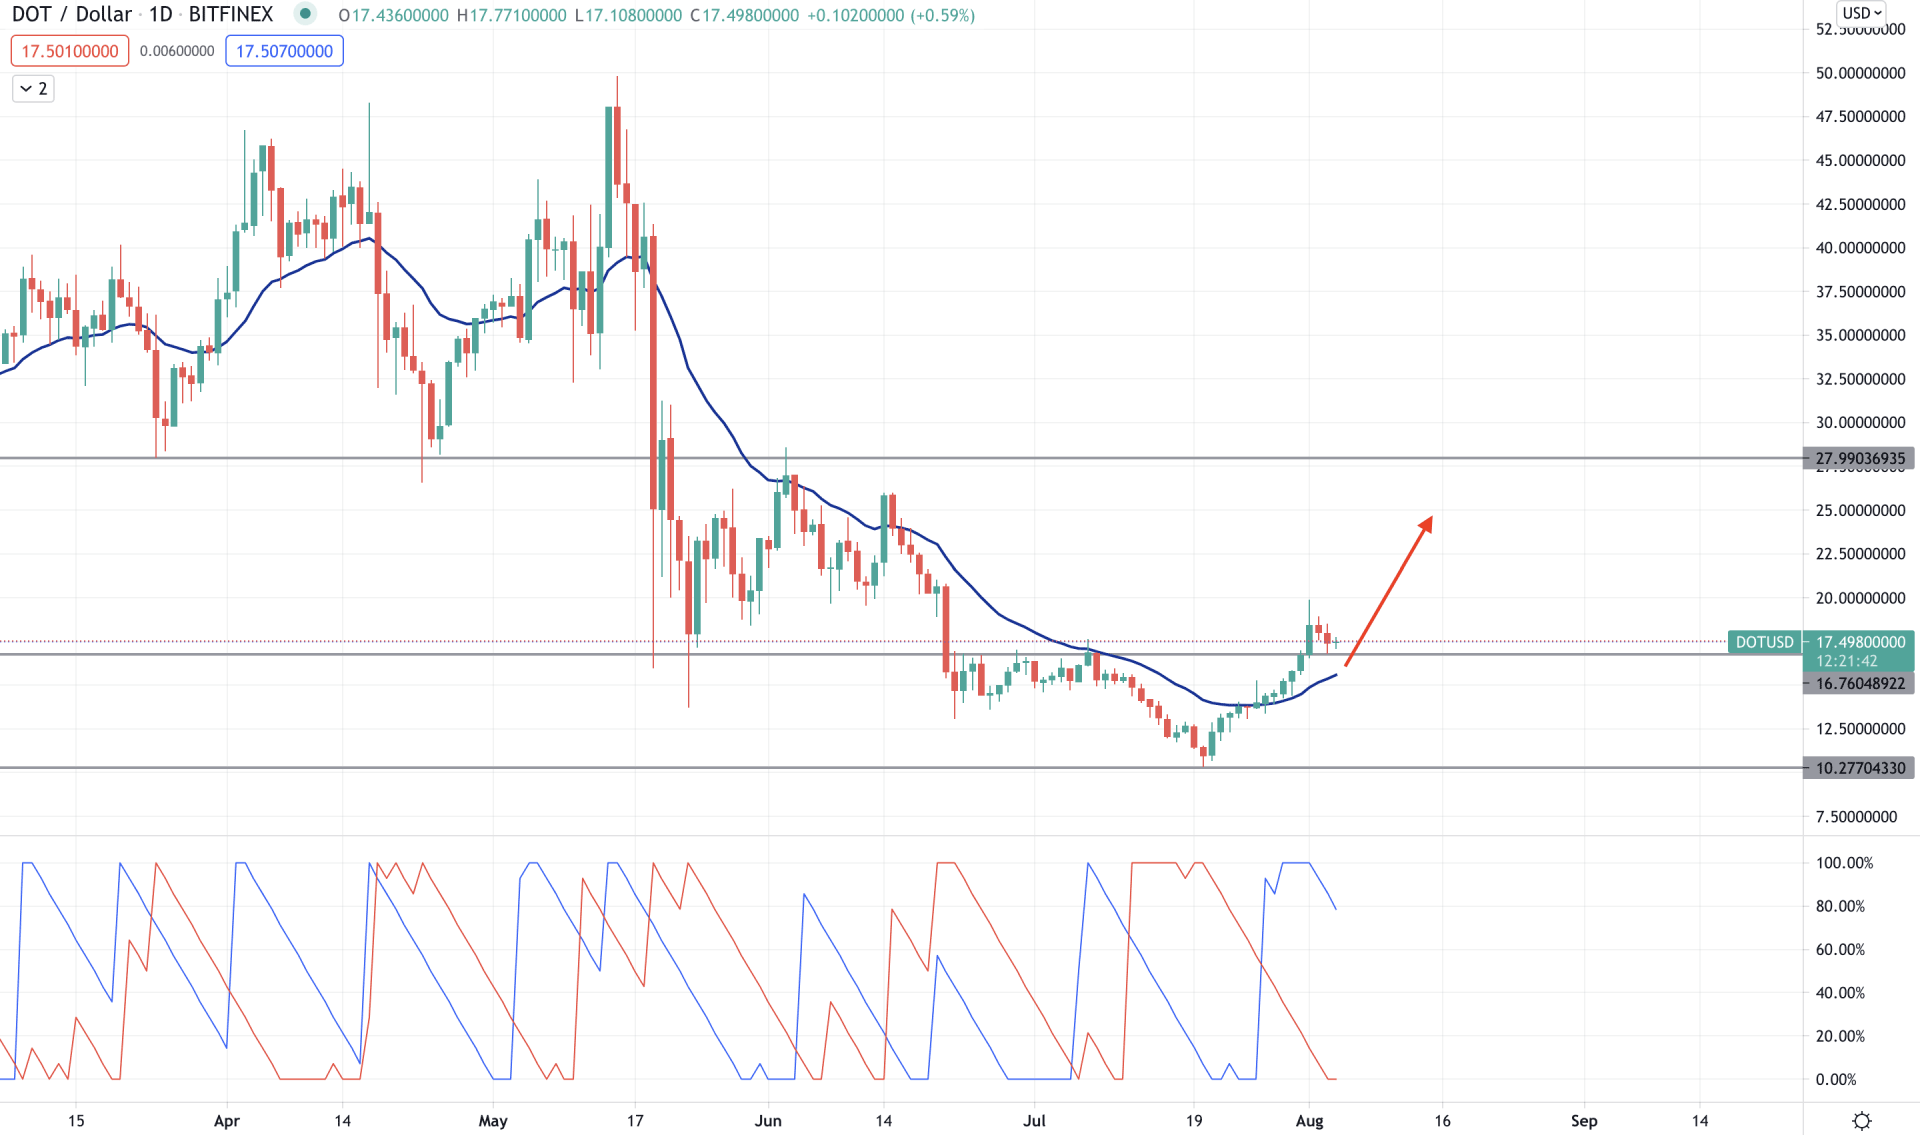
Polkadot showed an impressive movement since the beginning of 2021 by surging higher from 5.00 level to an all-time high of 49.60 level. However, the price moved lower, followed by the broader crypto market crash from China’s payment ban and concern about the excessive power usage by miners.
However, the sentiment changed now, and the price got a stable position above the dynamic 20 EMA after three months of bearish pressure. So now, as long as the price is trading above the dynamic 20 EMA and static 16.76 level, it is more likely to continue the bullish pressure in the coming days.
The indicator window shows that the Aroon Up (blue line) is above Aroon Down (red line), pointing out that the early trend shifted from bearish to bullish. However, the current sentiment is valid as long as the Aroon Up holds its position above the 50% level.
On the other hand, the price moved higher above the dynamic 20 EMA, where a correction is pending. Therefore, any rejection from dynamic 20 EMA may take the price higher towards the 27.00 level. On the other hand, a strong rebound below the psychological 15.00 level with a bearish daily close may alter the current market structure.
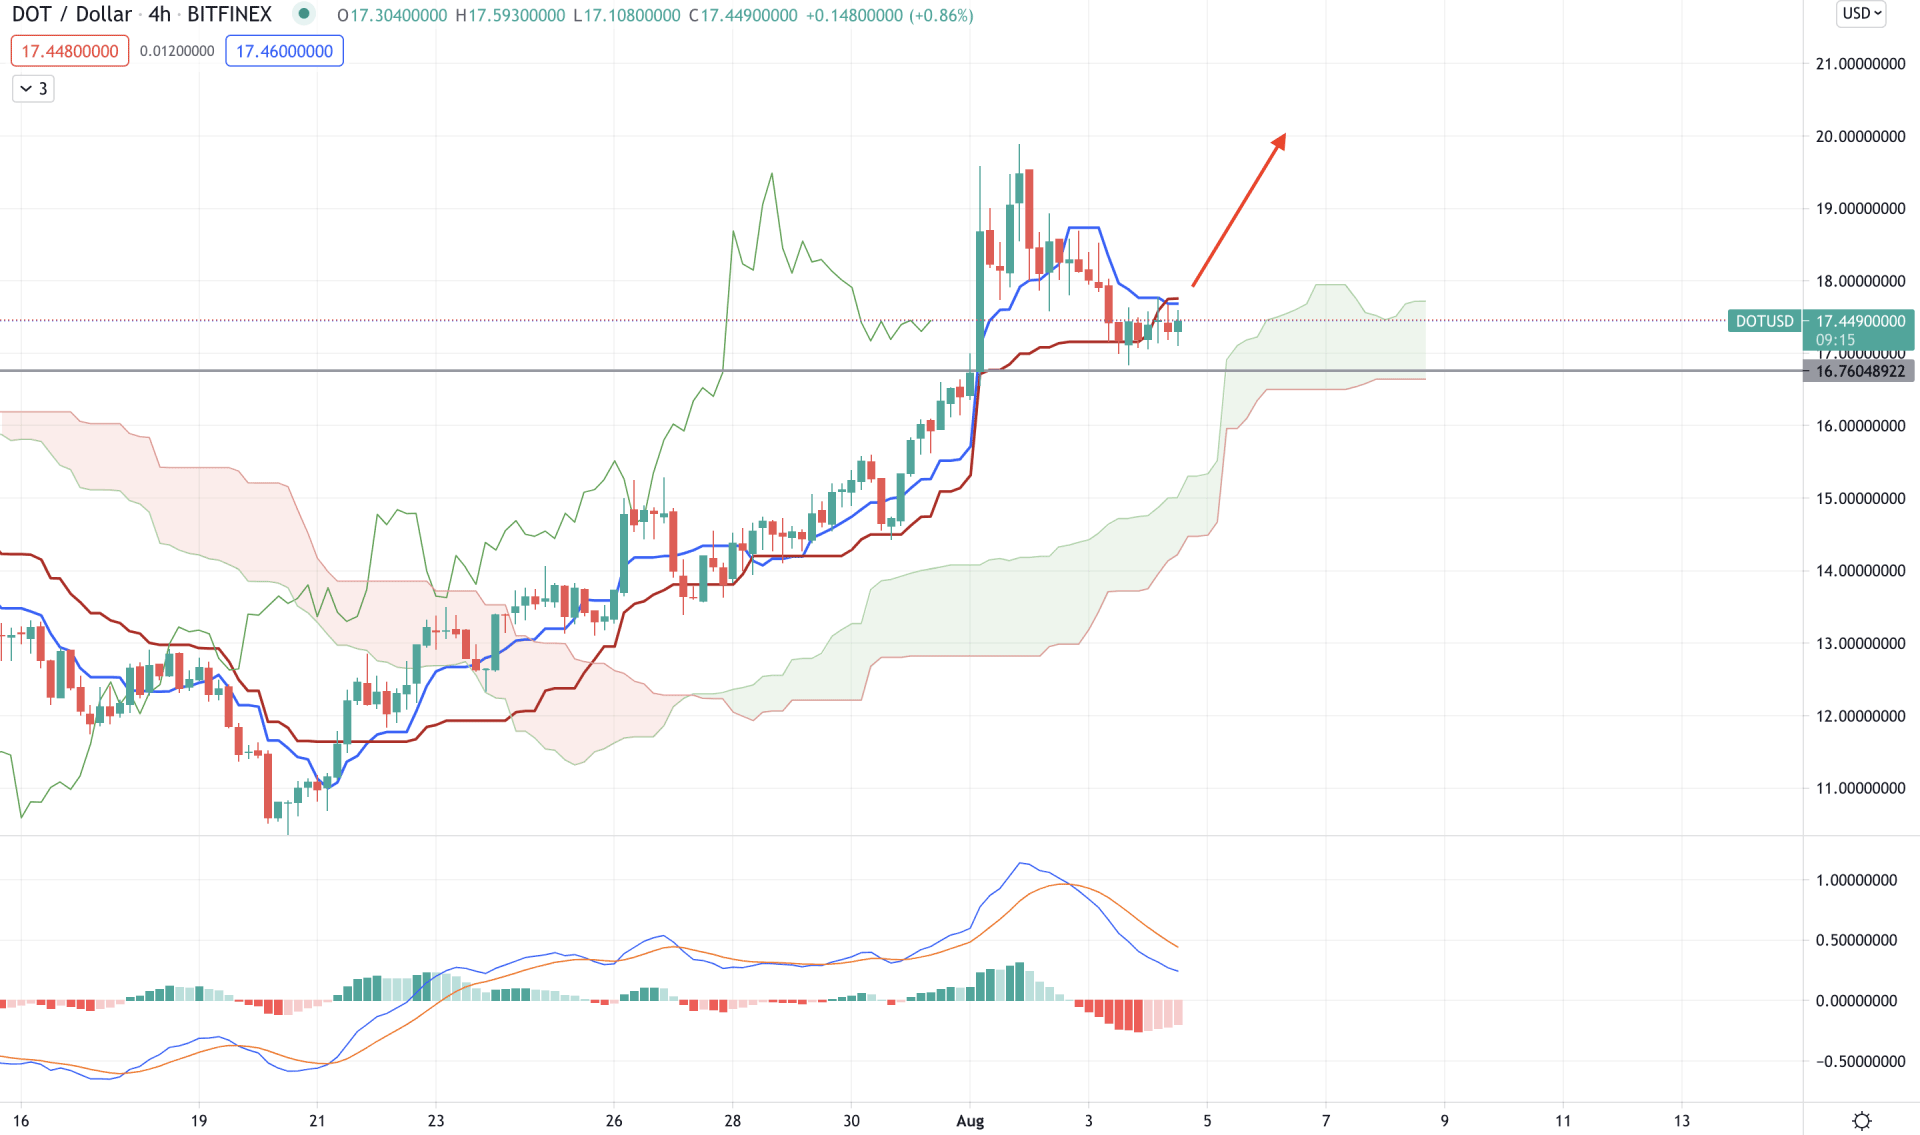
According to the Ichimoku Kinko Hyo, Polkadot’s price is strongly bullish as it moved above the Kumo Cloud with intense bullish pressure and held the position for a considerable time. In the future cloud, Senkou Span is above the Senkou Span B and aiming higher. In this market context, the overall market direction is bullish as long as the price is trading above the 16.76 event level, just above the cloud support.
The above image shows that the price corrected lower after a big candle breakout above the 16.76 level. Now any rebound from the correction may resume the current bullish trend. Tenkan Sen already crosses over the Kijun Sen, indicating that short-term buyers became active. However, traders should wait for an H4 close above the Kijun Sen to consider the buying possibility as highly probable.
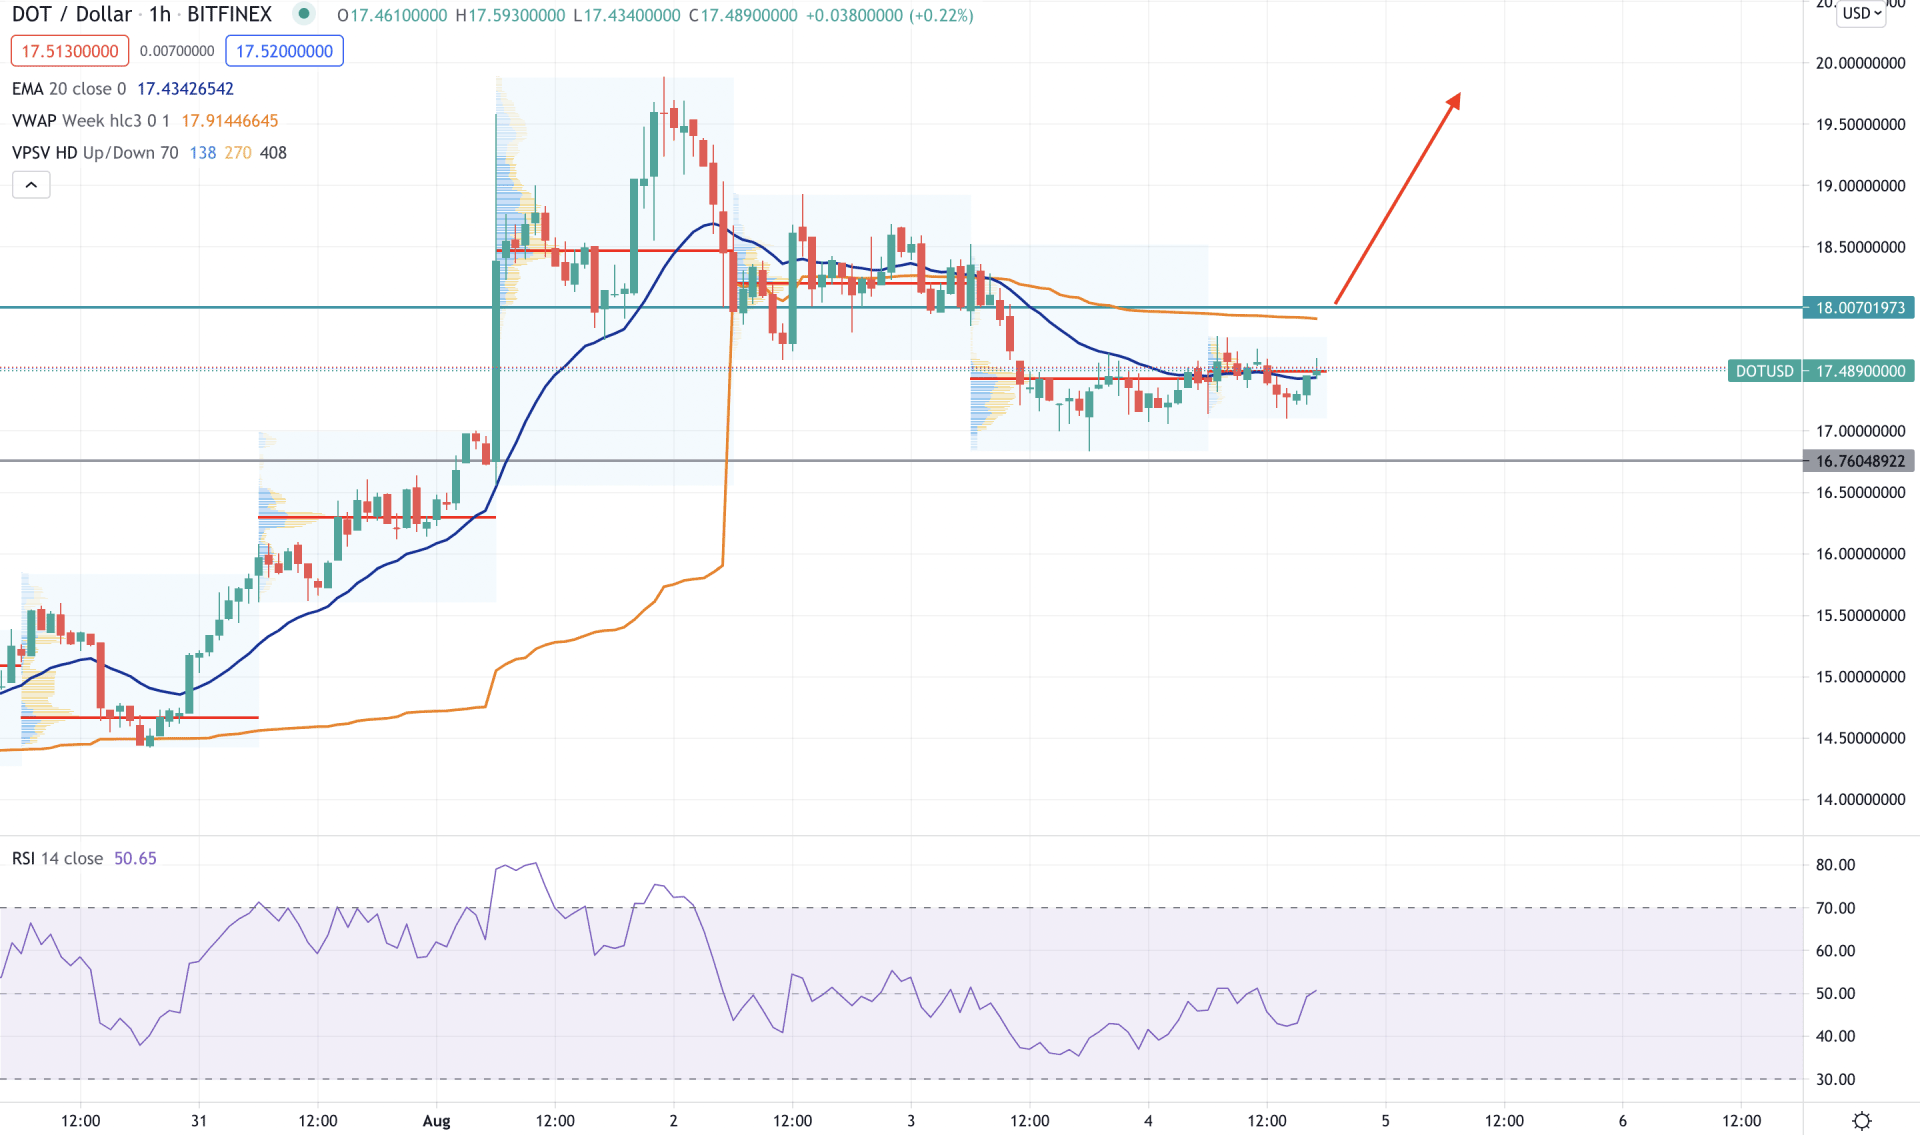
In the intraday chart, the Polkadot price is very volatile as the price remained closer to dynamic 20 EMA and vwap for a considerable time. Moreover, the most recent high volume levels are closer to the price, indicating less volatility. Although the price is above the 16.76 support level, it still struggles to break above the 18.00 intraday static level.
In the h1 chart, we can see that the price is trading at the intraday high volume level at 17.69 while the dynamic 20 EMA and vwap are working as minor resistance. In that case, a new intraday low with a strong bearish H1 close below the 16.76 level may initiate a broader bearish correction to the price with the target of 14.50 level.
On the other hand, the RSI is above 50 levels and moving higher. Therefore, a strong bullish breakout above the 15.00 level with an H1 close may resume the current bullish trend for the coming hours.
As of the above observation, the Polkadot price has a higher possibility of moving towards the $28.00 level as long as bulls hold the daily price above the 16.76 level. In that case, a bullish H4 close above the Kijun Sen may increase the buying pressure.
On the other hand, a stable bearish H1 close below the 16.76 level may alter the current market structure and take the price towards the 15.50 level.


