
Published: January 23rd, 2025
With the system's stablecoin count reaching a record high, the Polkadot (DOT) community has reached an important milestone. This rise demonstrates investor confidence in Polkadot's crypto infrastructure, which guarantees scalability and safety.
Polkadot's adoption of stablecoins has grown exponentially, causing USDT and USDC to reach record highs and reach an Asset Hub worth $114 million.
The growing popularity of Polkadot stablecoins demonstrates advancements in the digital asset market. Polkadot's improved scalability and lower transaction costs helped USDC and USDT gain popularity as stablecoins.
Polkadot's growth activity demonstrated a noteworthy leap with an evaluation of 60, along with a remarkable increase in stablecoin usage. This value growth reflects the infrastructure and creativity of the growing network.
Additionally, increased demand can result from strong growth. As a result, market participants continued to compete.
The Open Interest (OI) increased by more than 5.30% to $497 million in the last day. That meant new, lengthy additions.
Furthermore, the spot market statistics showed a notable outflow of more than $20 million in recent hours. This outflow activity revealed the removal of funds from exchanges, which might contribute to a possible spike in the days ahead.
However, with 59% of low bets held, the stock market's long/short ratio showed signs of bearishness. At the time, 41% of traders had long holdings.
Let's see the complete outlook from the DOT/USDT technical analysis:
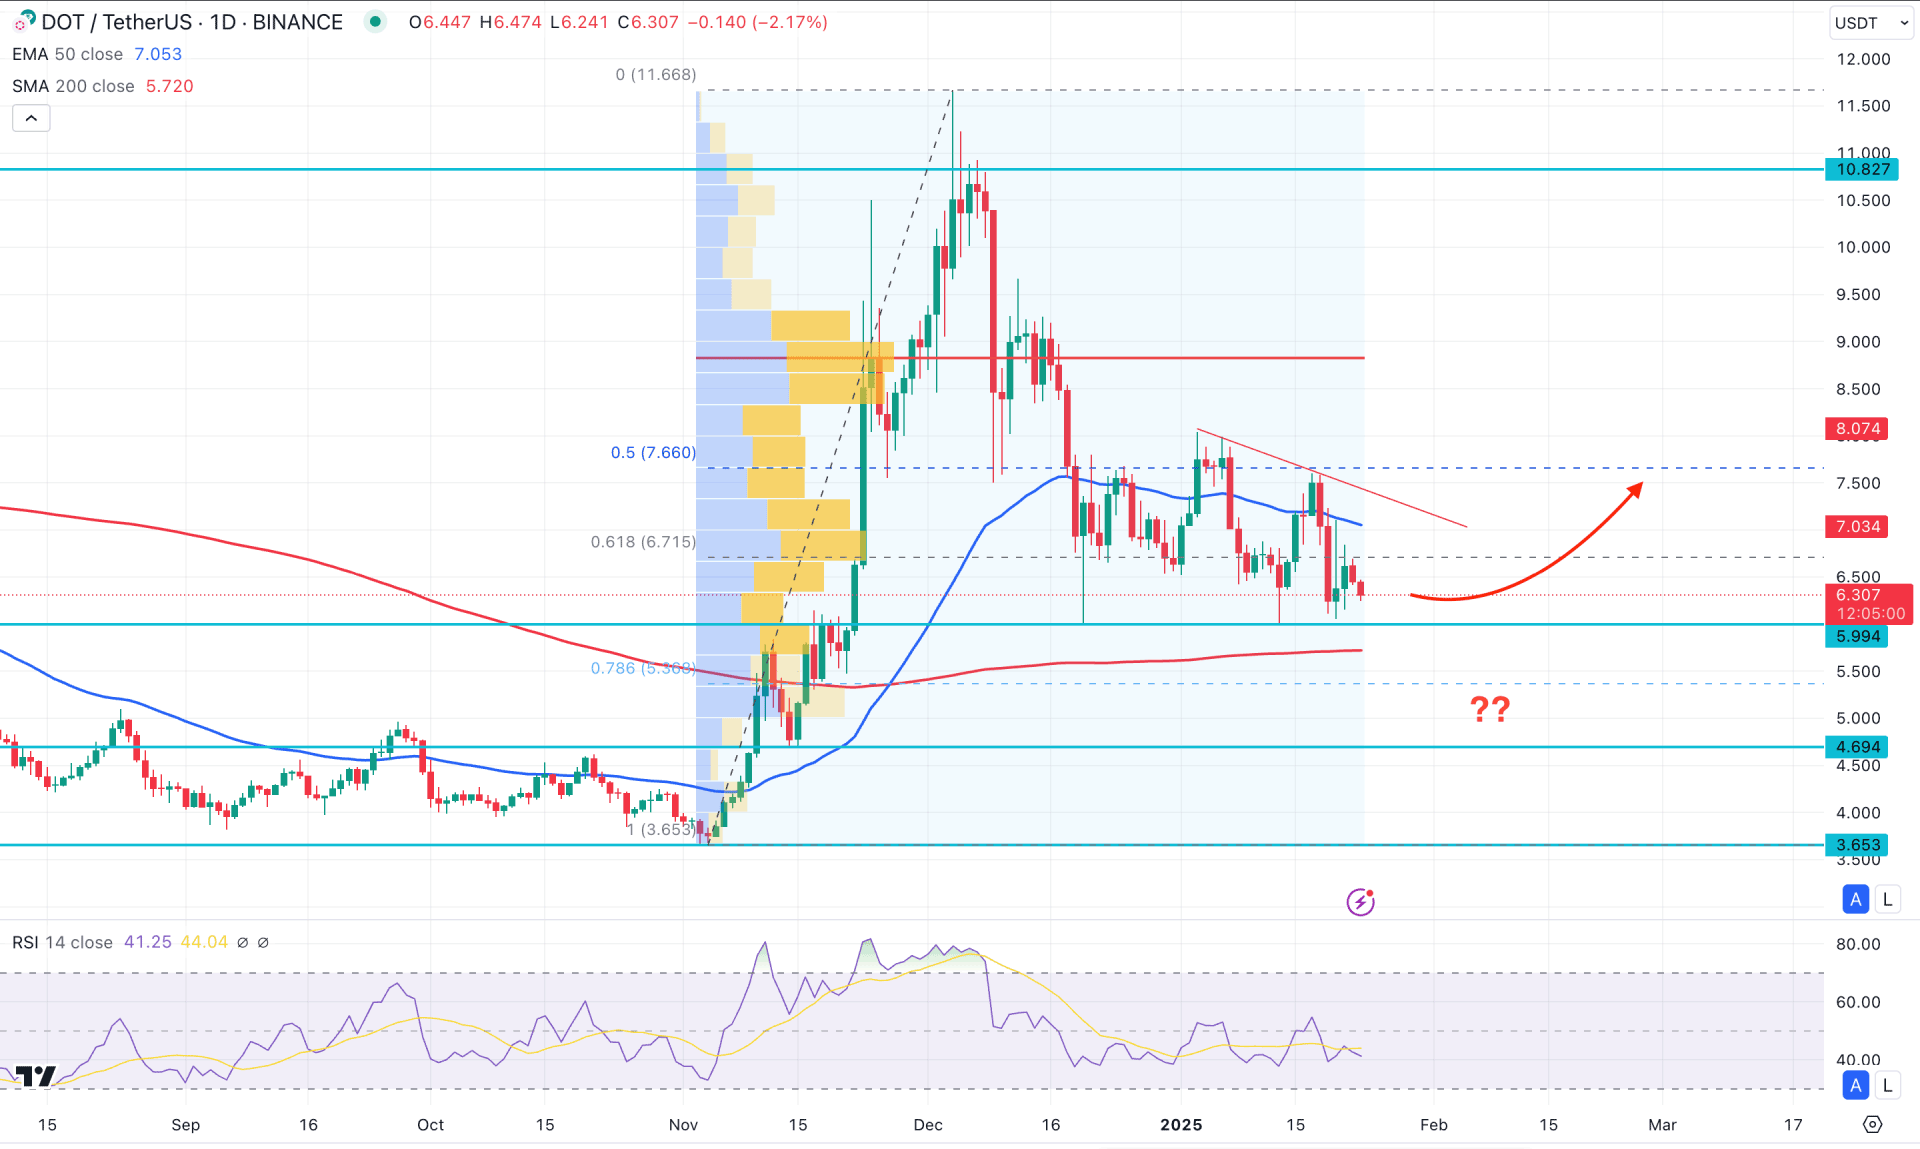
In the daily chart of DOT/USDT, the major market structure is bullish, where the current price is trading sideways after setting a top. Primarily, 50% Fibonacci Retracement level from the 11.66 top to 3.65 bottom is at the 7.66 level. As the bottom is still valid and the price is trading below the 7.66 level, we may consider it as a discounted zone. The sideways market within the discounted zone might work as a crucial bullish factor for this coin, depending on the upcoming price action.
In the broader structure, the November 2024 close came with a blessing for balls as the price made a potential range breakout to the multi year high. Later on a beer correction is seen, but the price ended trading as an inside bar before the yearly open. As long as the November peak is present, bowls have a higher possibility of taking the price higher in the coming bonds.
In the main price chart, the 200-day simple moving average has remained flat for almost a month, signaling extreme sideways pressure. Meanwhile, the 50-day exponential moving average is above the current price with multiple violations. As no clear reaction is present from the dynamic line, investors might wait for a potential breakout before anticipating a stable trend.
In the indicator window, the 14-day relative strength index shows the same outlook as the current line Hoover below the 50.00 neutral level. As the bottom is not reached, sideways pressure may extend to the downside.
Based on the daily outlook, the price is more likely to extend the selling pressure below the 5.94 double-bottom support. However, enough liquidity grab from the 5.90 to 5.00 zone with an immediate reversal above the 50-day EMA could be a highly probable long opportunity. On the bullish side, the immediate resistance level is at the 9.00 level. Overcoming this line could test the 11.00 level in the coming days.
On the bearish side, the 200-day Simple Moving Average is the immediate support, and an excessive selling pressure below this level with a consolidation could signal more blood to bulls.
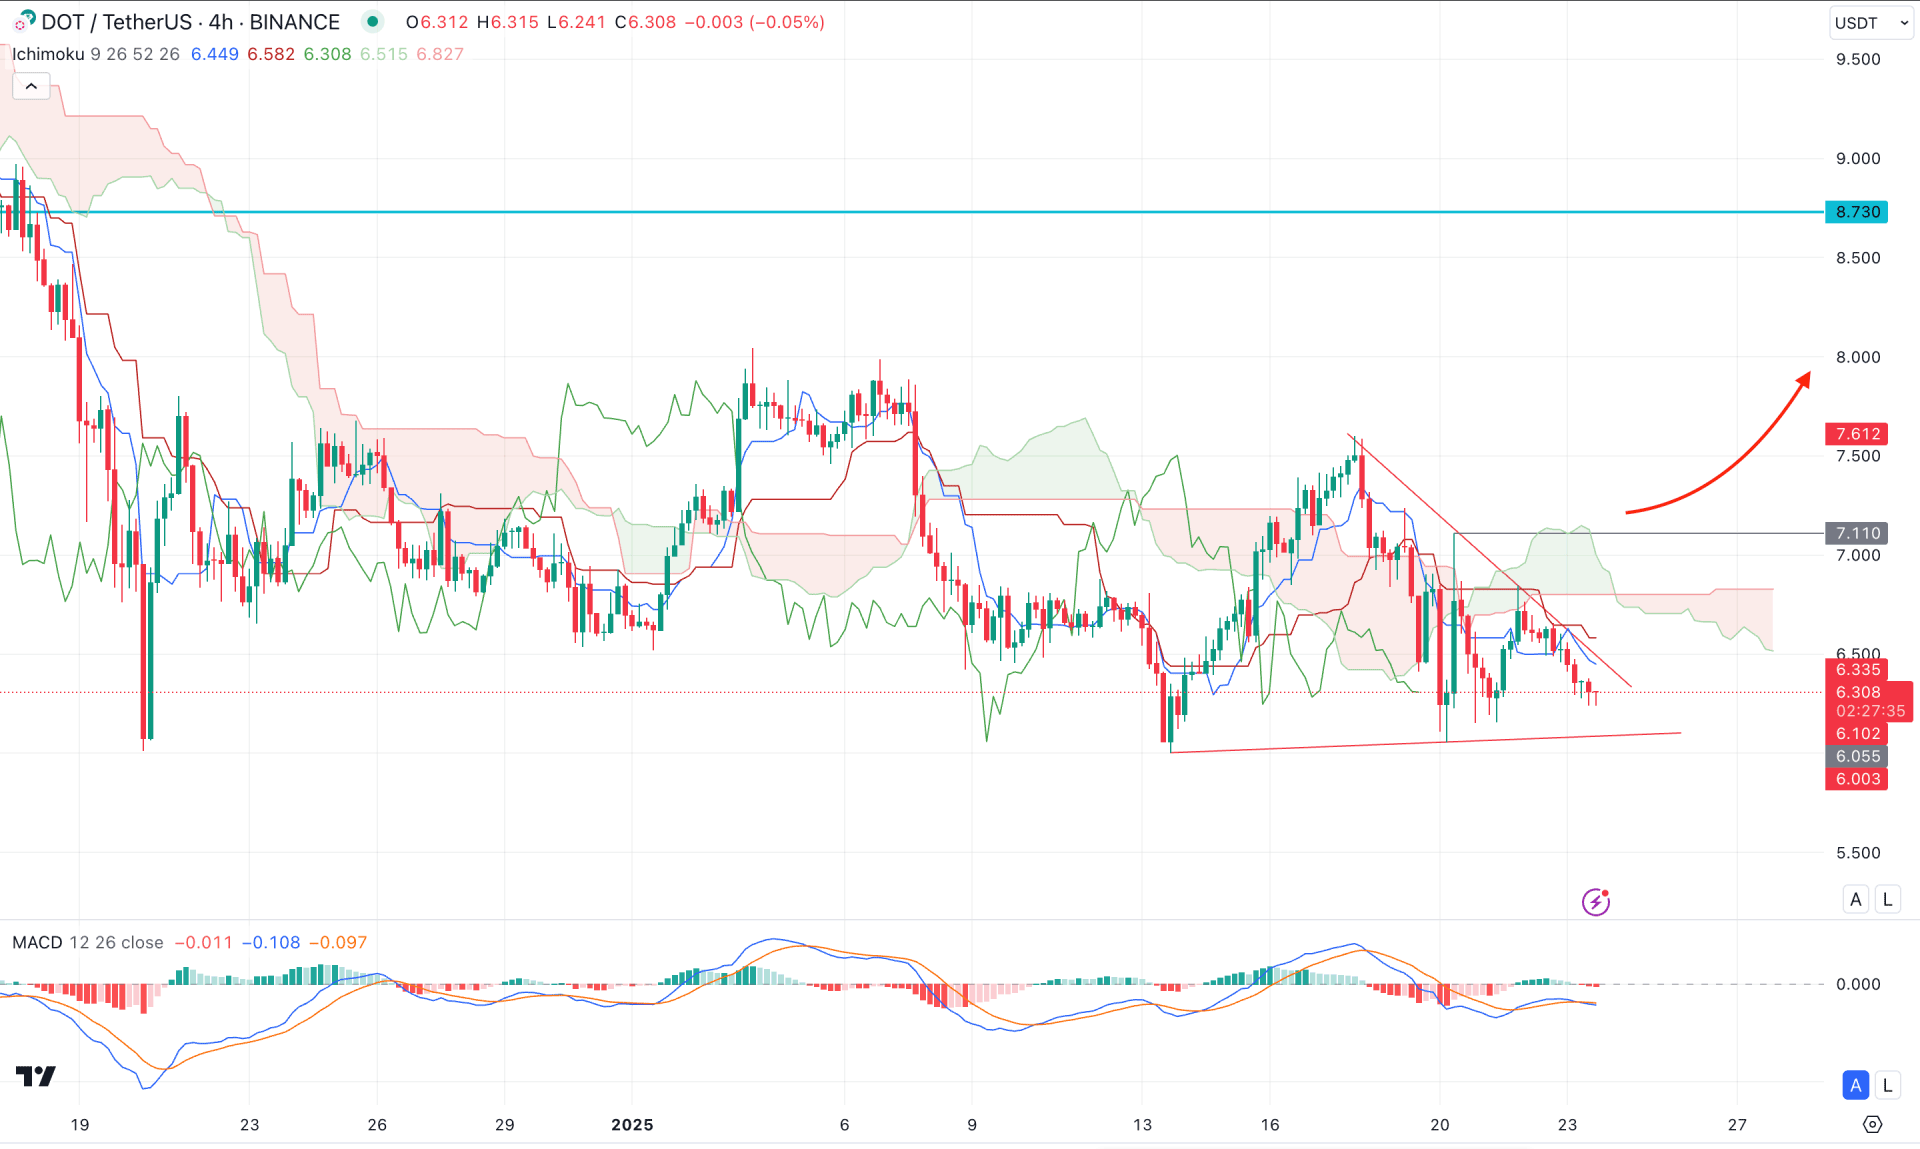
In the H4 timeframe, the recent price shows extreme sideways pressure, whereas the most recent price trades below the Ichimoku Cloud zone. Primarily, as long as the Cloud zone is working as a resistance, investors might seek short trades.
In the indicator window, the MACD Histogram shows corrective pressure as the current line has remained closer to the neutral point for more than a week.
Based on the H4 structure, the current trendline resistance is a crucial price area to look at. A bullish continuation with an H4 close above the 7.110 level could be a potential long opportunity aiming for the 8.79 level.
On the other hand, the dynamic Kijun Sen is already working as a resistance, which might lower the price towards the 5.50 psychological level.
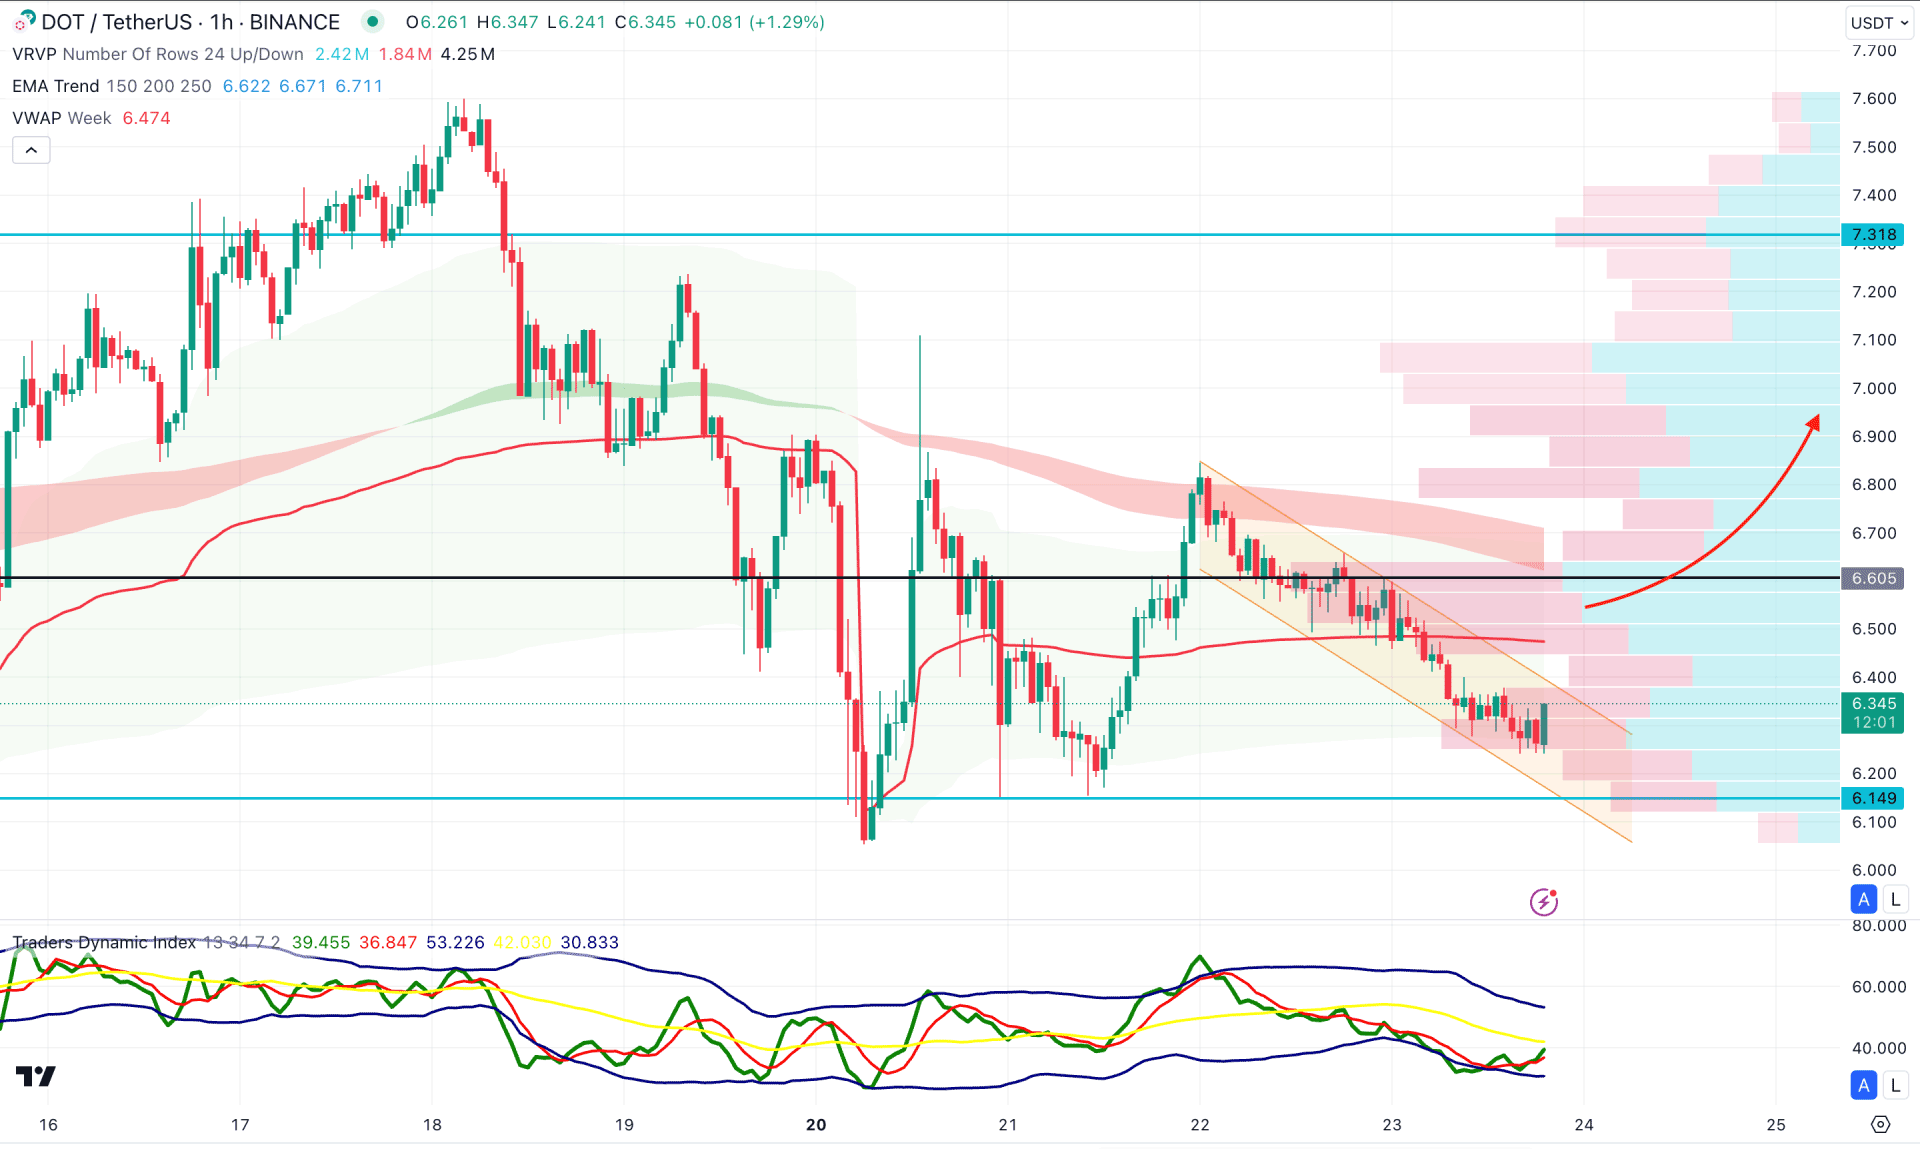
In the hourly time frame, the current price is trading within a descending channel, while the Moving Average wave is working as a resistance level. Moreover, the weekly VWAP is working as a resistance, suggesting a confluence of selling pressure.
In the secondary indicator window, the Traders Dynamic Index (TDI) has formed a bottom before moving above the 50.00 level.
Based on this outlook, the selling pressure is valid as long as the dynamic Weekly VWAP is above the current price. On the bearish side, the immediate support is at the 6.14 level, which could be a potential barrier before reaching the 5.50 level.
On the bullish side, overcoming the 6.60 level with bullish pressure could signal a potential channel breakout. As a result, a corrective pressure after the breakout might extend the gain towards the 7.31 level.
Based on the current market outlook, DOT/USDT is more likely to extend the buying pressure from the daily structure. However, a proper price action has yet to be formed from the discounted zone, where a bullish push is pending from the trend line resistance.


