
Published: May 13th, 2025
Polygon's layer-2 scaling solution is powered by POL, a native coin that has recovered 64% from its lowest point ever. The asset, which was originally known as MATIC, fell to a record low of $0.15 on April 7.
Since then, Polygon's price has increased to 0.25, surpassing a significant resistance level. Notwithstanding the rally, several indicators point to potential difficulties for the upswing, and a sustained breakout is not assured.
The Global In/Out of Money (GIOM) indicates that the Polygon ecosystem currency may see a further obstacle between $0.19 and $0.46 from an on-chain standpoint.
GIOM divides up all token holders based on the average rate at which they purchased their tokens. The metric can identify resistance, where a larger volume represents unrealized expenses and support.
8.54 billion POL coins in unrecognized losses, accumulated between $0.19 and $0.46, are held by more than 58,000 Polygon addresses, according to IntoTheBlock statistics. More sell-offs may result from this cluster as holders try to break even.
Such selling stress might prevent a long-term gain and make it challenging for POL's price to increase significantly shortly term.
Let's see the complete outlook from the POL/USDT technical analysis:
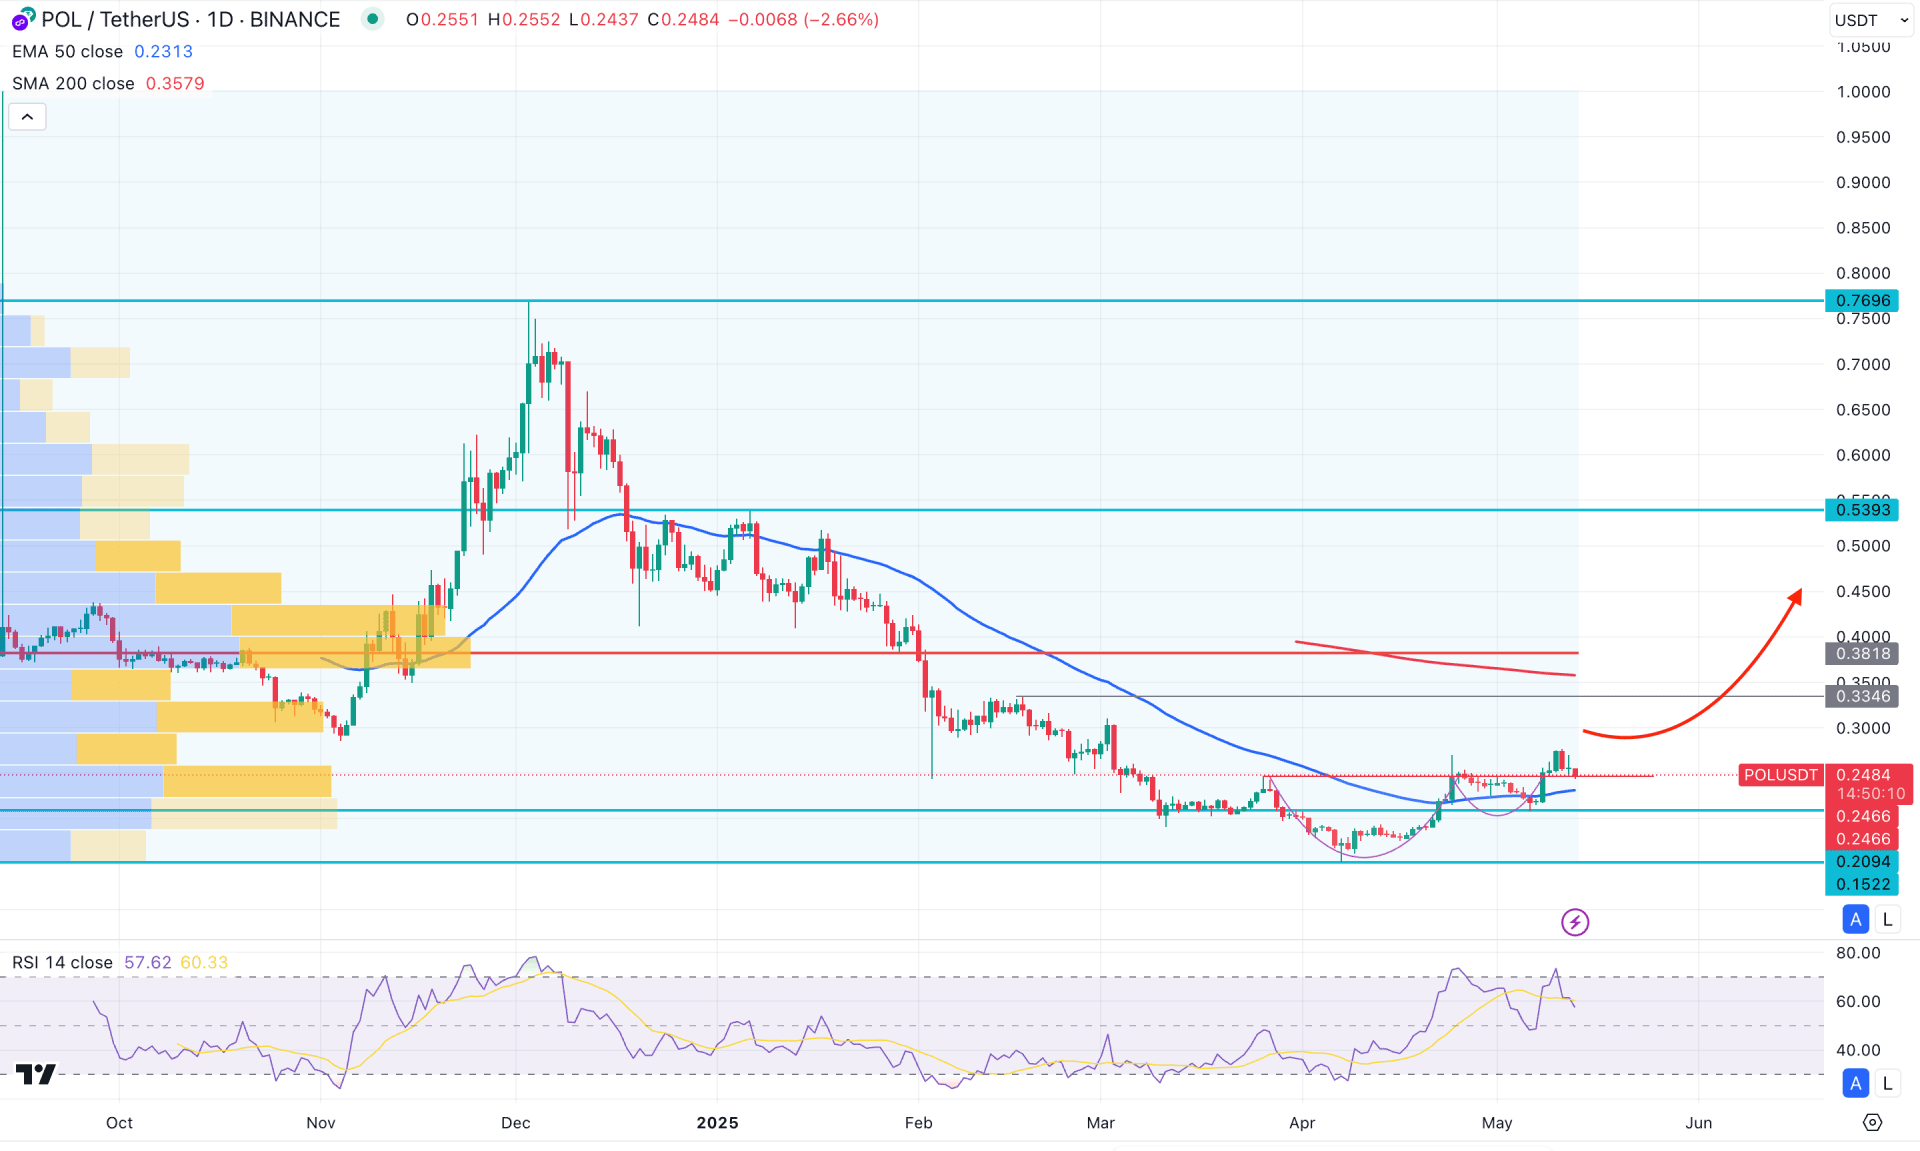
On the daily chart of POL/USDT, extended selling pressure is evident, as the current price is trading near the support level of 0.2094. However, a solid bottom formation followed by a bullish recovery from a cup and handle breakout could signal a valid trend reversal.
In the higher time frames, a potential bullish recovery is still visible. A break above the monthly high of 0.3128 could be considered a conservative long entry. Meanwhile, the weekly chart shows bullish momentum, as multiple weekly bullish candles have formed, following a brief period of minor bearish inside bars.
One of the most active levels since inception was found at 0.3818, which is still around 33% above the current price. Even though the price is making consistent higher highs, more confirmations are needed before opening a long position, especially from the high-volume supply zone.
The main price chart shows a potential bullish reversal from the 50-day Exponential Moving Average, which aligns with a new swing high formation at the 0.2763 level. However, the 200-day Moving Average remains far above the current price, leaving a wide gap. A breakdown below the 50-day EMA could invalidate the bullish possibility at any time.
The Relative Strength Index (RSI) has reached a resistance level around 70.00 for the first time since December 2024. This suggests that the price has entered the overbought zone, and a decent downside correction could be due.
Based on this outlook, the primary objective is to follow the broader market trend. If a bearish daily candle forms below the 50-day EMA, it could open a short opportunity targeting the 0.1522 support level.
On the other hand, if the price consolidates and breaks out bullishly from the 0.2100 to 0.2750 zone, it could increase the likelihood of testing the 200-day Simple Moving Average. However, a stable price above 0.3346 is required for a valid bullish trend reversal before aiming for the 0.5393 and 0.7500 levels.
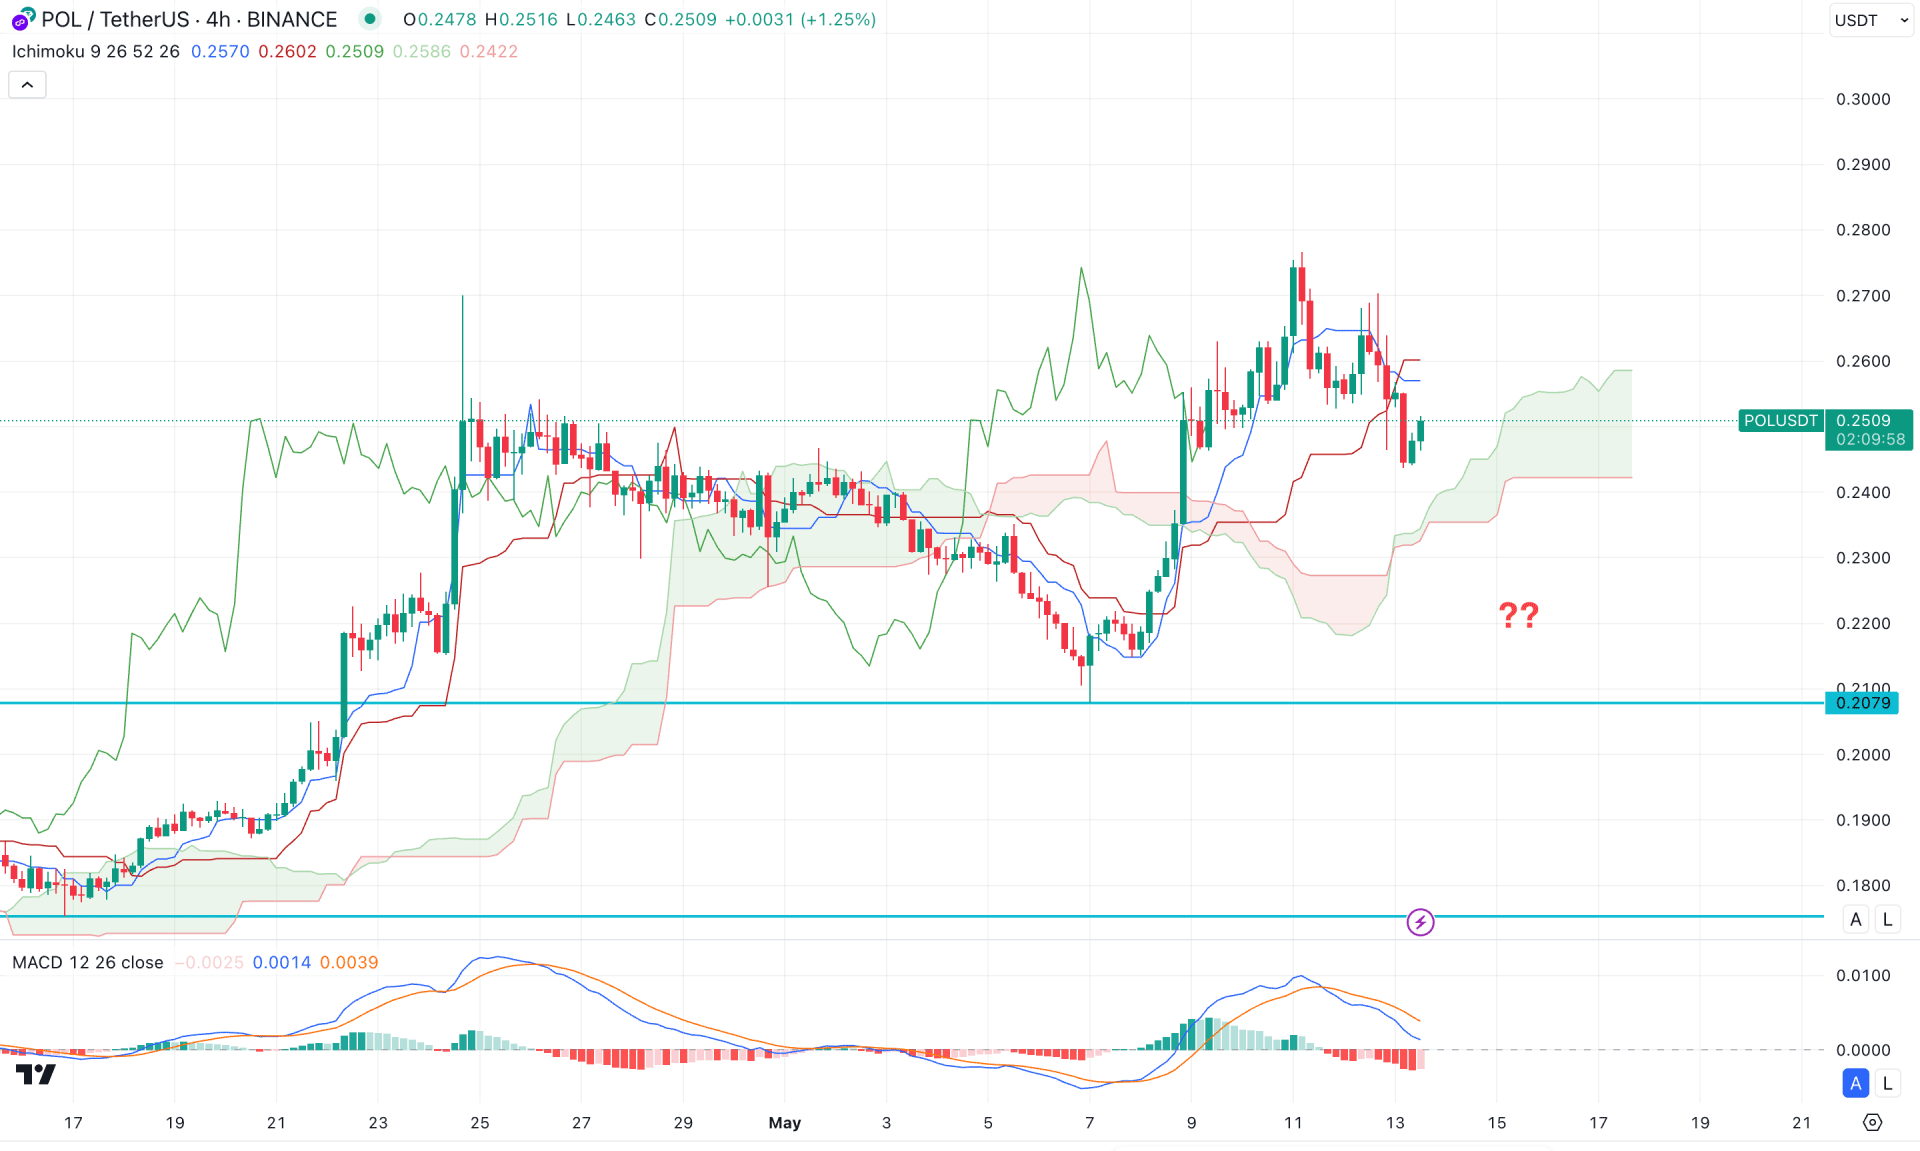
On the H4 timeframe, a bullish rally-base-rally formation is visible, with sellers wiped out from the Kumo Cloud area before the price formed a new swing high.
This primarily indicates a continuation pattern, supported by the rising future cloud line. However, the indicator window tells another story. A clear bearish divergence is visible at the MACD signal line. Moreover, the histogram remains bearish, creating new lows with no sign of recovery.
Based on this market outlook, the momentum has slowed after forming the most recent swing high, signaling a possible corrective phase. The bullish signal needs more time to validate as the price is trading below the Kijun-sen level. However, a rebound from the 0.2400 to 0.2320 zone with an H4 candle closing above the Tenkan-sen support could indicate a bullish trend continuation.
On the other hand, a deeper discount is also possible from the cloud support. Investors should monitor how the price reacts after potentially invalidating the cloud area. A strong bearish breakout with consolidation below the cloud low would signal increased selling pressure in the days ahead.
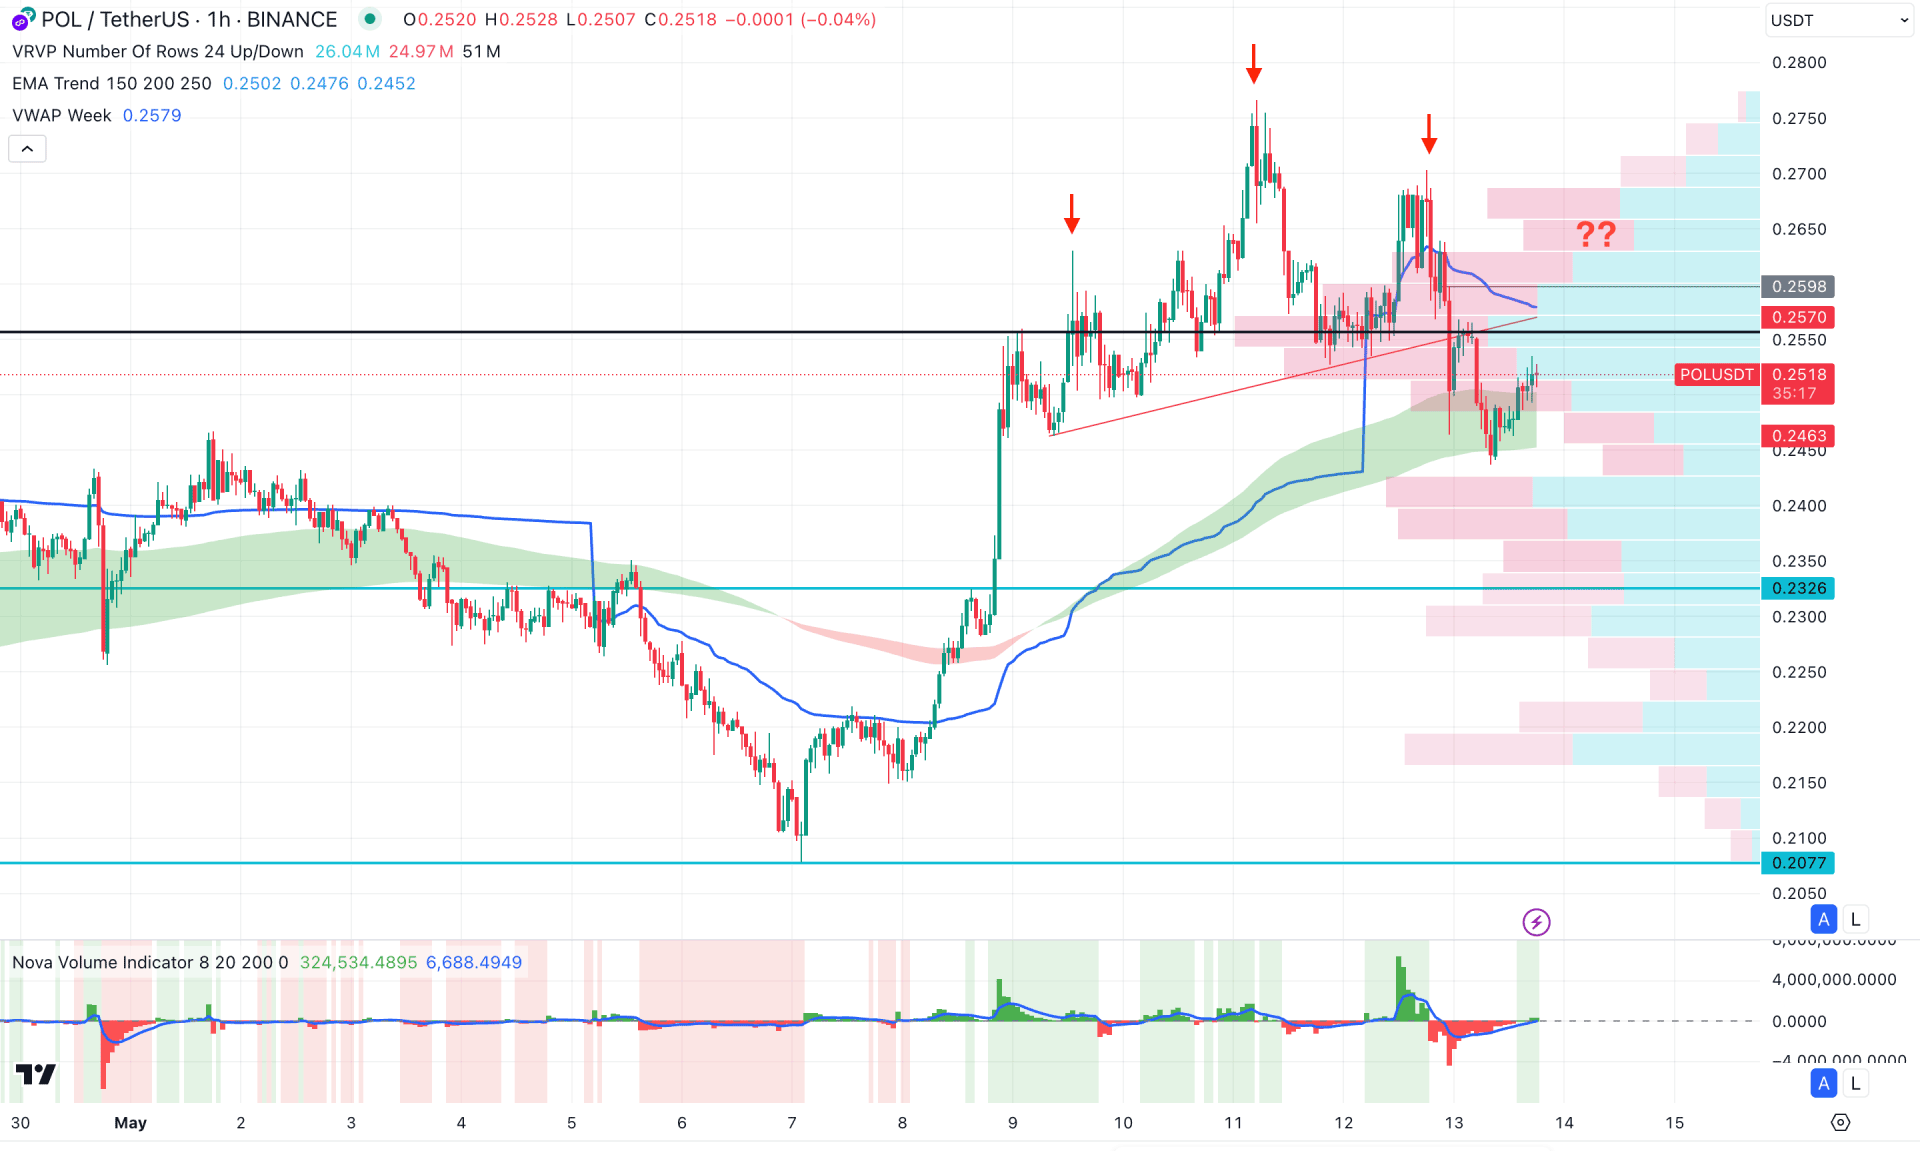
On the hourly time frame, the current price moves sideways after peaking at the 0.2766 level. Moreover, a potential bearish breakout is forming, supported by the head and shoulders pattern validation. As long as the price remains below the neckline of this pattern, the upcoming price action could be bearish.
On the other hand, the price is currently finding support from the moving average wave, while the volume indicator suggests positive order building. A new swing low or a bearish rejection from the weekly VWAP line could push the price down to test the 0.2077 level.
However, any immediate recovery that stabilizes the market above the 0.2598 level could open a long opportunity at any time.
Based on this outlook, POL/USDT is still trading under selling pressure, from which more confirmations are needed before opening a long position. However, the gap between the current price and high volume line signals a decent upward correction, which could validate the weekly wedge breakout.


