
Published: August 31st, 2022
Chinese e-commerce company Pinduoduo showed a massive gain in the quarterly earnings report this week, fueled by China’s mid-year shopping festival.
In the 2nd quarter earning report, PDD revenue came at $4.69 billion, up by 31.38% from the previous quarter of $3.57 billion. Moreover, the earnings per share came at $1.13, up by 154.67% from the previous quarter. Besides, the revenue was steady from the last 4 years with a 215% increase in net income for 2021.
Pinduoduo showed a bump in pent-up demand during the prolonged lockdown in China. This company is popular among less affluent consumers, which helped it to ignore the economic slowdown and higher inflation.
PDD shares are up by 66% from the pandemic high and 20% from the yearly opening. Now, the price is facing critical resistance at the 71.61 level, which needs to be monitored.
Let’s see the future price action of Pinduoduo from the Pinduoduo Stock (NASDAQ: PDD) Technical analysis:
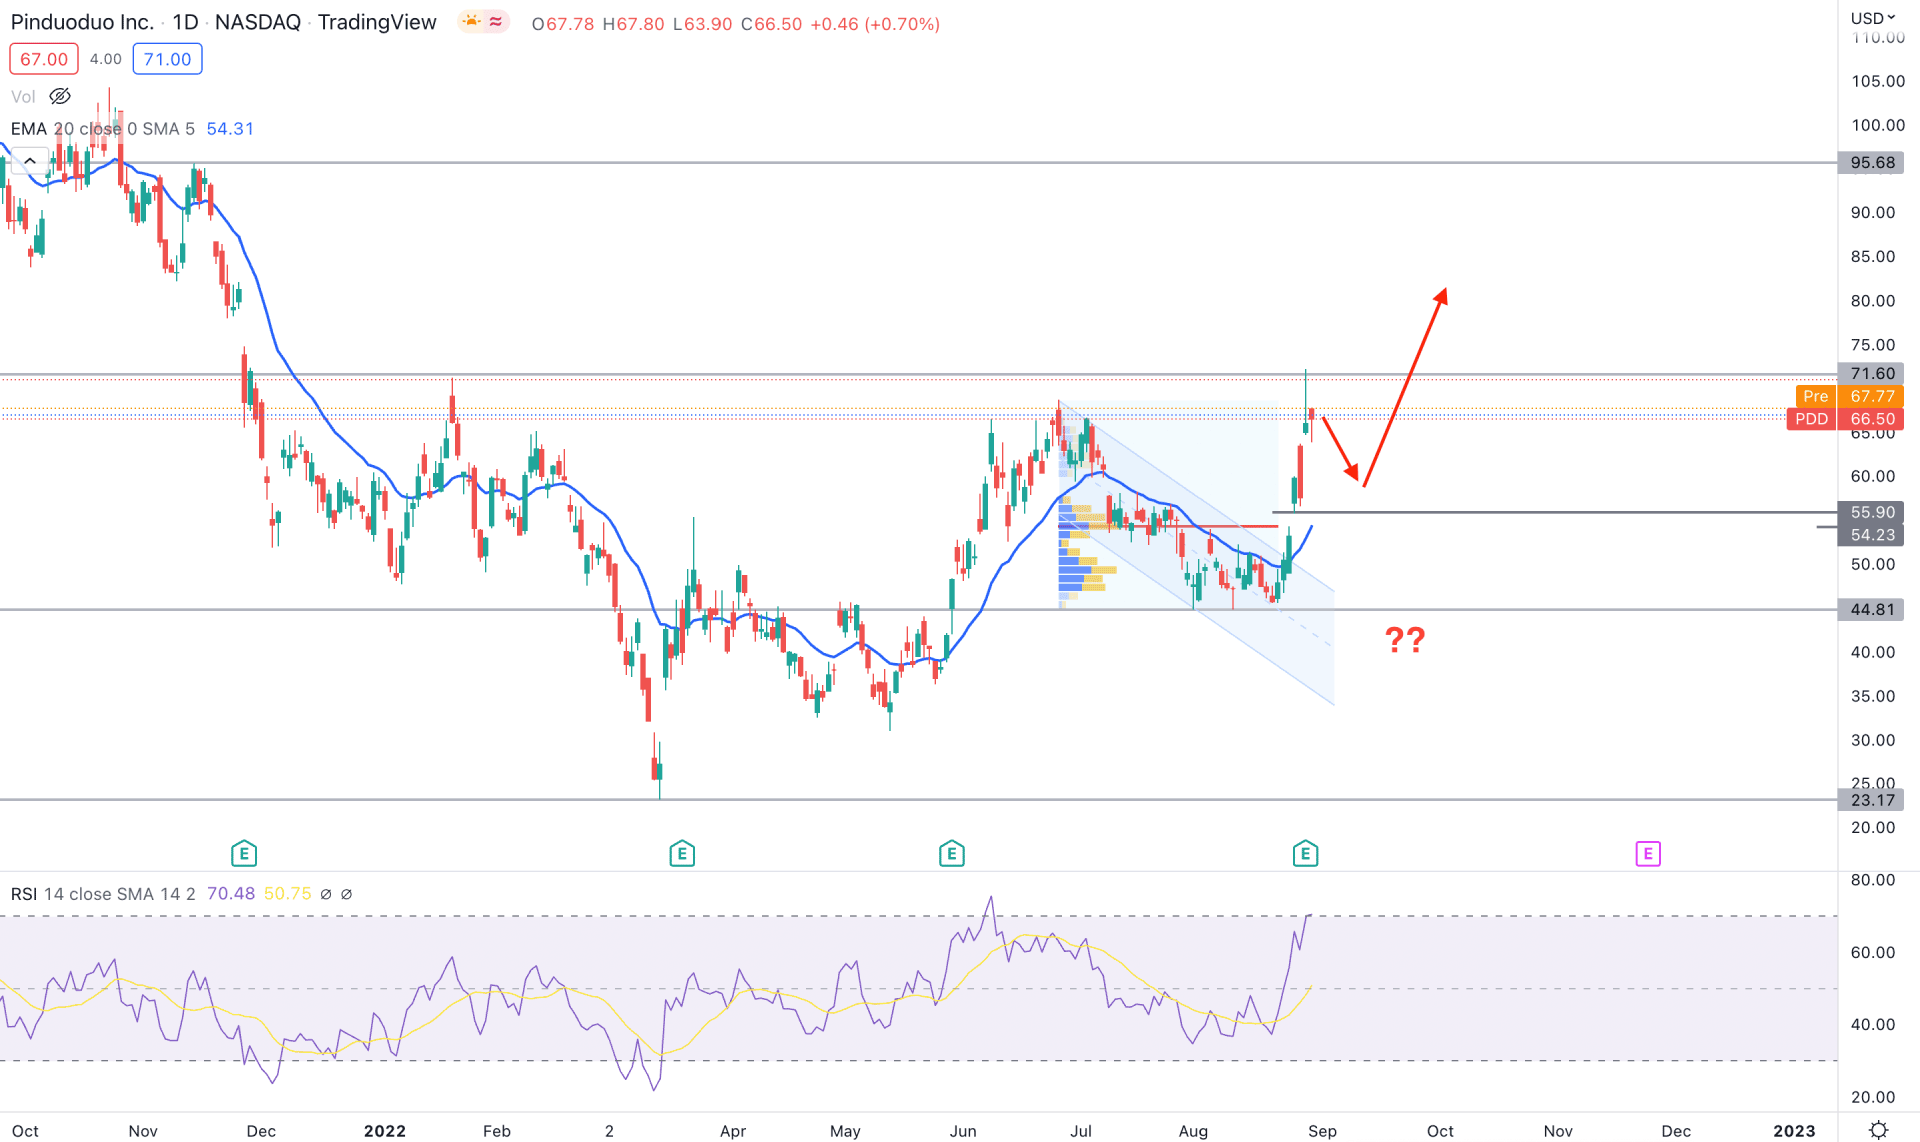
In the PDD daily chart, the recent buying pressure from 44.81 came with an impulsive movement that made a sharp 48.21% gain on the Tuesday close. Moreover, the buying momentum is supported by the quarterly earnings report and a descending channel breakout, indicating a strong buyer's presence in the price.
Based on the specific range volume indicator, the highest trading volume from June 2022 high to August 2022 low is 54.23 level. As a result, we can say that the most recent bearish rejection candle at the 71.61 resistance level did not overcome the trading volume seen at the 54.23 level. In that case, the bullish momentum may extend as long as the price trades above the 54.00 key psychological number.
In the relative strength indicator, the current reading is at a 70% overbought level with no sign of a recovery. The dynamic 20-day Exponential Moving Average is the 55.00 key support level where the current gap between the price and 20 DMA indicates a bearish correction.
Based on the PDD daily price prediction, the primary aim is to find the price at the 60.00 to 50.00 area with a strong bullish rejection before aiming toward the 95.68 level. On the other hand, any bearish pressure below the 44.81 level would eliminate all buying possibilities to test the 23.17 support level, in the coming days.
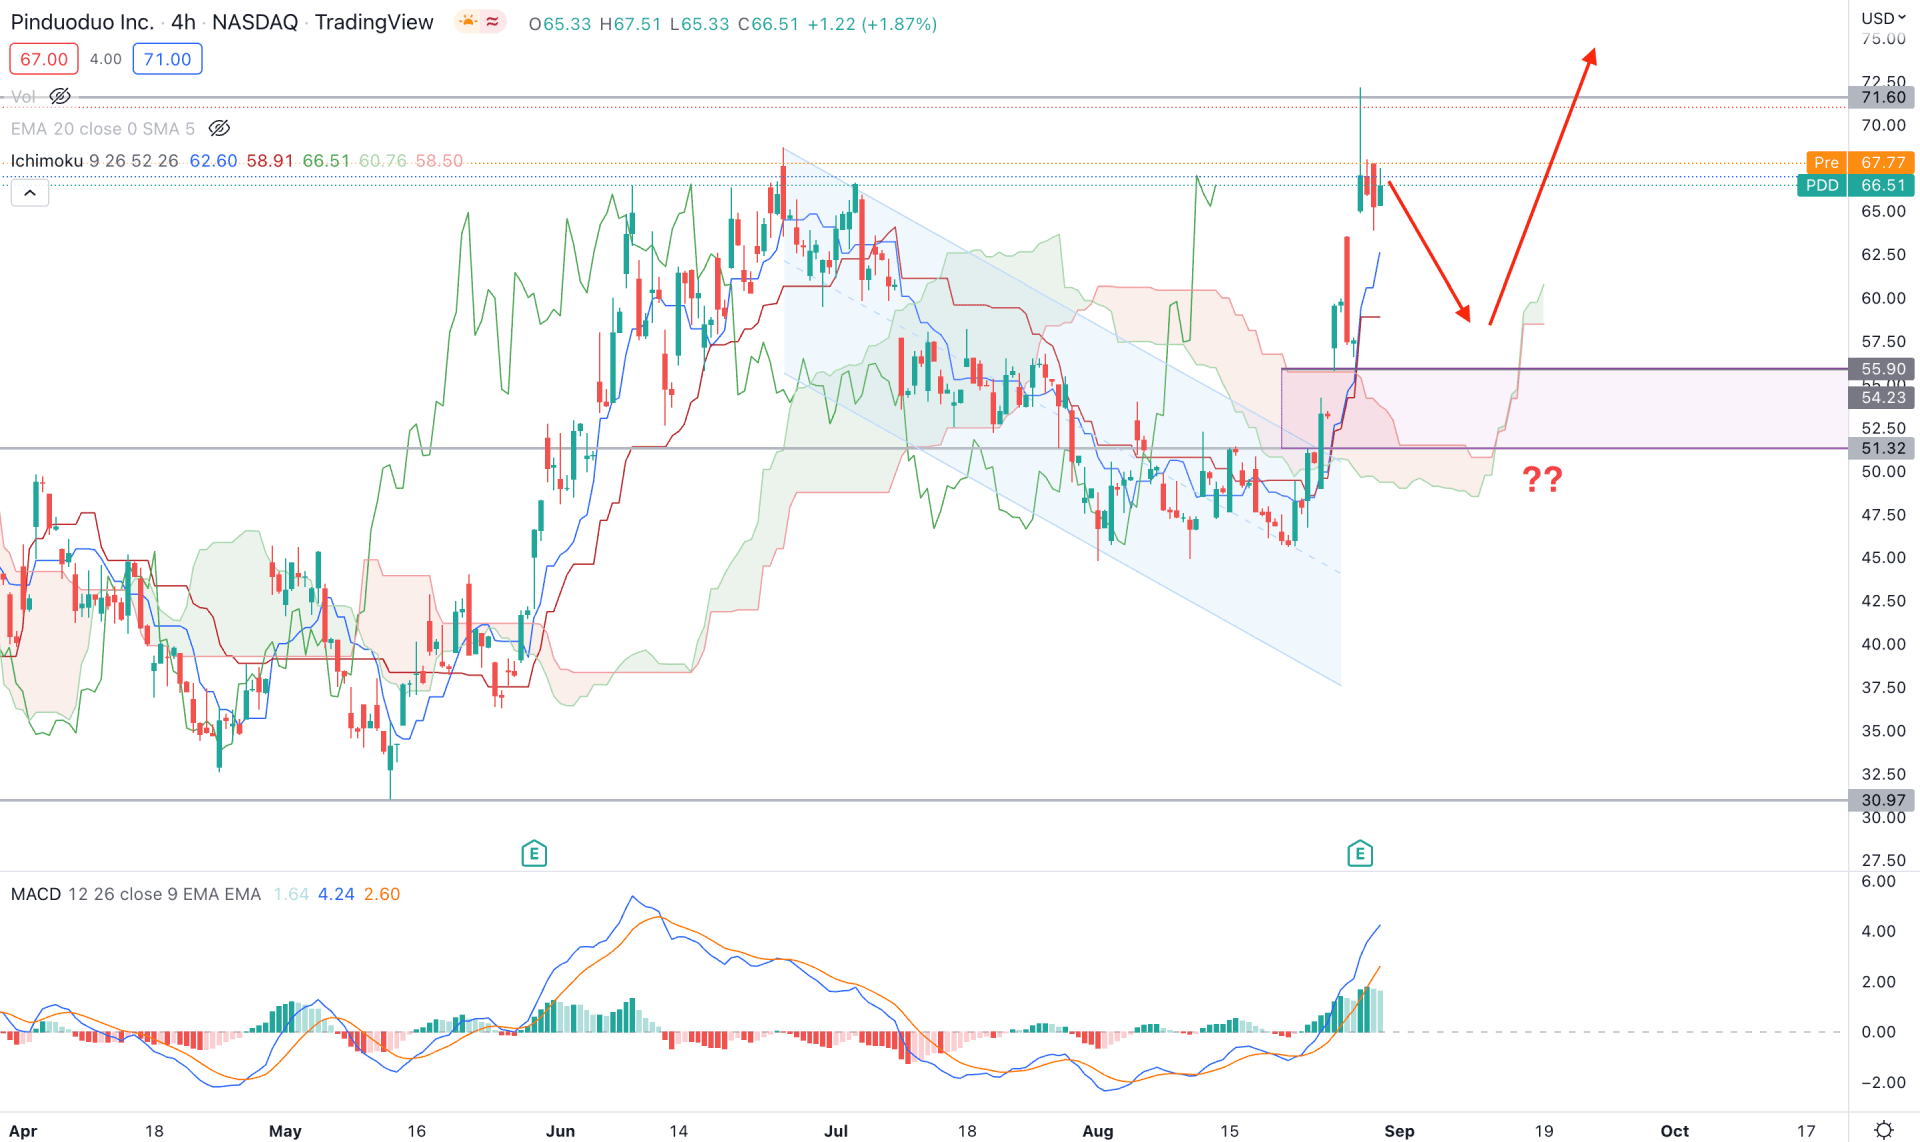
In the Pinduoduo H4 chart, the broader market context showed buying pressure from the Ichimoku Cloud breakout. Before the earnings report was released, China’s shopping festival influenced bulls to join the market with a massive channel breakout and stable price above the Kumo Cloud.
In the future cloud, the Senkou Span A is above the Senkou Span B, indicating buyers' presence in the market, while the Lagging Span is also supportive of bulls. However, the massive buying pressure above the Cloud support increased the gap between the price and dynamic support levels, leading to a possibility of a bearish correction.
In the indicator window, the MACD Histogram is strongly bullish while the MACD EMA is at an overbought position. In the price chart, the dynamic Tenkan Sen and Kijun Sen are below the price and working as immediate support levels.
Based on the H4 price prediction, investors should monitor how the price comes lower and trades at the 56.00 to 51.00 zone, from where a bullish rejection would open a long opportunity.
The alternative approach is to find the price below the 50.00 level, to test the 30.97 support level in the coming hours.
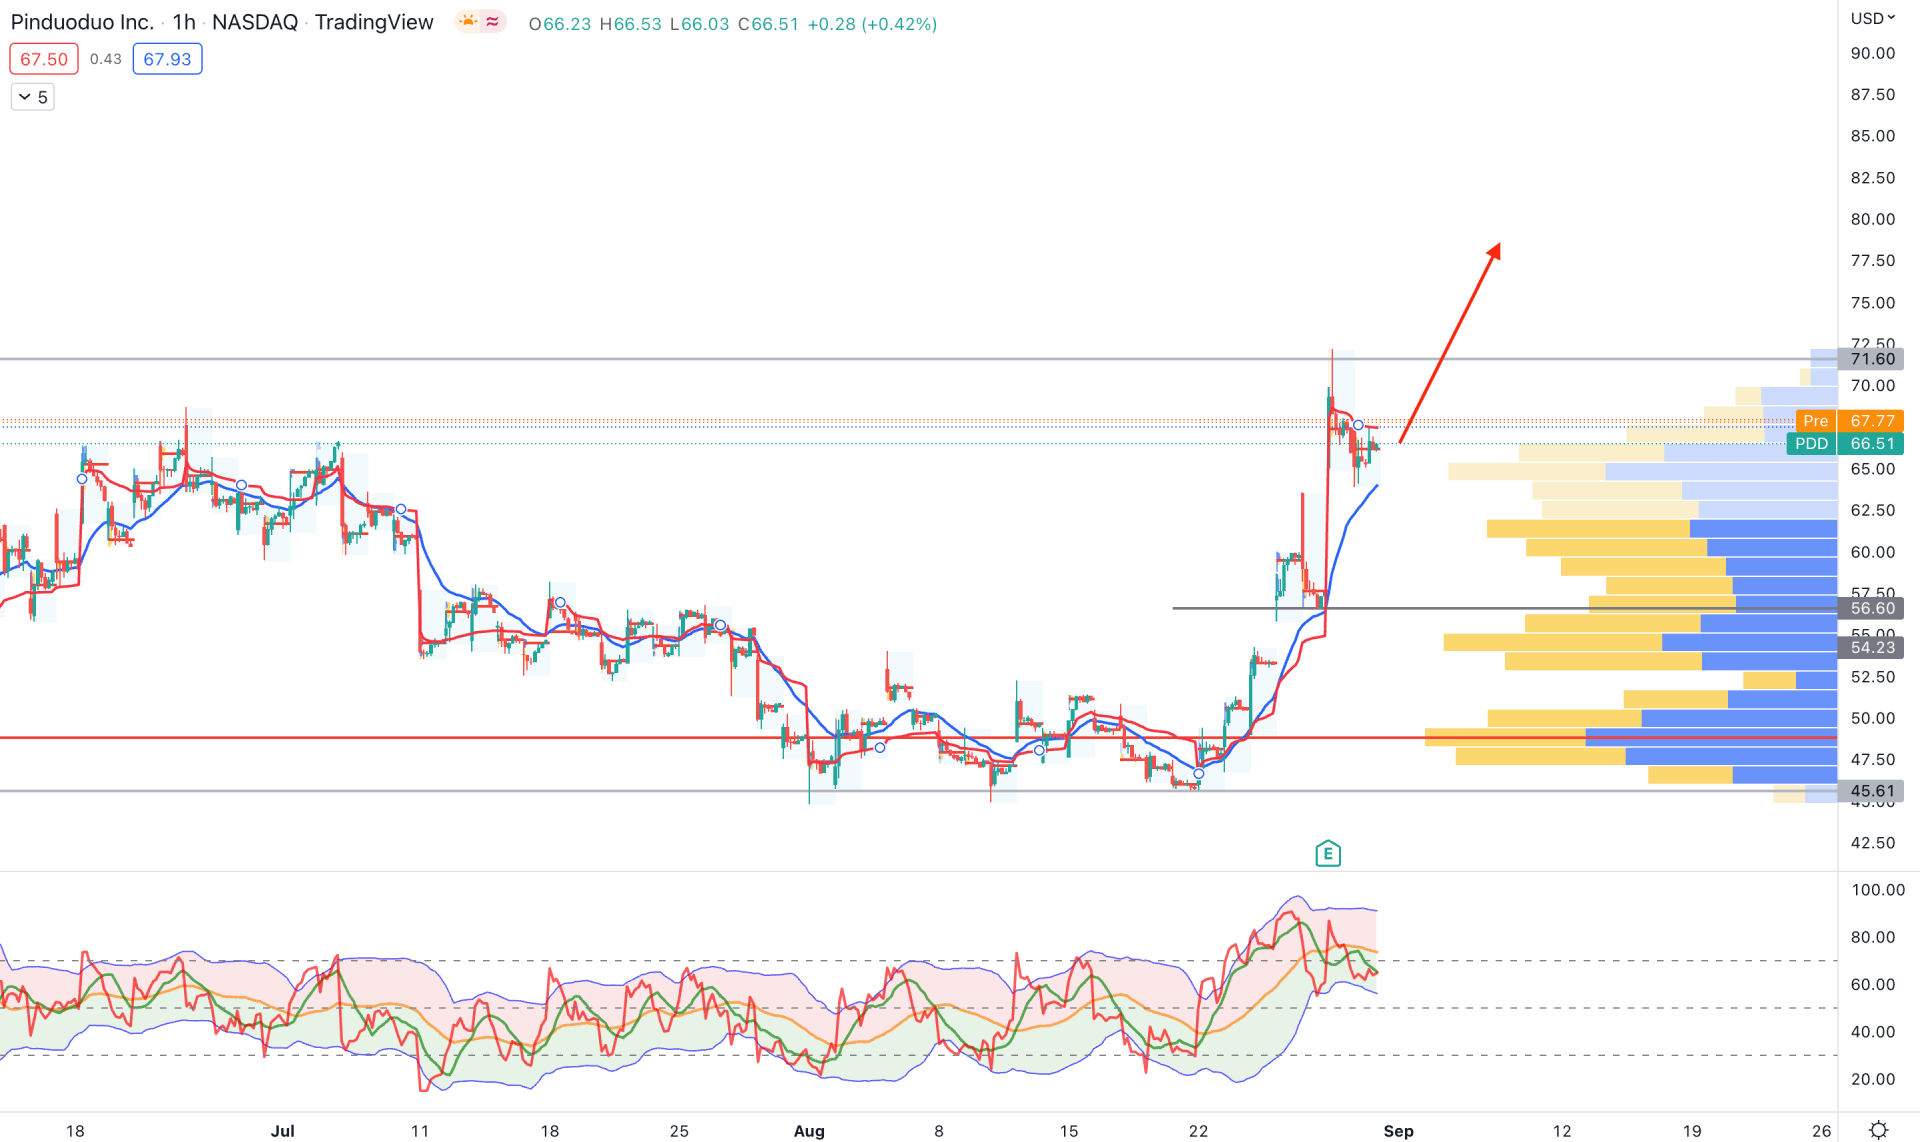
In the PDD H1 chart, the current price trades within a strong bullish leg starting from the 45.61 swing low. Moreover, the buying pressure from the 45.61 low came with a massive volume change at the 48.83 level, indicating institutions' presence in that area.
Based on the dynamic levels, the current 20 EMA resistance level is below the price and might work as an immediate support level. Moreover, the weekly VWAP is above the price and working as immediate resistance.
The intraday high volume level made consecutive higher highs before stalling at 66.23. The trader's dynamic index is also at the overbought zone, with a possibility of a bearish correction.
Based on the H1 chart, any minor bearish correction would be a bullish opportunity for this instrument, where any buying pressure from the dynamic 20 EMA or static 56.60 level would be a buying point. On the other hand, the break below the 45.61 level would alter the current market structure and lower the price towards the 30.00 level.
Based on the current multi-timeframe analysis, PDD has a higher possibility of extending the buying pressure, depending on how the Fed reacts to the upcoming rate decision. Any sign of the relief on the stock market would be a bullish factor for PDD, increasing the possibility of reaching the 95.58 key resistance level.


