
Published: December 6th, 2022
Pinduoduo has 23% ROCE after its latest quarterly earnings report release, which is a great return. Additionally, it outruns average earnings of 14% by similar industry companies.
We’re pleased that Pinduoduo is now generating pre-tax profits and collecting rewards from investments. The company was generating losses about five years ago and is now collecting 23% of profits from capital as things have turned.
Additionally, Pinduoduo is employing more than 12,350% more capital than formerly expected from a company that seeks to enter profitability. It reveals that the company can generate higher returns and has many reinvestment opportunities.
On related notes, the current liabilities ratio of the company’s total assets declined by 41%, which usually diminishes its funding from short-term suppliers or creditors. It informs that the return growth of Pinduoduo comes without reliance on the current liabilities surge, which causes pleasure for us. However, current liabilities remain higher, which could create a short-term liquidity problem for the instrument.
Should you buy Pinduoduo stock? Let’s see the future price direction from the Pinduoduo stock (PDD) technical analysis:
If you followed the previous PDD technical analysis, you are already at 54% gain from the breakout point.
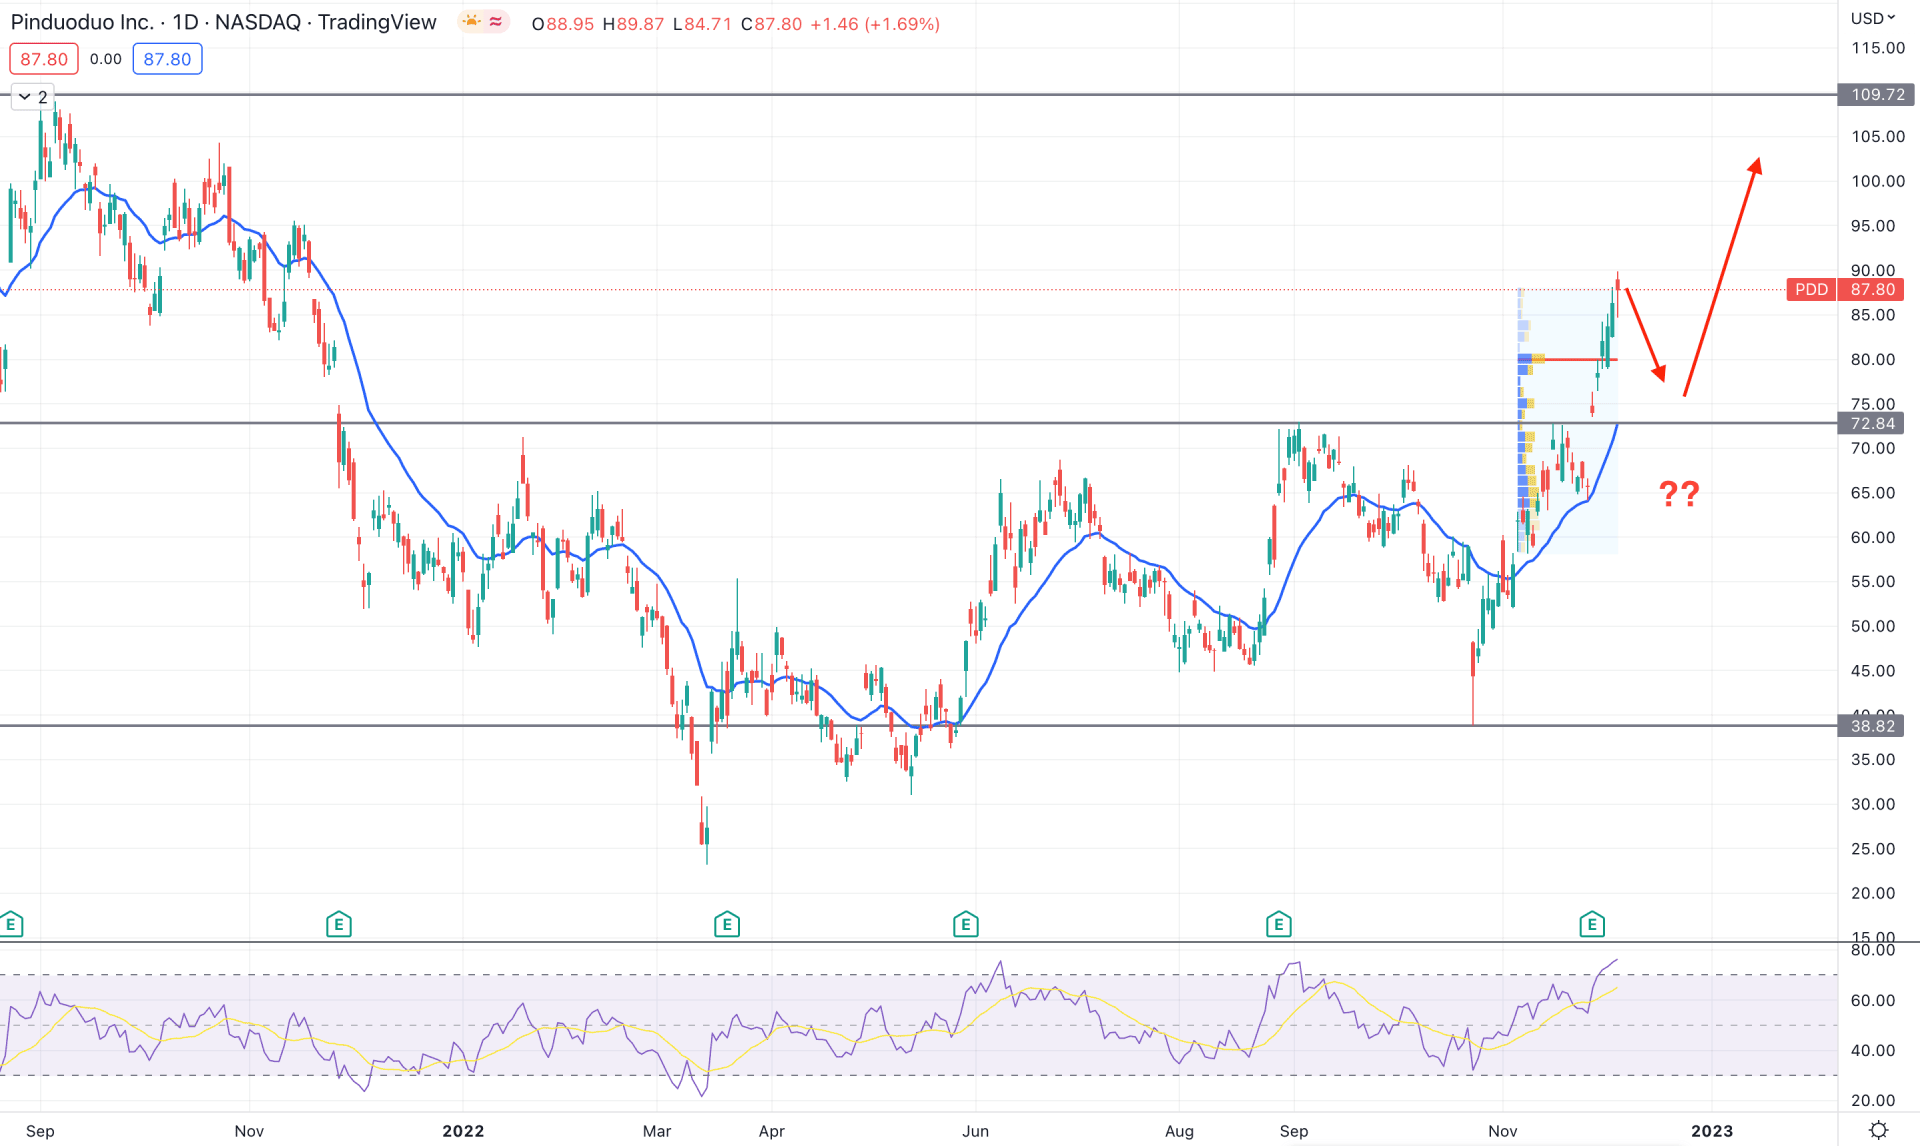
The present price behavior is not changed and the buying possibility is still potent in this instrument. If we look at the price from left to right the current trading range started from 109.72 high to 38.82 low, as these appeared with a QML formation. As the current price is trading at the premium level of this range, the primary outlook of the stock is to find bearish opportunities.
In the latest price action, the selling pressure and formation of the new swing level at 38.82 level is a sign of a bearish liquidity grab before forming a bullish break of structure. Moreover, the latest high volume level from October low to November high is at 79.97 level, which is below the current price.
In the main chart, the dynamic 20-day EMA is below the current price and working as a support level. Moreover, the Relative Strength Index (RSI) is above the 70% overbought level, which is a sign of strong buying pressure.
Based on the current daily outlook of PDD, there is no sign of selling pressure and the current price could extend the buying momentum towards the 109.72 resistance level.
The alternative trading approach is to wait for the price to come below the 72.80 support level and form a bearish daily candle. In that case, the selling momentum could extend towards the 38.80 area.
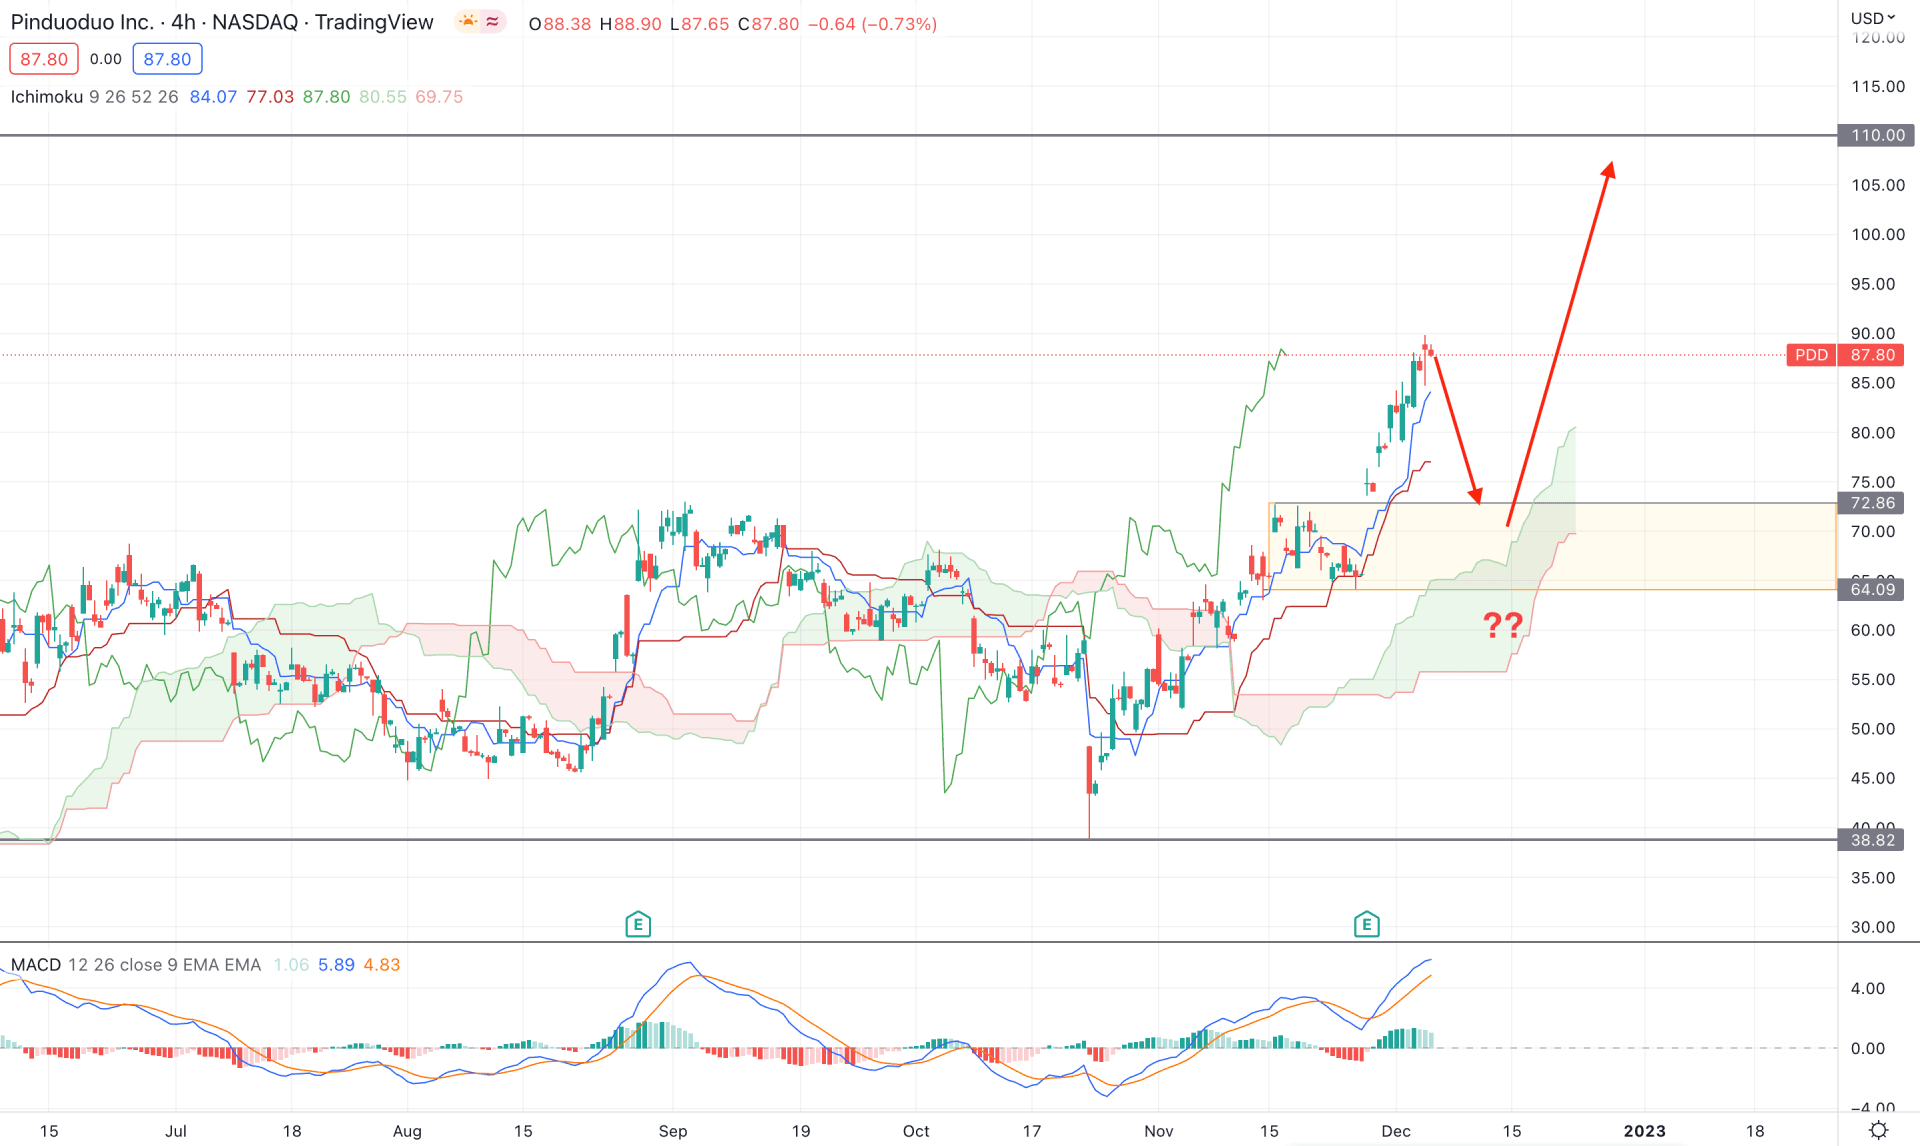
In the PDD H4 chart, the broader market outlook is bullish as it is trading above the Ichimoku Kumo Cloud area. Moreover, the speed of the bullish breakout from the cloud zone is solid, which increases the possibility of a trend continuation opportunity.
In the indicator window, the MACD Histogram is bullish while MACD EMA reached the overbought zone. In that case, a bearish possibility is potent for this instrument as there is a pending mean reversion from the dynamic Kijun Sen support.
Based on the current outlook, a bullish trend continuation opportunity is pending, where a bullish reversal from 64.09 to 72.86 could offer a long opportunity, targeting the 110.00 psychological area.
The alternative trading approach is to wait for the price to come below the dynamic Kijun Sen level and form a bearish H4 close. In that case, the selling possibility could trigger, targeting the 36.00 area.
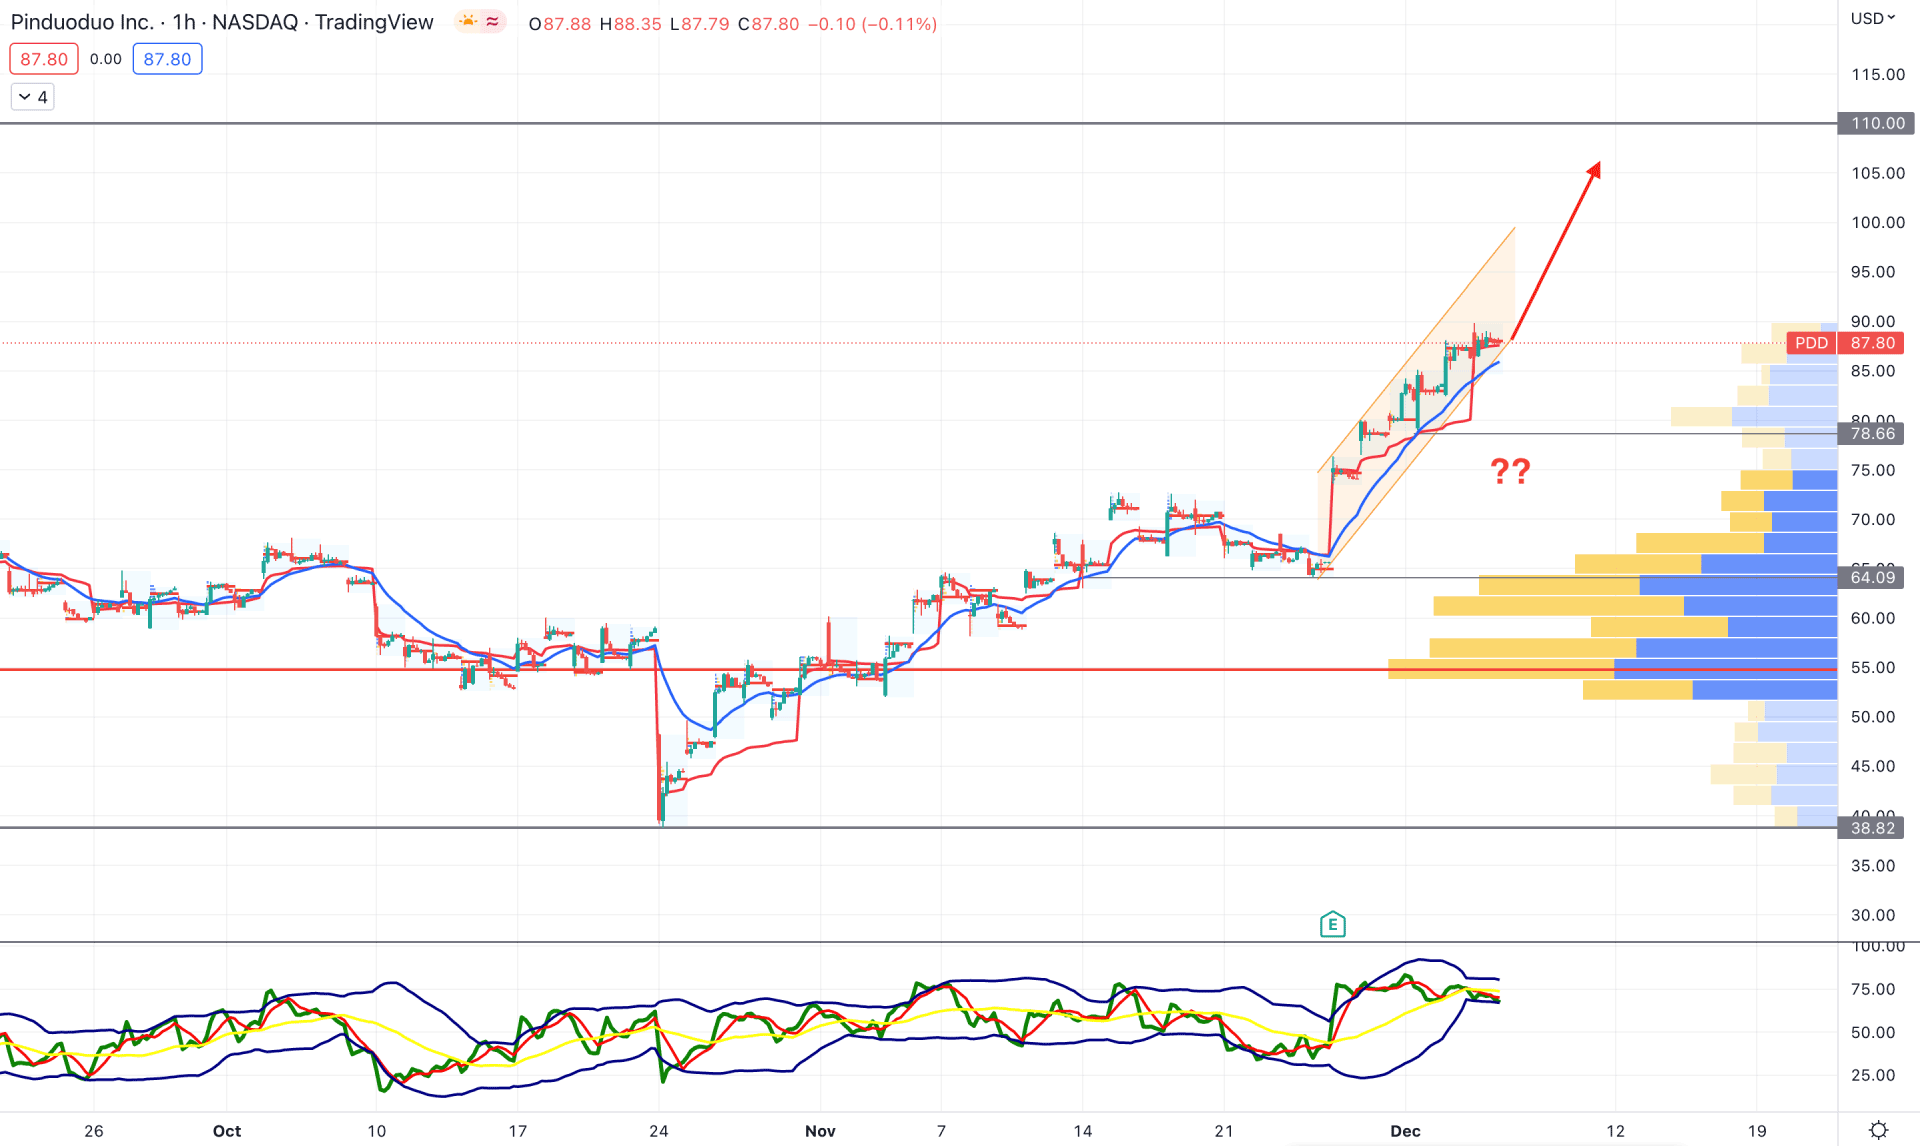
In the PDD H1 chart, the buying possibility is solid as it appeared above the visible range high volume level. It is a sign that short-term bulls are still in the market and there is no sign of a strong trend reversal.
The bullish crossover point between dynamic 20 EMA and weekly VWAP is at the 78.66 level, which is the primary barrier for sellers. The Trades Dynamic Index shows the same story, where the current TDI line is at a neutral point.
Based on the H1 structure, a trend continuation may appear if there is a bullish reversal from the dynamic weekly VWAP or static 78.66 level.
On the other hand, breaking below the 77.00 level with an H1 candle could increase the possibility of reaching the 60.00 area.
Based on the current price outlook, PDD could extend the bullish momentum in the coming days. Moreover, a bearish reversal from the premium zone needs to form a bearish Quasimodo, which will open a short opportunity.


