
Published: August 27th, 2025
Pi Network (PI) is trading lower and is approaching its August 1 record low of $0.322. With more than 149 million tokens set to unlock next month, traders are preparing for a significant event that could increase selling pressure against already diminishing trading volumes and waning market sentiment.
More than 149 million tokens, valued at $50.71 million, are scheduled to unlock in September, according to the monthly unlock stats of PiScan. In addition to increasing the amount of PI in circulation, these token unlock occasions may also raise selling pressure, which could lower prices. However, since the trading community expects the transition and likely positions itself accordingly, anticipated unlock dates may not have as significant an impact.
The PI chain's drop in liquidity and interest is another warning indication for traders. According to data from the Artemis Terminal, the average daily token volume for trading has been declining steadily since mid-May. As of today, it was $43.8 million, indicating a decline in market interest.
Since mid-May, the price of Pi Network has been moving in a downward channel pattern, which is created by joining several highs and lows with two trend lines.
Let's see the further aspect of this coin from the PI/USDT technical analysis:
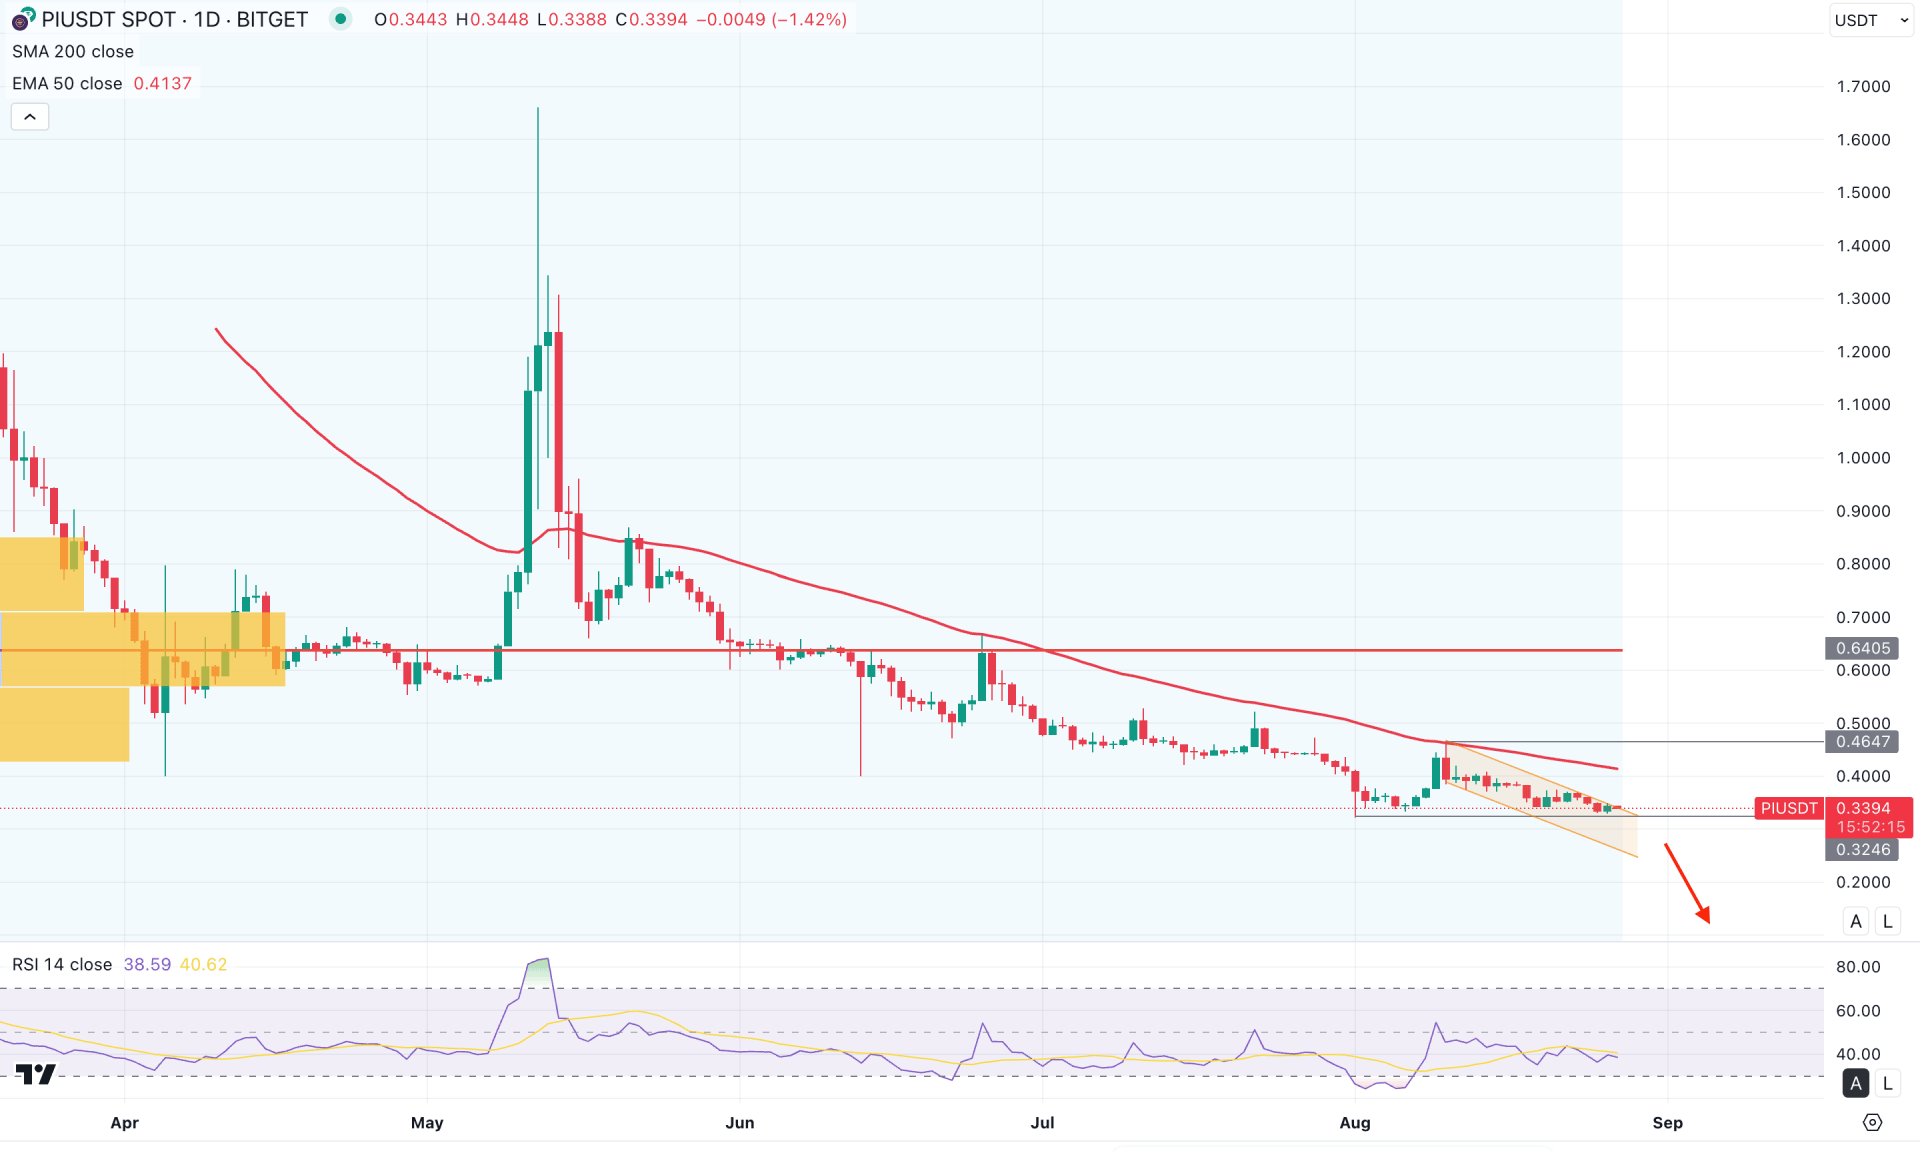
In the daily chart of PI/USDT, extreme selling pressure is visible, supported by fundamental weakness. In this case, the downside momentum could extend, and investors may consider opening short positions from reliable price areas.
The higher timeframe structure shows no significant buying pressure, as the bearish inside-bar breakout in May 2025 has continued with red candles for three consecutive months. Although the price is trading with corrective momentum, no strong buyer presence is visible in the weekly timeframe.
Based on the volume, sellers' dominance is clear. The high-volume level indicator suggests that the most active level since February 2025 is at 0.6405, which is 87% above the current price. After a bearish reversal from this high-volume resistance, the price formed consecutive lower lows with no signs of a bullish recovery.
On the daily chart, the 50-day Exponential Moving Average (EMA) is acting as resistance, with a strong bearish reversal observed on 11 August. As the price faces resistance from both the descending channel and the 50-day EMA above the current level, the likelihood of a deeper decline toward the channel bottom is high.
The indicator window shows corrective pressure, but momentum failed to hold above the 50.00 neutral point. As a result, the Relative Strength Index (RSI) has moved lower, hovering between the 50.00 and 30.00 zones.
From a broader market perspective, the upcoming token unlock could be a crucial bearish factor for this crypto. Moreover, ongoing selling pressure at higher levels signals a possible bearish continuation in the coming days. In this case, the trading approach would be to look for a break below the 0.3246 level before opening short opportunities toward the 0.2357 level, which is the 161.8% Fibonacci extension level of the recent swing.
On the other hand, a bullish breakout from the channel, with price holding above 0.4647, would validate the initial bullish bias. However, only overcoming the 0.6405 high-volume level with proper consolidation could confirm a bullish trend reversal, aiming for the 1.0000 psychological level.
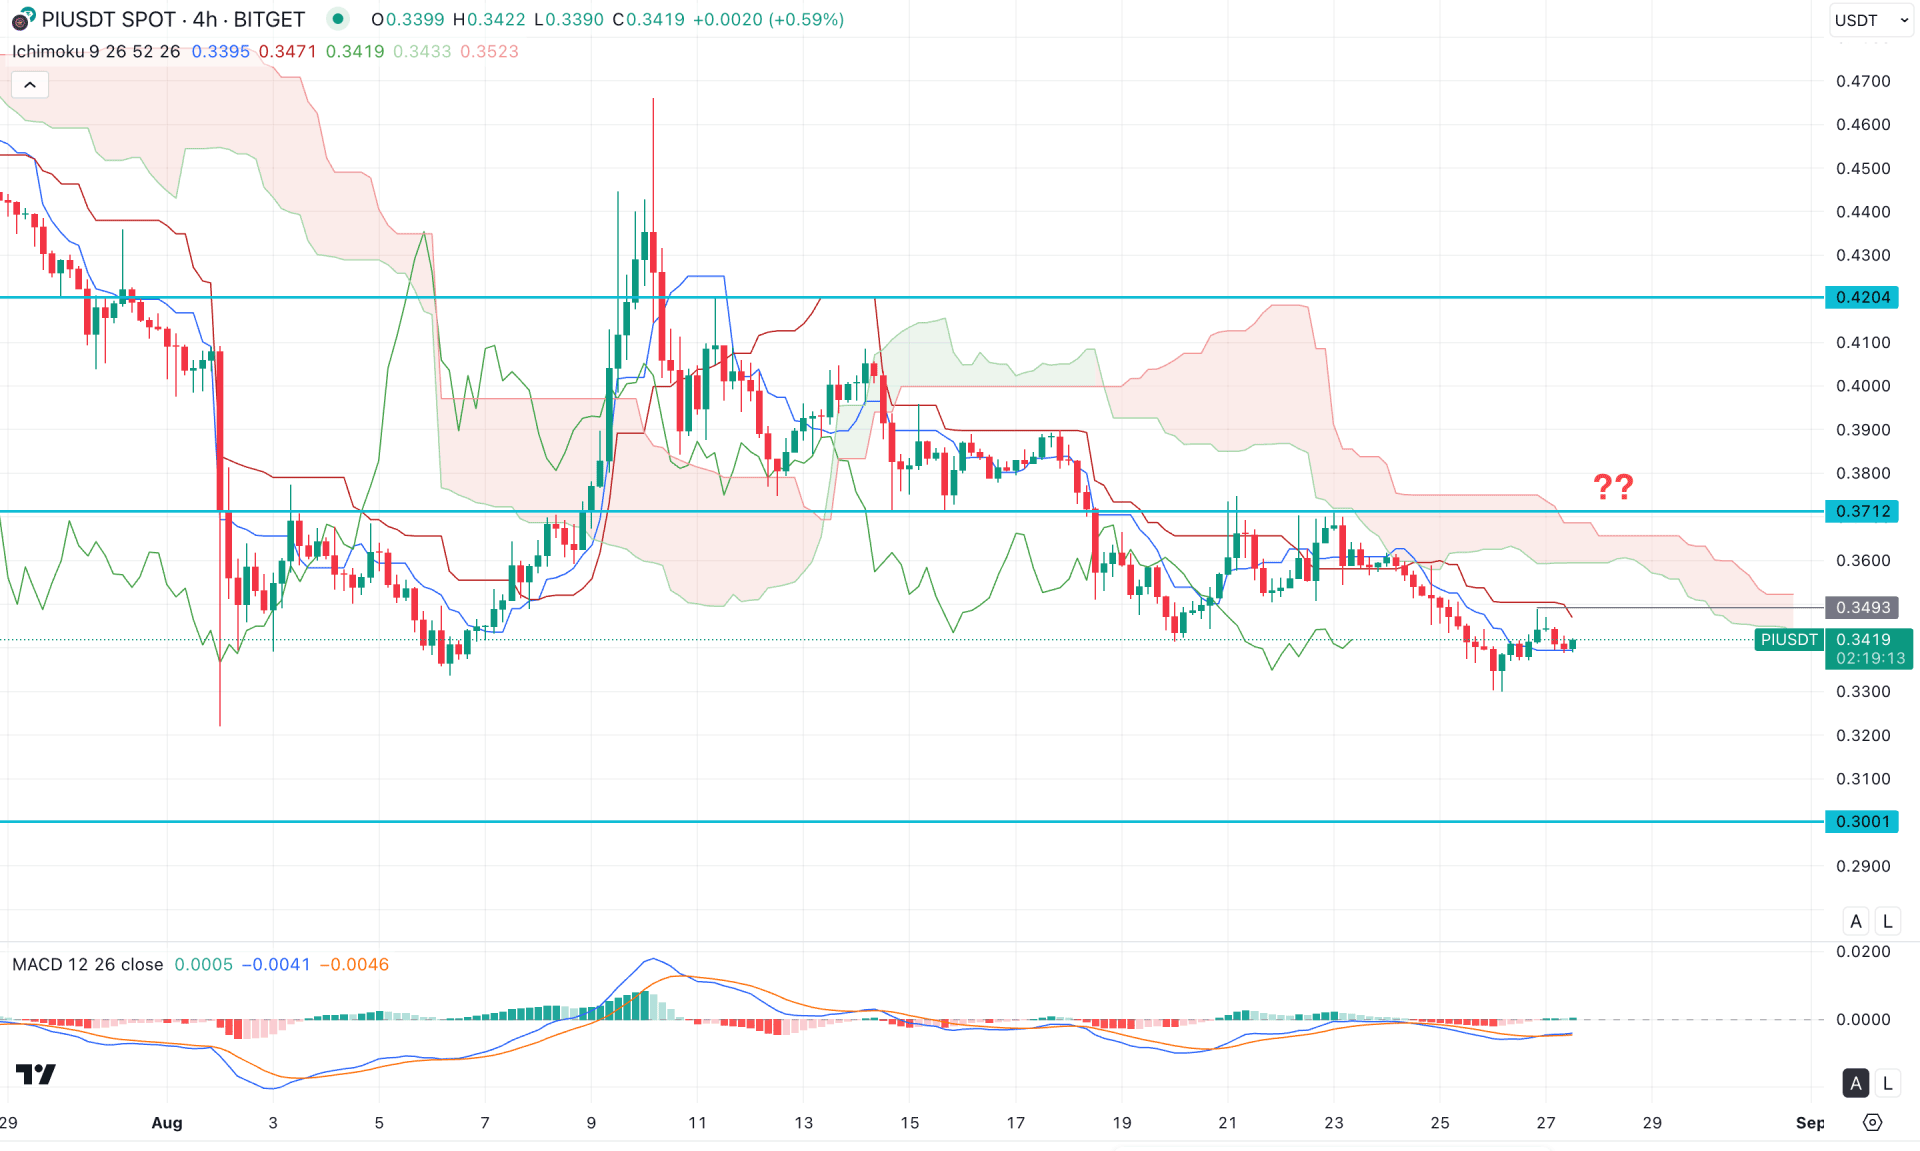
In the four-hour timeframe, the recent price shows signs of bullish exhaustion, as the immediate upward recovery above 0.4509 failed to sustain momentum and faced immediate downside pressure. As a result, the price formed a bearish cloud breakout before continuing to make lower lows. Since the most recent price is consolidating below the cloud resistance, the primary expectation for this pair is to look for short opportunities.
In the future cloud, both lines are heading lower, and the cloud remains below the secondary pivot zone. However, the indicator window shows a different picture, as the MACD histogram flipped to the upside and moved above the neutral level. Moreover, the MACD system has found a bottom and signaled a bullish crossover.
Based on the overall outlook, the price is likely to aim higher and form a bullish correction before extending the existing bearish trend. In that case, bullish pressure above the 0.3493 level, with immediate recovery, could provide an early short opportunity. Overall, the price may range between 0.3493 and 0.3700, which would act as a crucial bearish zone. On the downside, immediate support lies at the 0.3300 level, with a possible move lower toward the 0.3000 mark.
On the other hand, a strong bullish signal is required before anticipating a sustainable bullish move. A breakout above the cloud high, with price holding above 0.3800, could invalidate the downside structure and take the price toward the 0.4204 resistance level.
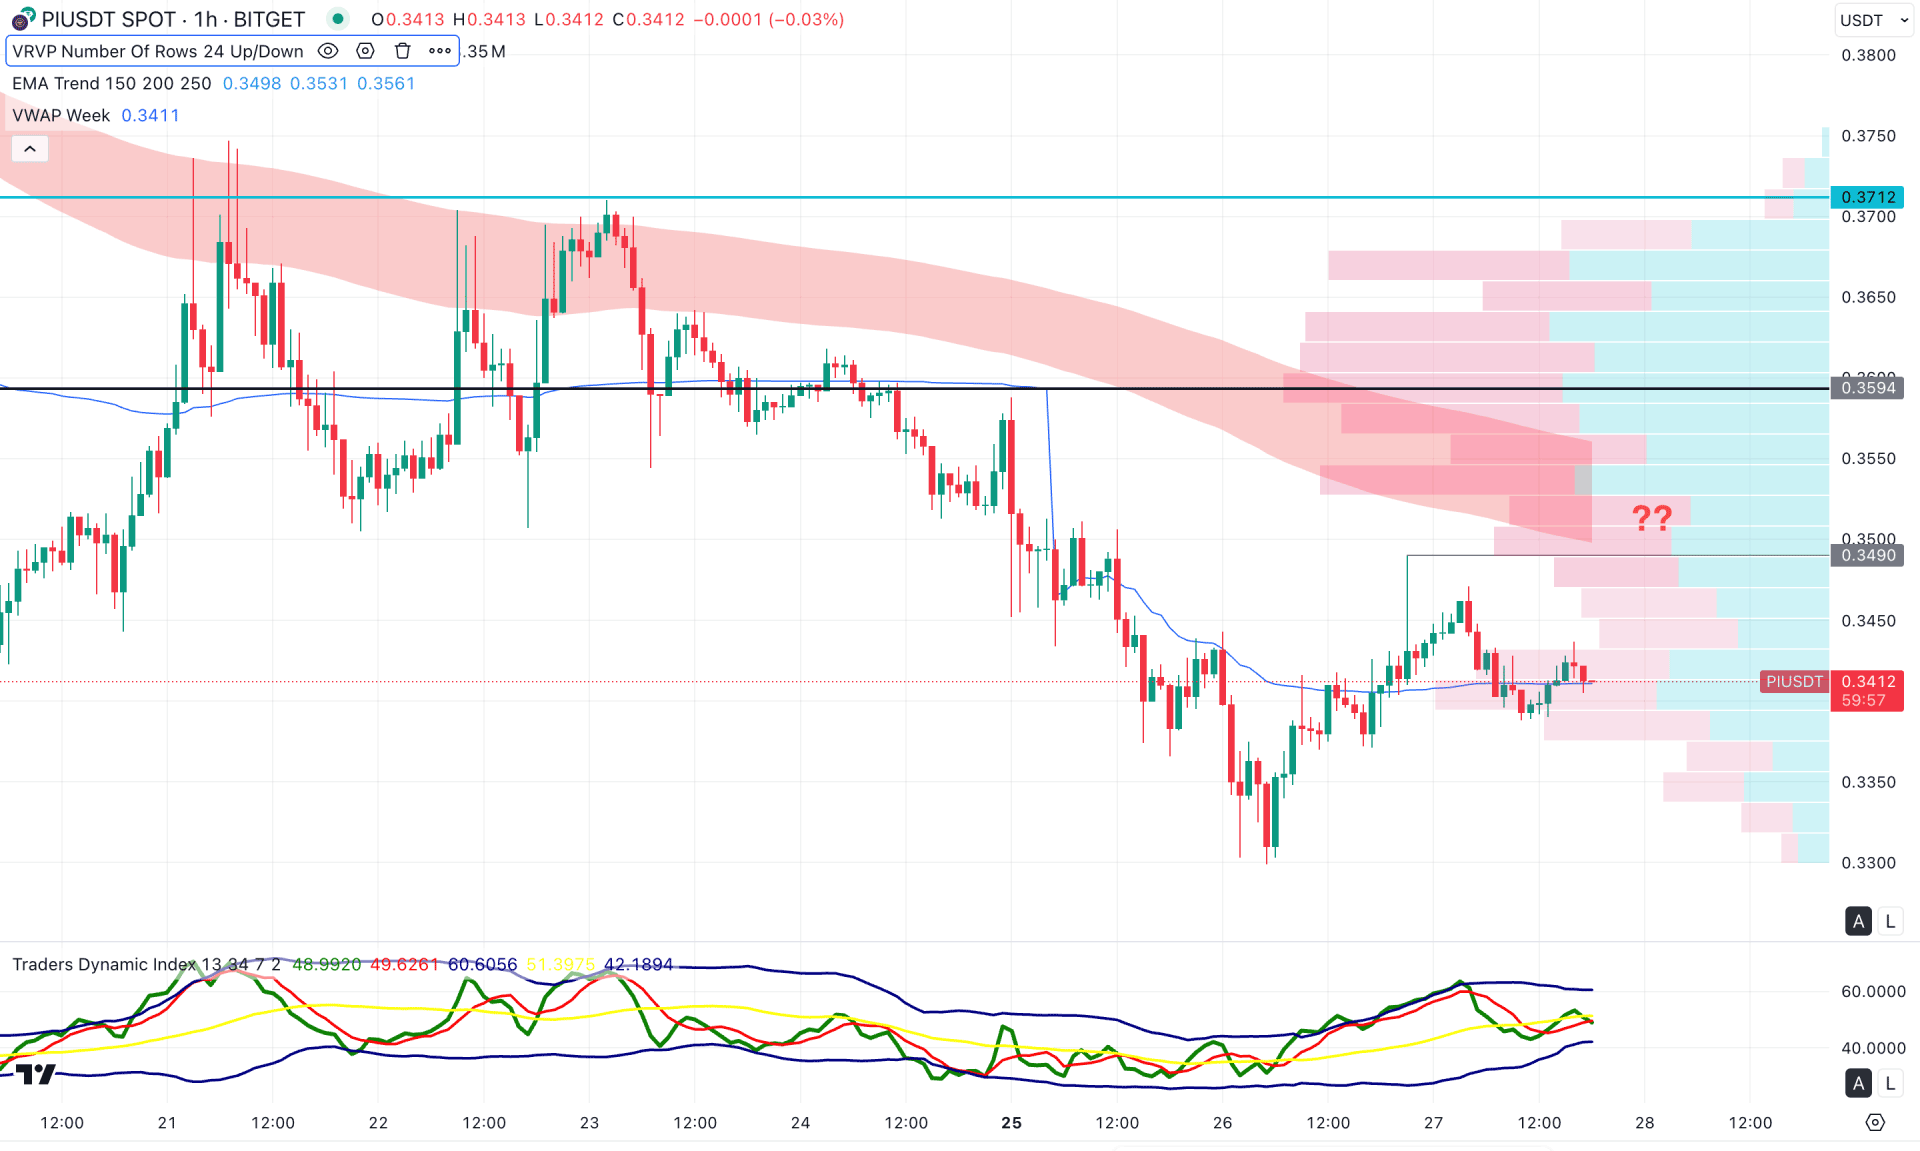
In the hourly timeframe, the intraday selling pressure is visible where the MA wave is acting as a crucial resistance. Moreover, the intraday high volume line is above the current price and working as a confluence of selling pressure.
In the indicator window, the Traders Dynamic Index (TDI) has reached the peak before touching the 50.00 neutral point. It is a sign of a potential top formation in the main price chart, from where a bearish continuation is possible.
Based on this outlook, the downside pressure is valid as long as the 0.3490 resistance level is valid. In that case, the price is likely to extend the bearish momentum towards the 0.3000 psychological area in the coming hours.
Based on the broader outlook, PI/USDT is more likely to extend the selling pressure and possibly make a new all-time high soon. The upcoming token unlock, followed by a descending channel continuation, signals no buying activity from the bottom.


