
Published: May 23rd, 2023
A study published on Monday revealed that Pfizer's oral drug outperformed Novo Nordisk's diabetes treatment, Ozempic, regarding weight loss rate. This news significantly increased the stock price of Pfizer.
To evaluate its experimental medication, danuglipron, Pfizer conducted a study involving 411 adults with type 2 diabetes. Over the course of 16 weeks, patients who received a high dosage of Pfizer's drug lost approximately 10 pounds on average. In contrast, participants in Novo's Phase 3 trial who received significant doses of Ozempic experienced comparable weight loss over the course of 30 weeks.
In light of these findings, Pfizer's potentially more convenient twice-daily tablet will compete with the well-known Ozempic. As reported by the Food and Drug Administration, Ozempic generated $8.55 billion in sales last year and is projected to reach $12.19 billion this year.
Comparatively, Pfizer's quarterly net income decreased to $5.54 billion, or 97 cents per share, from $7.86 billion, or $1.37 per share, during the same period the previous year.
The company's first-quarter sales totaled $18.28 billion, representing a decrease of 29% compared to the same period last year.
Among the sales figures, Covid-related products accounted for $7,1 billion. Pfizer earned $3 billion from the sale of Covid vaccines and $4 billion from the antiviral Paxlovid derived from Covid.
The company maintains its 2023 sales forecast of $67 billion to $71 billion moving forward. Pfizer also reiterates its full-year adjusted earnings per share forecast of $3.25 to $3.45.
Is it a good time to invest in Pfizer stock (PFE)? Let’s have a look at the complete outlook from the PFE technical analysis:
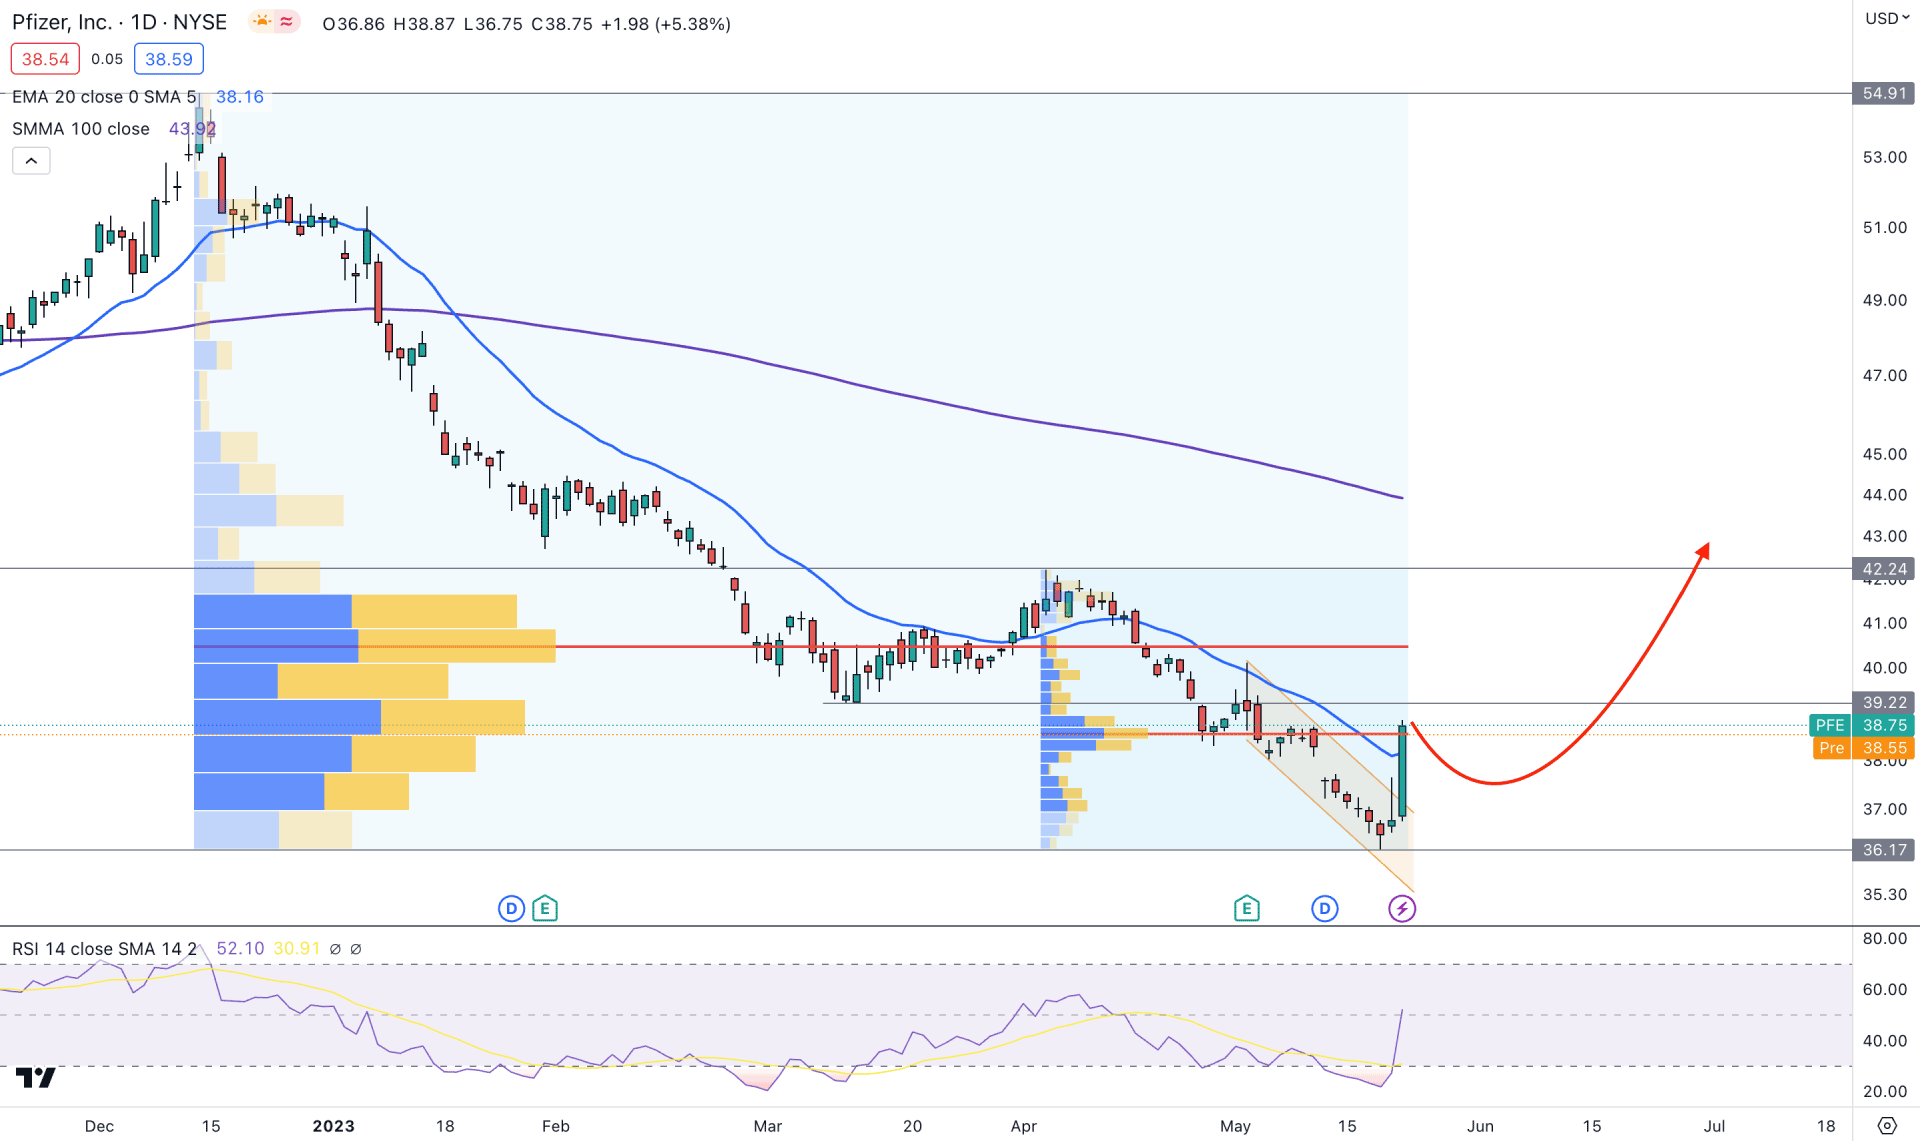
At first impression, the daily market trend shows a strong downward pressure from where taking a long position needs additional attention.
Since December 2022, PFE daily price is consistently making lower lows where the recent bottom is formed at the 36.17 level. As the latest daily candle shows the highest 1-day movement this year, we may consider the 36.17 level as a valid bottom. In this context, the primary trading outlook is to look for long trades where the 36.00 level would be the invalidation area.
If we look at the volume structure, bears are still in control as the highest activity level, from 54.91 high to 36.17 low, is spotted at the 40.45 level, 4.5% above the current price. Another high volume level from the 42.24 high to the 36.17 low is at the 38.71 level, which is already breached with a bullish daily candle close. As a result, investors might find a conservative buying approach in this instrument after having a D1 candle above the 40.45 level with a considerable correction.
In the main chart window, the daily candle violates the current dynamic 20-day Exponential Moving Average. However, the buying pressure is insufficient as the D1 candle failed to move more than 50% of the body above the 20 EMA level. It is a sign that investors should wait for a correction, and a buying possibility may come after a new swing high above the 39.00 level.
In the indicator window, the RSI structure supports the bullish pressure as it trades above the 50.00 neutral line with a massive speed.
Based on the daily price prediction of PFE, a strong fundamental background has already influenced bulls to dominate their position in this stock. In that case, a solid bullish D1 candle above the 39.22 critical event level could validate the buying possibility towards the 43.92 resistance level, which is the 100-day Simple Moving Average level.
However, a bearish pressure with a daily close below the 36.17 level will invalidate the descending channel breakout. In that case, more downside pressure may come into this stock, where the primary target would be the 30.00 psychological level.
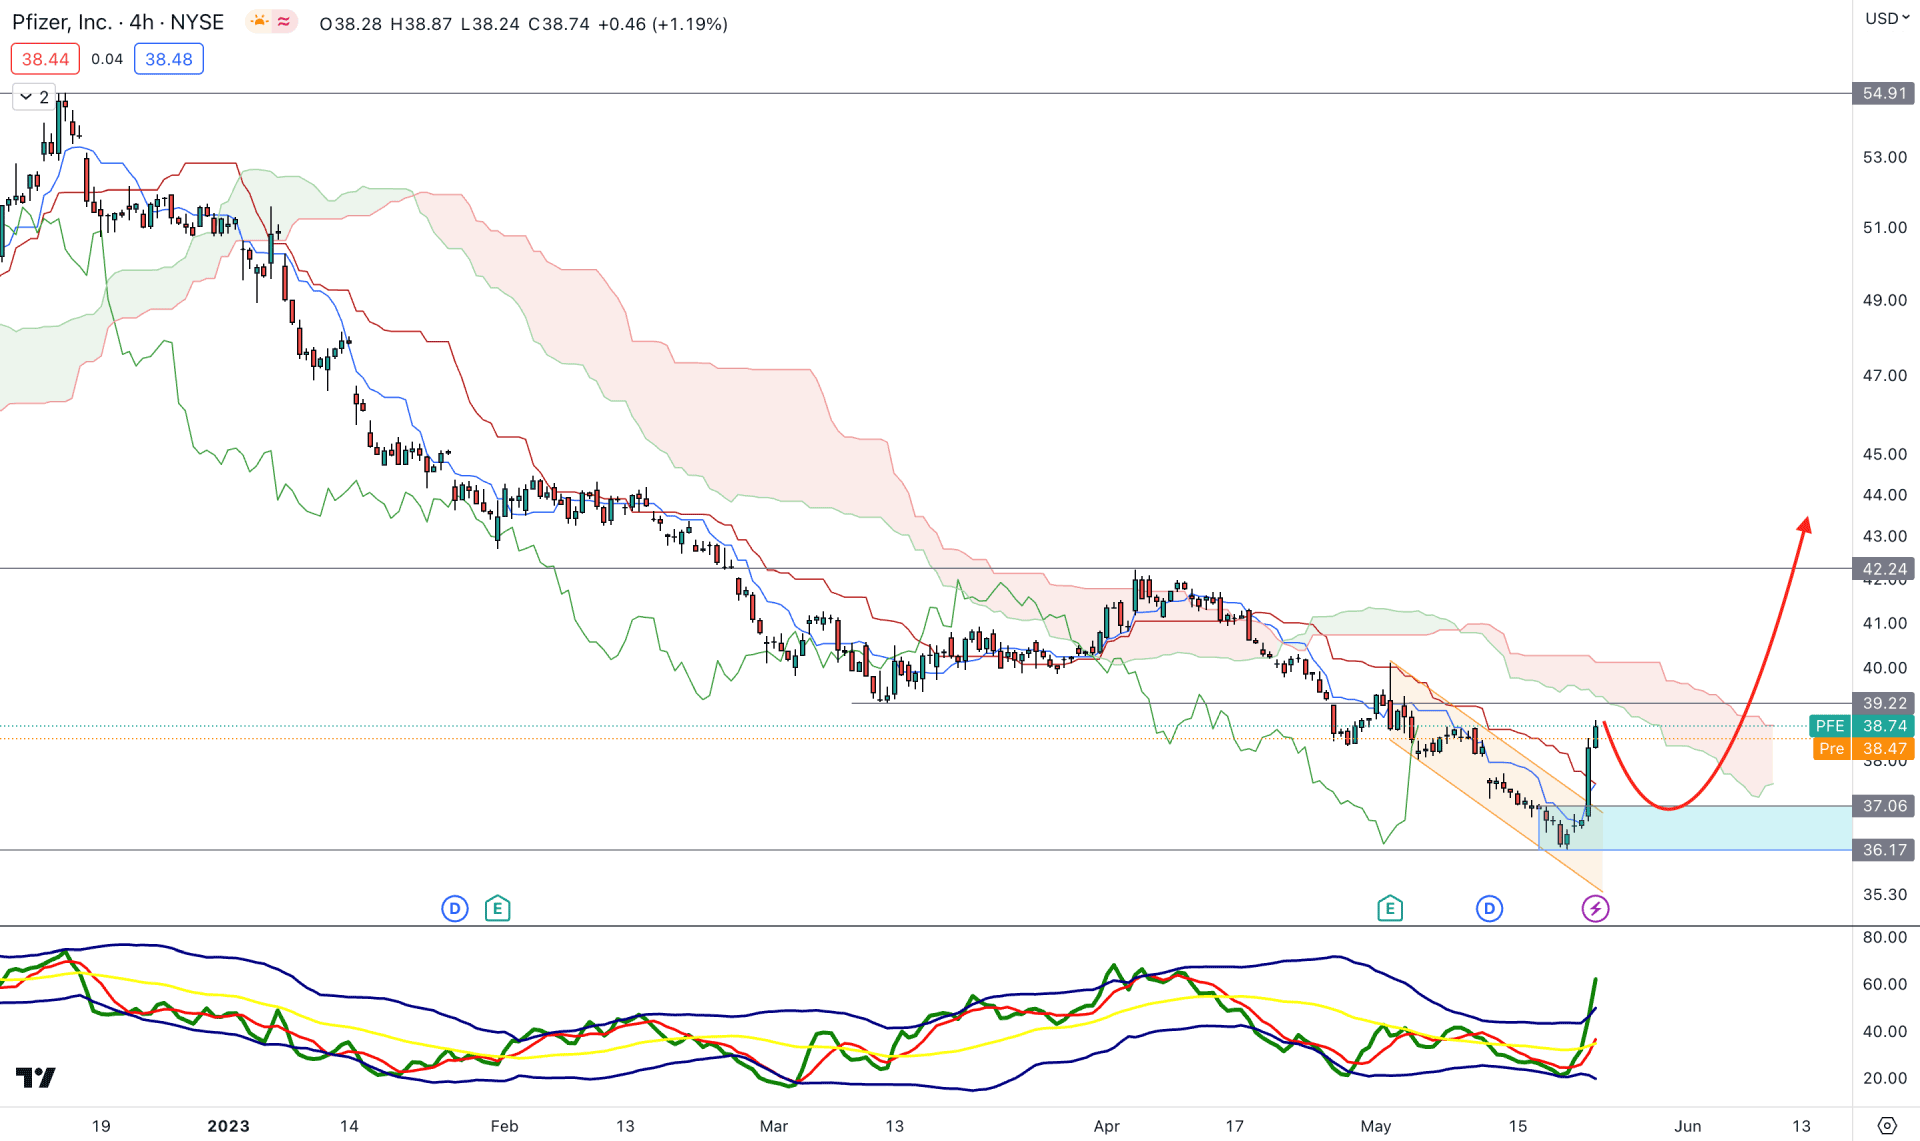
In the H4 timeframe, investors need additional confirmation before opening any long position in PFE.
In the future cloud, the Senkou Span A is still below B, while the current Lagging Span is closer to the current price. The only hope for bulls is the current bullish crossover among dynamic Tenkan Sen and Kijun Sen with an H4 candle above these.
In the indicator window, the buying pressure is validated by the stable Traders Dynamic Index (TDI) above the neutral line, which signals that intraday bulls are active in the market.
Based on the H4 structure, a conservative buying approach is to wait for a valid breakout and a bullish rejection from the dynamic Kijun Sen support. However, an immediate rebound and an H4 candle below the 36.17 level might invalidate the current setup by lowering the price toward the 30.00 area.
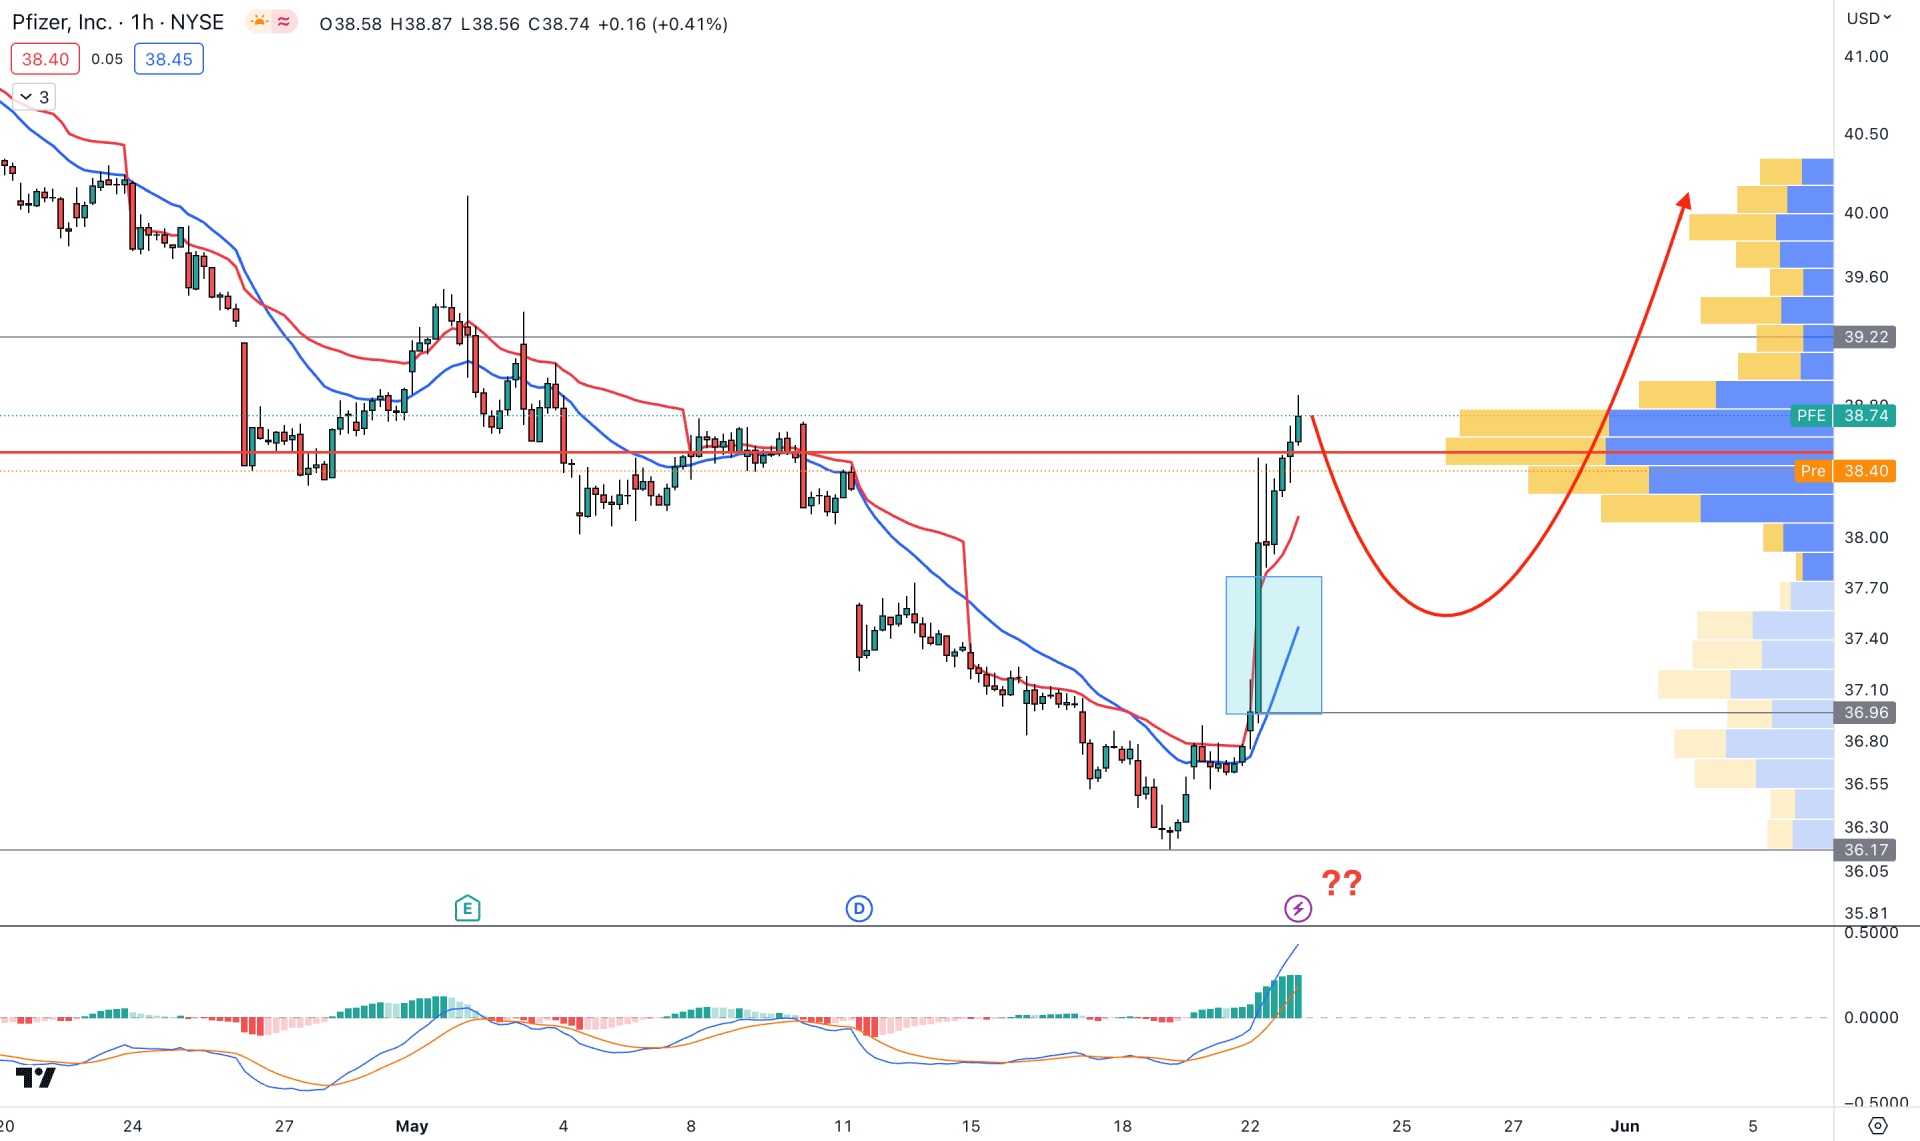
In the H1 chart, strong buying pressure has been seen since the news came, with no sign of a bearish intraday pressure. Also, a new intraday high volume level formed, and the trading day ended above it.
The indicator window also supports the upside pressure as the current MACD Histogram is stable above the neutral line. However, the immediate, impulsive momentum left some areas untested with a gap with dynamic support levels.
Based on this structure, a minor downside correction towards the 37.77 to 36.95 imbalance area with a strong bullish rejection from the dynamic 20 EMA could offer a long opportunity, targeting the 41.00 level.
Investors must have a deeper understanding of the macro outlook of the US economy before opening a long position in PFE. The uncertainty from the debt ceiling and US-China war sentiment might invalidate any technical setup. Apart from this, a valid channel breakout with a fundamental background could offer a decent long opportunity in the PFE stock.


