Published: January 29th, 2021
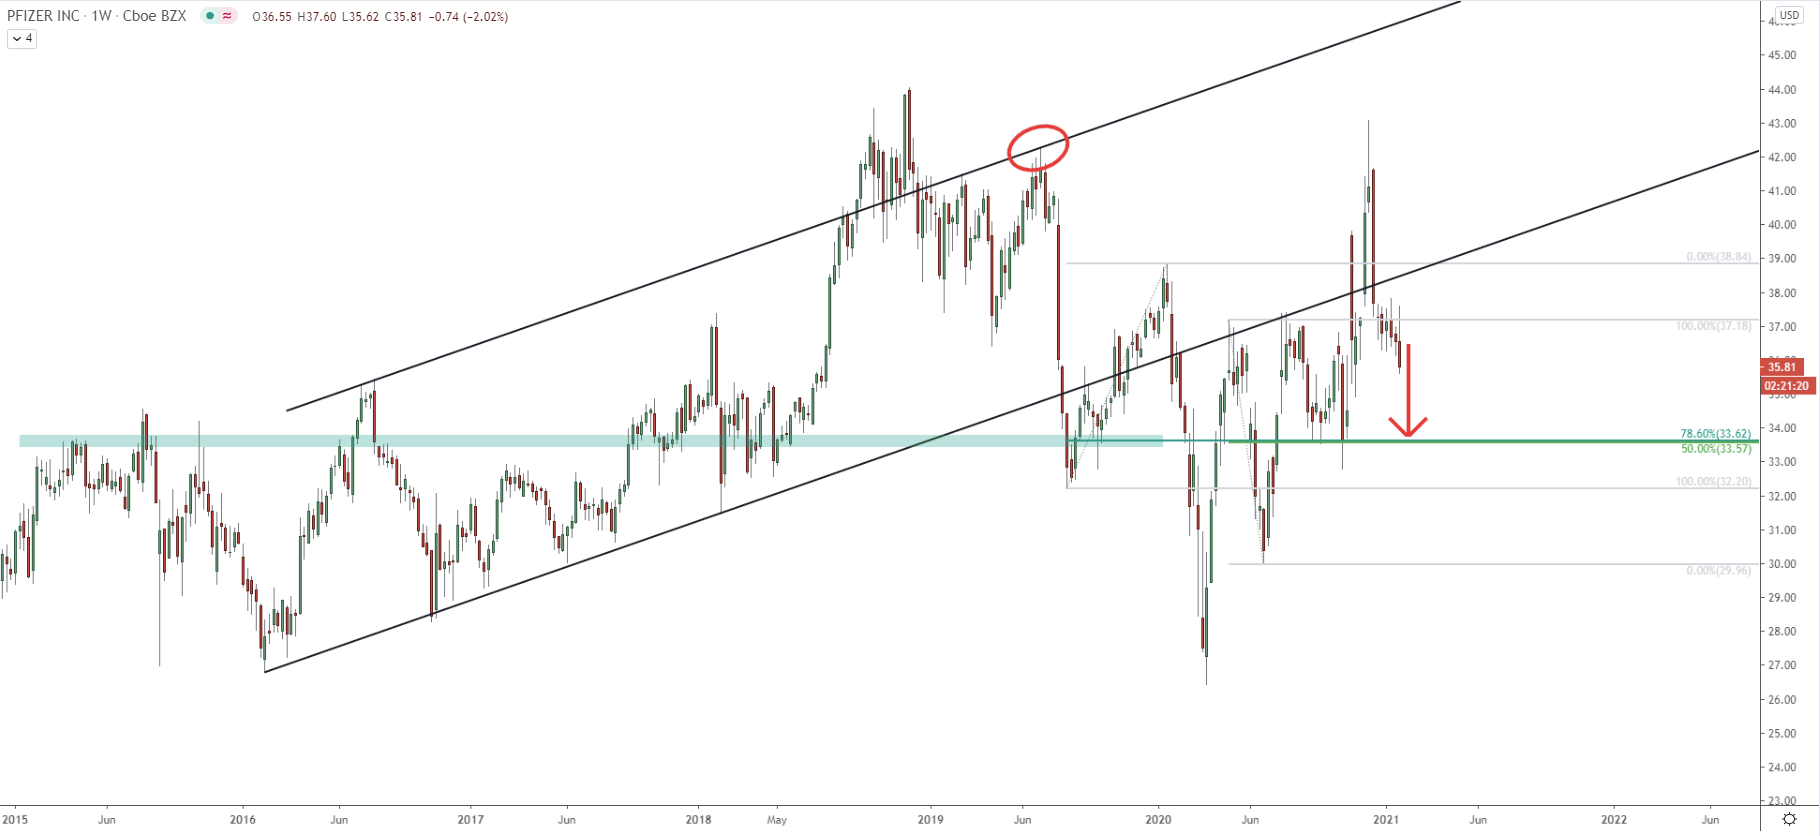
Starting with the weekly chart, the PFE stock has been showing some strong downside moves since the middle of 2019. The first strong decline took place when the price has bounced off the upper trendline of the ascending channel, resulting in the price drop from $42 to $32 level. Then the price has corrected up, and in 4 months there was another selloff, where the price has dropped from $38 down to the $26 low in March 2020.
Right now, it is the mixed sentiment on PFE, although the probability or a short to the medium-term trend is slightly in favor of another downside move. Right now price could be heading towards the $33 support area, which is a supply/demand zone formed since 2015. At the same time, this support is corresponding to two different Fibonacci retracement levels, namely 50%, and 78.6% Fibs as can be seen on the chart. It makes the $33 price area similar to a magnet, and can easily be re-tested once again before/if the uptrend will continue.
It can be seen, that the downtrend trenldine was broke back in November 2020, suggesting trend reversal to the upside. Nonetheless, Fibonacci applied to the trendline breakout point, shows taht the final upside target has been tested when the price reached $43. This level corresponds exactly to the 0% Fibs, making it a complete move based on the trendline break. After the price has cleanly rejected the 0% Fibs at $43, sellers took complete control and sent the price down to the $35 area, where Pfizer is currently trading.
The 50 Exponential Moving Average was broken, but the drop was stopped by the bottom of the ascending channel. While there is a confirmed breakout of the 50 EMA, there is no confirmation that the bottom of the channel will get rejected. In fact, quite to the contrary, considering a strong selling pressure, the probability favors break to the downside.
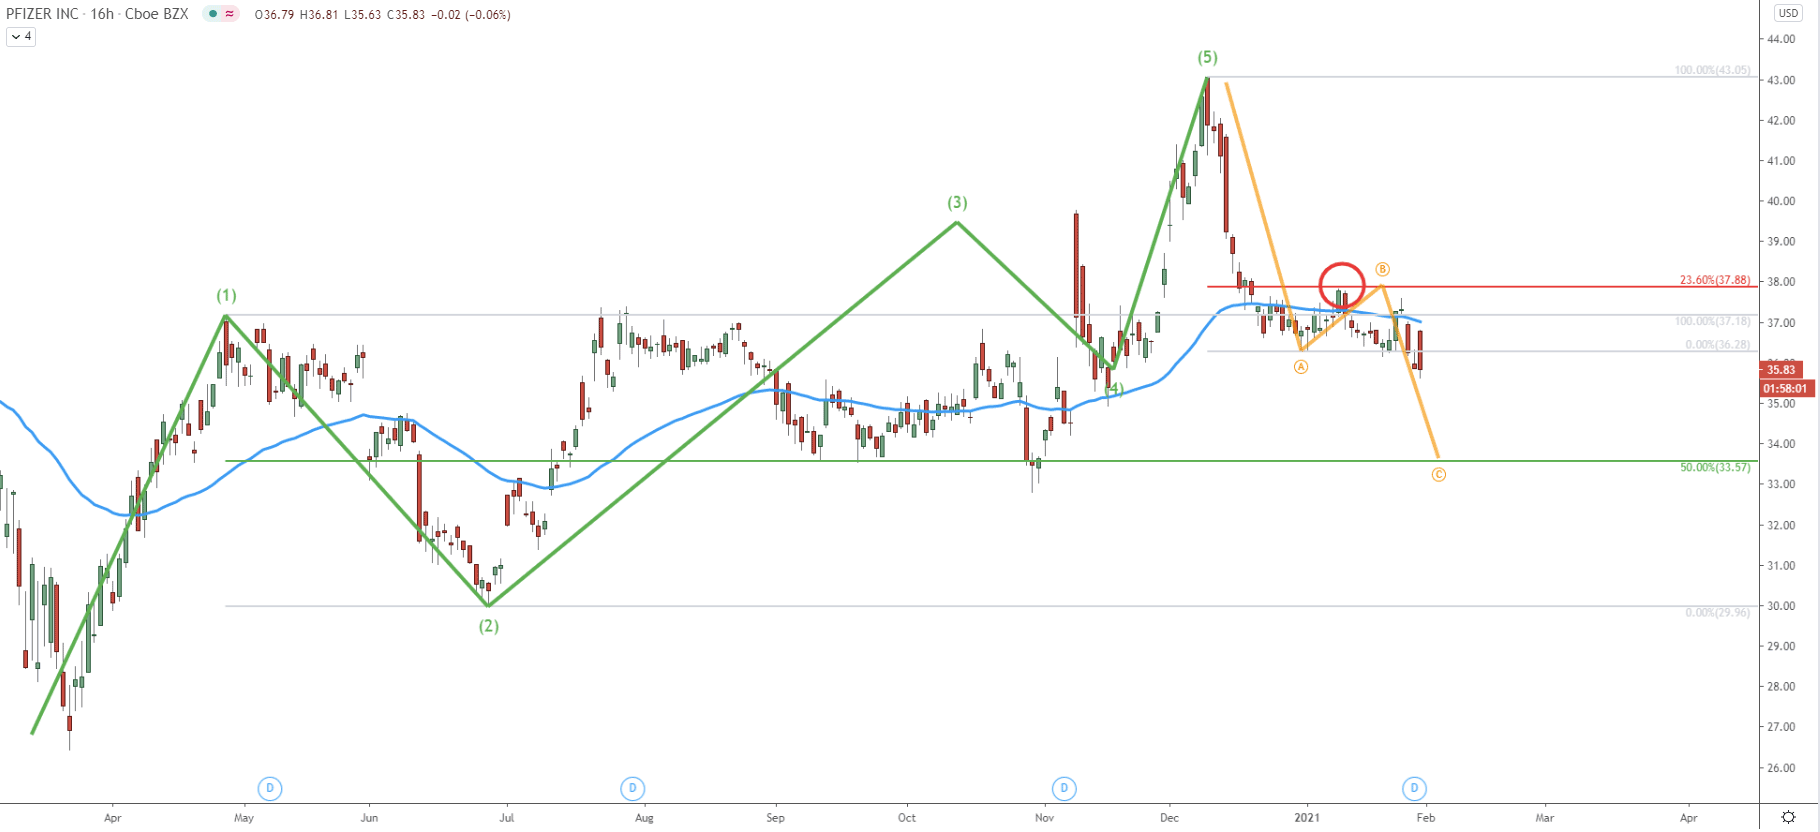
On this chart, an Elliot Wave theory has been applied. When the price has tested the $43 high, it looks like the uptrend has ended, because it was the final, 5th wave to the upside. If this is the case, currently PFE might be undergoing an ABC correctional phase down. And consider that the 23.6% Fibonacci retracement level at $37 got rejected, the price is likely to complete the final corrective wave down, the wave C. Therefore, a $3 price drop can be expected as long as the price remains below the $38 resistance.
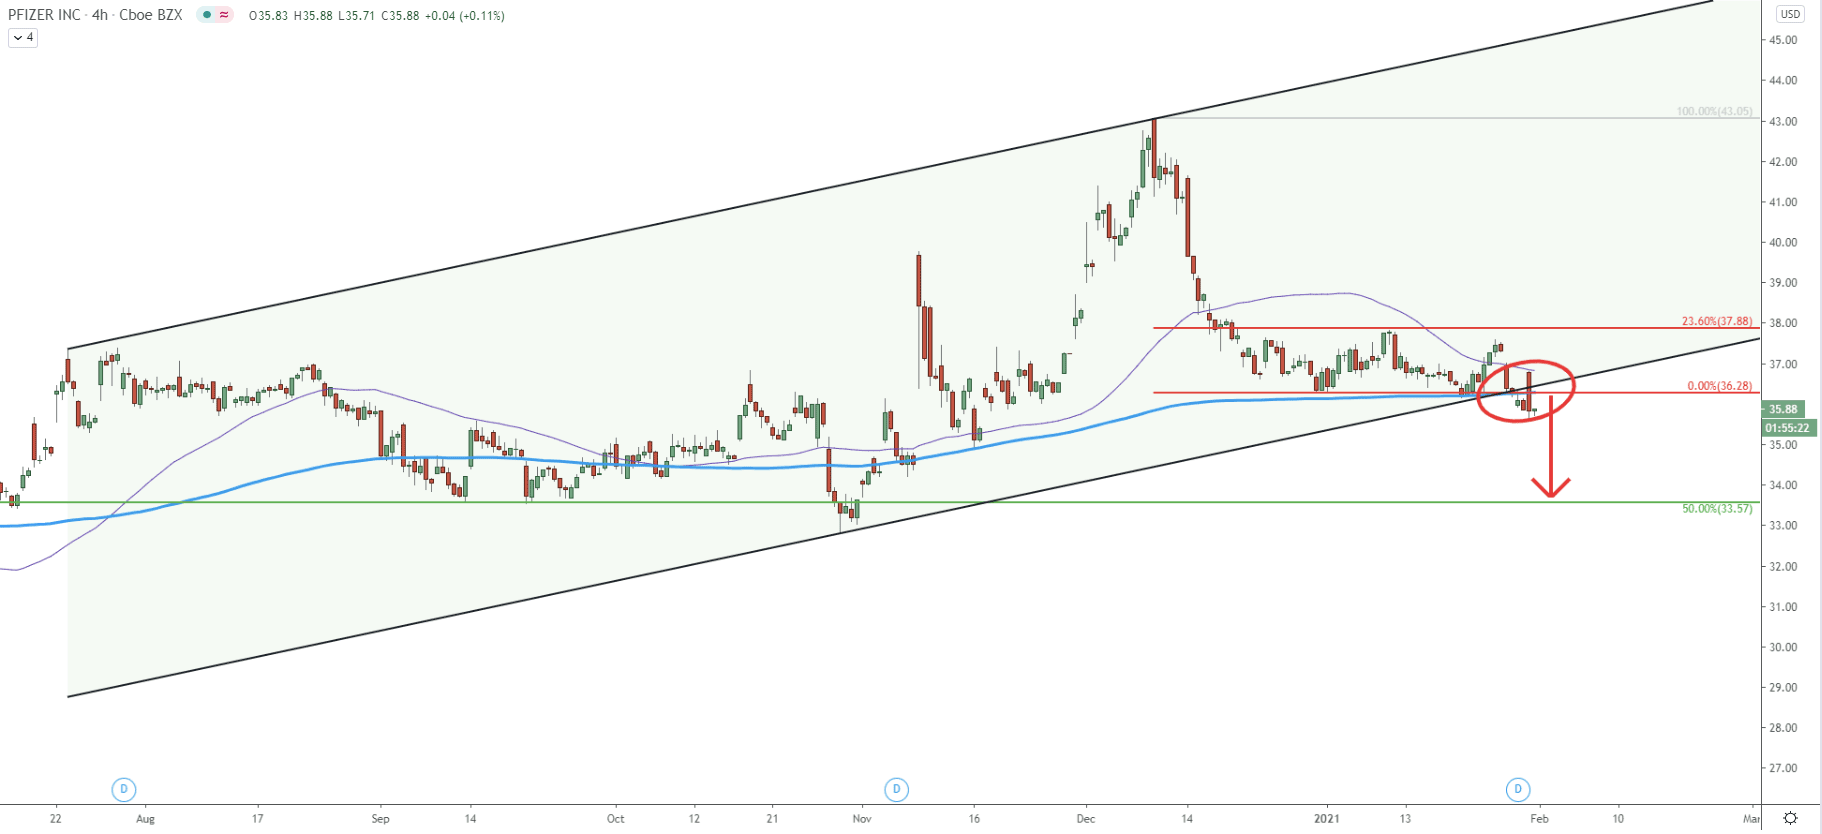
On the 4-hour chart, after rejecting ht e23.6% Fibs, price broke below the ascending channel as well as 200 Simple Moving Average, confirming a strong bearish sentiment. On the minor pullback, which occurred today, Pfizer rejected the 50 Exponential Moving Average and went down below the channel yet again. At this time, the $36 area could be acting as a strong resistance. This is because at this price there was a previous level of support and there is 50 EMA. There is a high probability that the price will consolidate for several days before the downtrend continuation, but overall, the trend seems to be getting more and more bearish considering all the price actions on multiple timeframes.
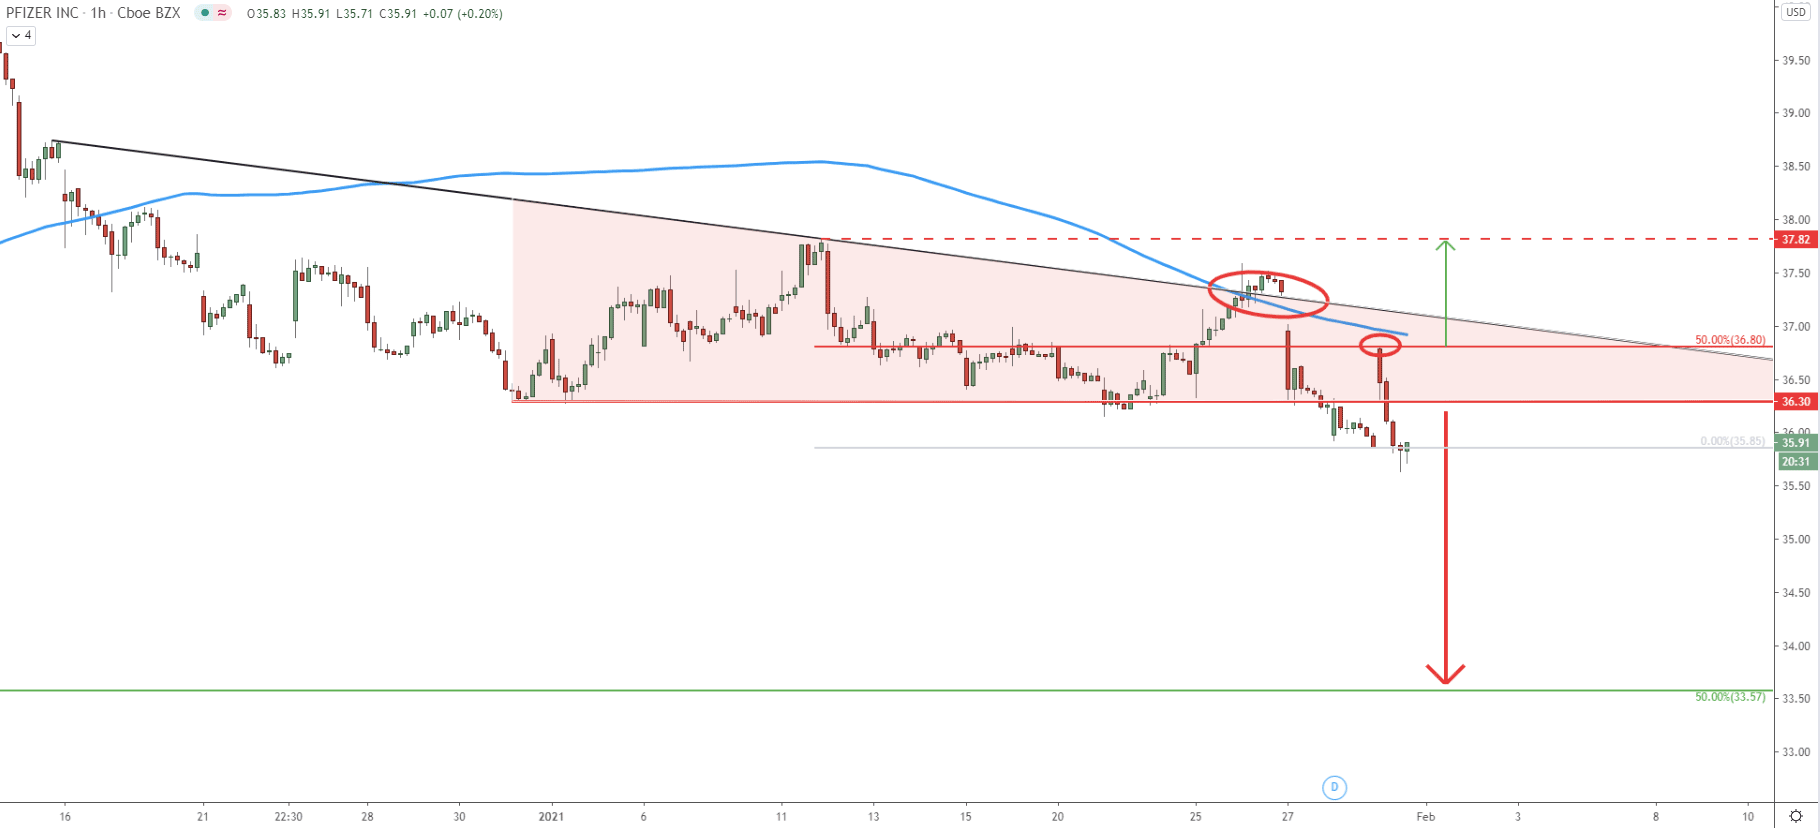
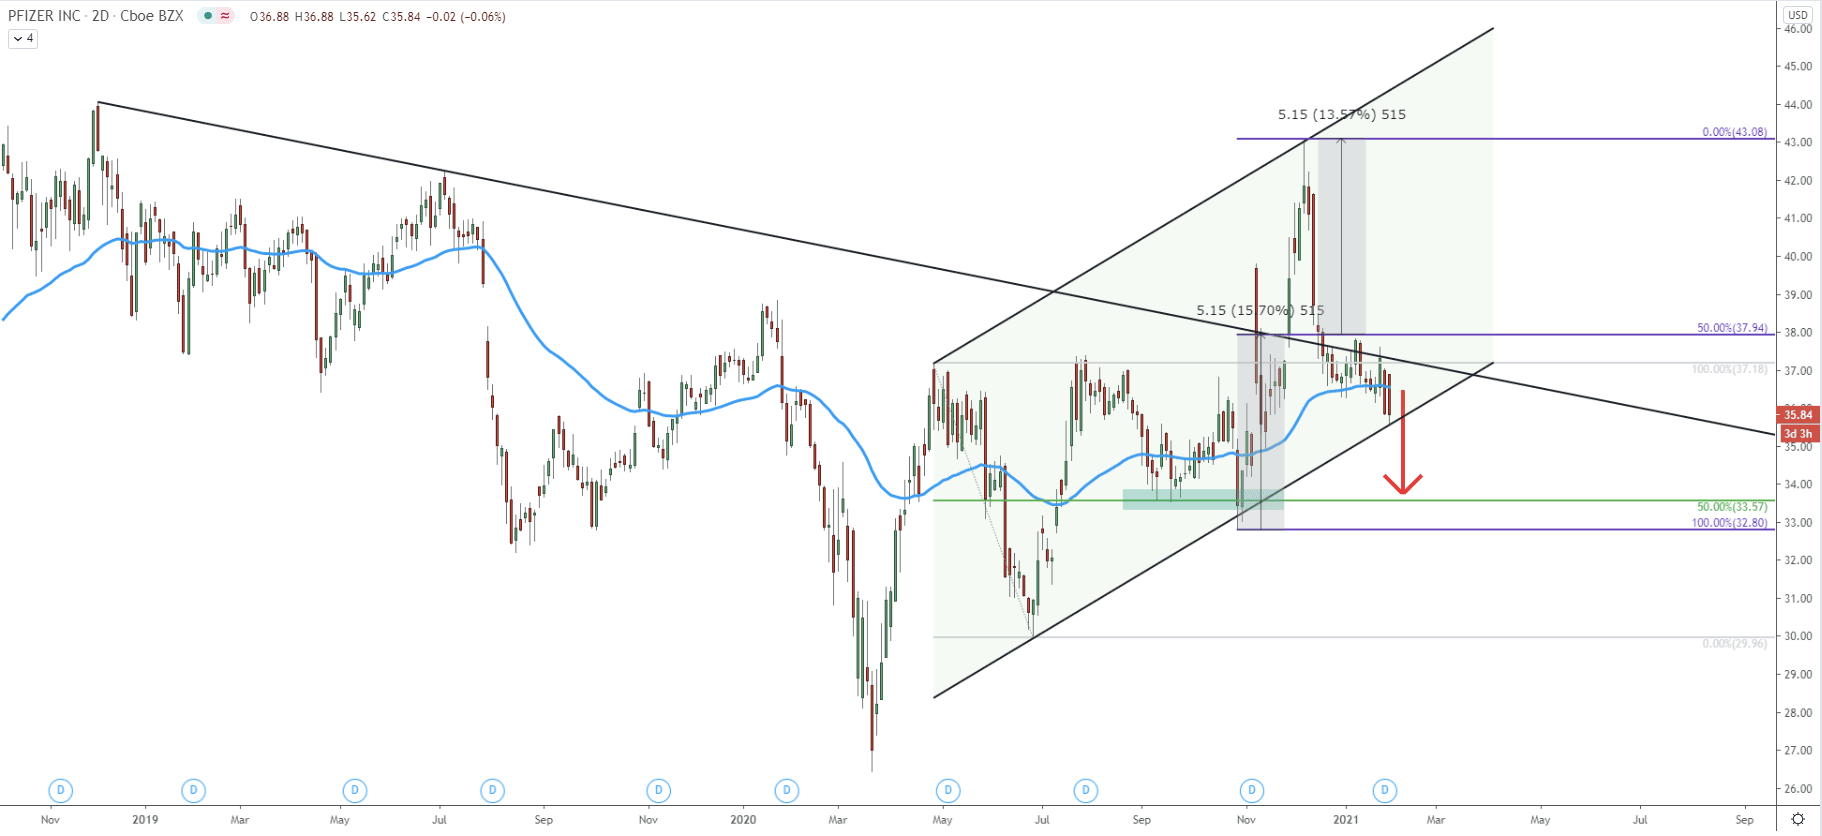
Since the beginning of 2021, the price has been forming a triangle pattern. At the end of December, there was a rejection of the downtrend trendline as well as the 200 EMA. This has resulted in the fast price decline, confirming the break below the triangle. After the breakout, Pfizer has corrected up and cleanly rejected the 50% Fibonacci retracement level at $36.80. It seems like this is a very strong supply zone, and as long as the price remains below, bears will be dictating the pace of the drop.
Pfizer’s price is looking extremely bearish in the short to medium term. There are literally no signs that the trend will reverse up and at this point, any minor pullback could be very attractive for sellers.
As per the weekly chart, the key support level is located at $33.57, which is confirmed by two Fibonacci retracement levels as well as the strong supply/demand area formed during the past several years.
As per the hourly chart, only break above the $36.80 resistance will invalidate a bearish outlook In this case, Pfizer can be expected to rise, potentially towards the precious resistance area near $37.80
Support: 33.60
Resistance: 36.30, 36.80, 37.80


