

Published: July 7th, 2026
PepsiCo is sometimes seen by investors who are seeing inflation pick up speed as a traditional staples investment with a twist.
Even though earnings were recently impacted by a US$3.3 billion one-time loss and continued pressure in North American foods, the company has a strong dividend history with a yield of close to 3.95% and trades at a P/E below that of many peers.
Risk increases with high leverage and declining margins. However, there are several positive factors to consider, such as expense pass-through potential, active shareholder involvement, and a mixed risk-reward profile.
Wall Street is becoming cautious about PepsiCo's (PEP) shares after Barclays reduced its price target on the massive beverage and snack firm before its second-quarter earnings. This move reflects rising concerns about the rate of restoration in the business's North American food division.
Citing worries that gains observed earlier this year could be challenging to sustain, Barclays lowered its price objective for PepsiCo shares from $158 to $144 while keeping an "Equal Weight" rating.
Let's see the further outlook from the PEP technical analysis:
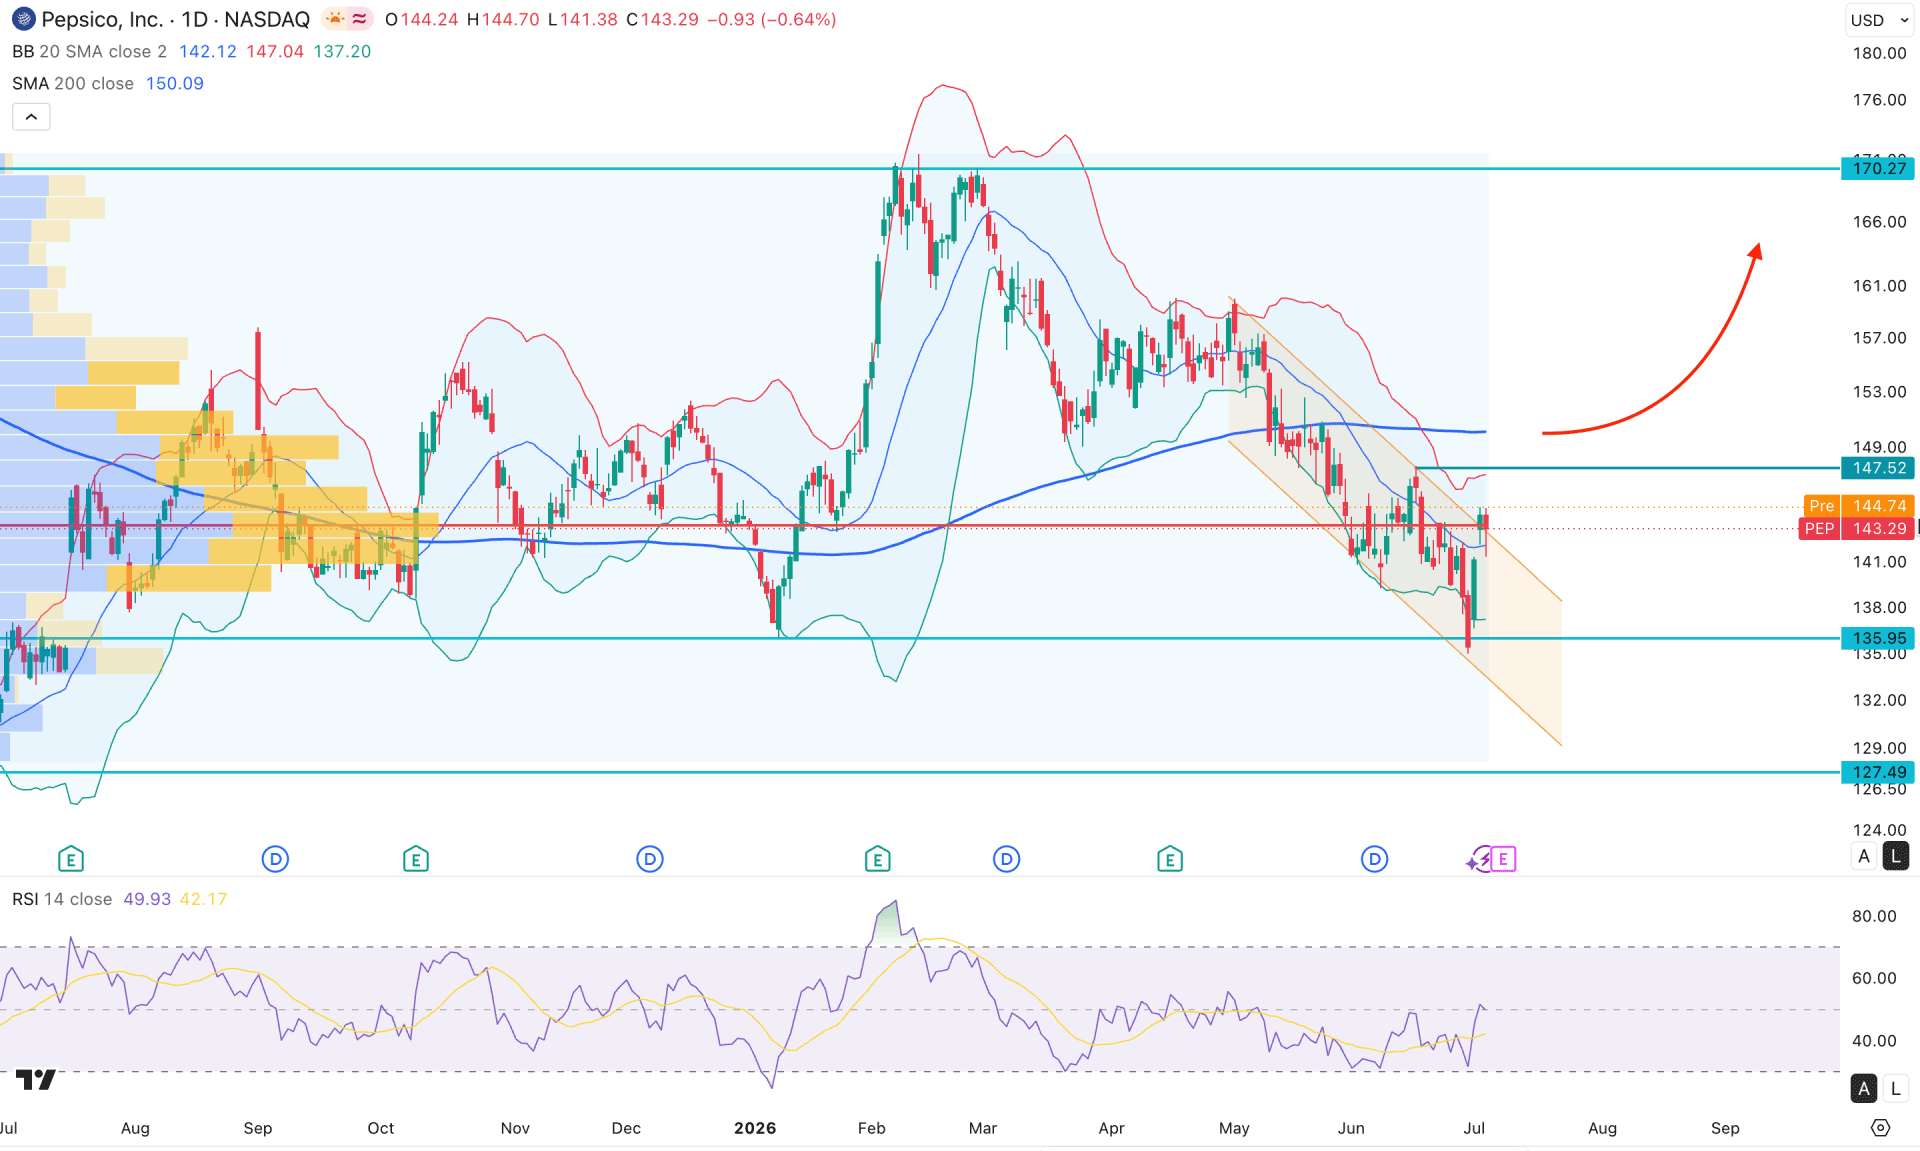
In the daily chart of PEP, the recent price is trading within a bearish continuation, from where a decent bullish recovery is possible. Moreover, the price tested the existing yearly low and rebounded with a valid liquidity grab at the bottom, which signals an additional bullish signal. However, the price is still trading below some crucial resistance levels that need to be overcome before validating the rebound.
Looking at the higher timeframe, the monthly candle suggests a corrective bullish pressure where a rebound is visible from two consecutive bearish months. However, the existing monthly high is still protected, which is working as a crucial resistance. The weekly timeframe, on the other hand, shows a corrective sideways momentum which is insufficient to consider a bullish rebound.
In terms of volume, the price is trading within a consolidative zone where the largest activity level in June 2025 is at the 143.50 level, which is in line with the current price. As the price is within the consolidation zone, a valid breakout is pending before validating continuation.
A descending channel formation is visible where the current price is flirting with the channel resistance level. Moreover, the static resistance level of 147.52 is clearly above the current price, which is working as an immediate barrier.
A bullish daily close is formed above the mid Bollinger band line that came after an exhaustion from the lower Bollinger band area. It is a sign of an early bullish rebound signal, which needs proper validation.
The secondary indicator of the Relative Strength Index is at the 50.00 level, signalling no potential transformation. However, the divergence from the current price area signals a bullish rebound opportunity, which can take the RSI above the 70.00 area.
Based on the market structure, Pepsi stock is still trading within a channel, and a strong bullish breakout with a stable price above the 147.52 resistance level could validate the long opportunity. Primarily, the near-term resistance level is located at 159.93, which could be tested before moving beyond the 170.27 area.
On the other hand, a failure to overcome the 200-day SMA line could be a challenging factor for buyers. In that case, a break above the general resistance with an immediate rebound below the mid Bollinger line could resume the existing trend towards the 134.00 area.
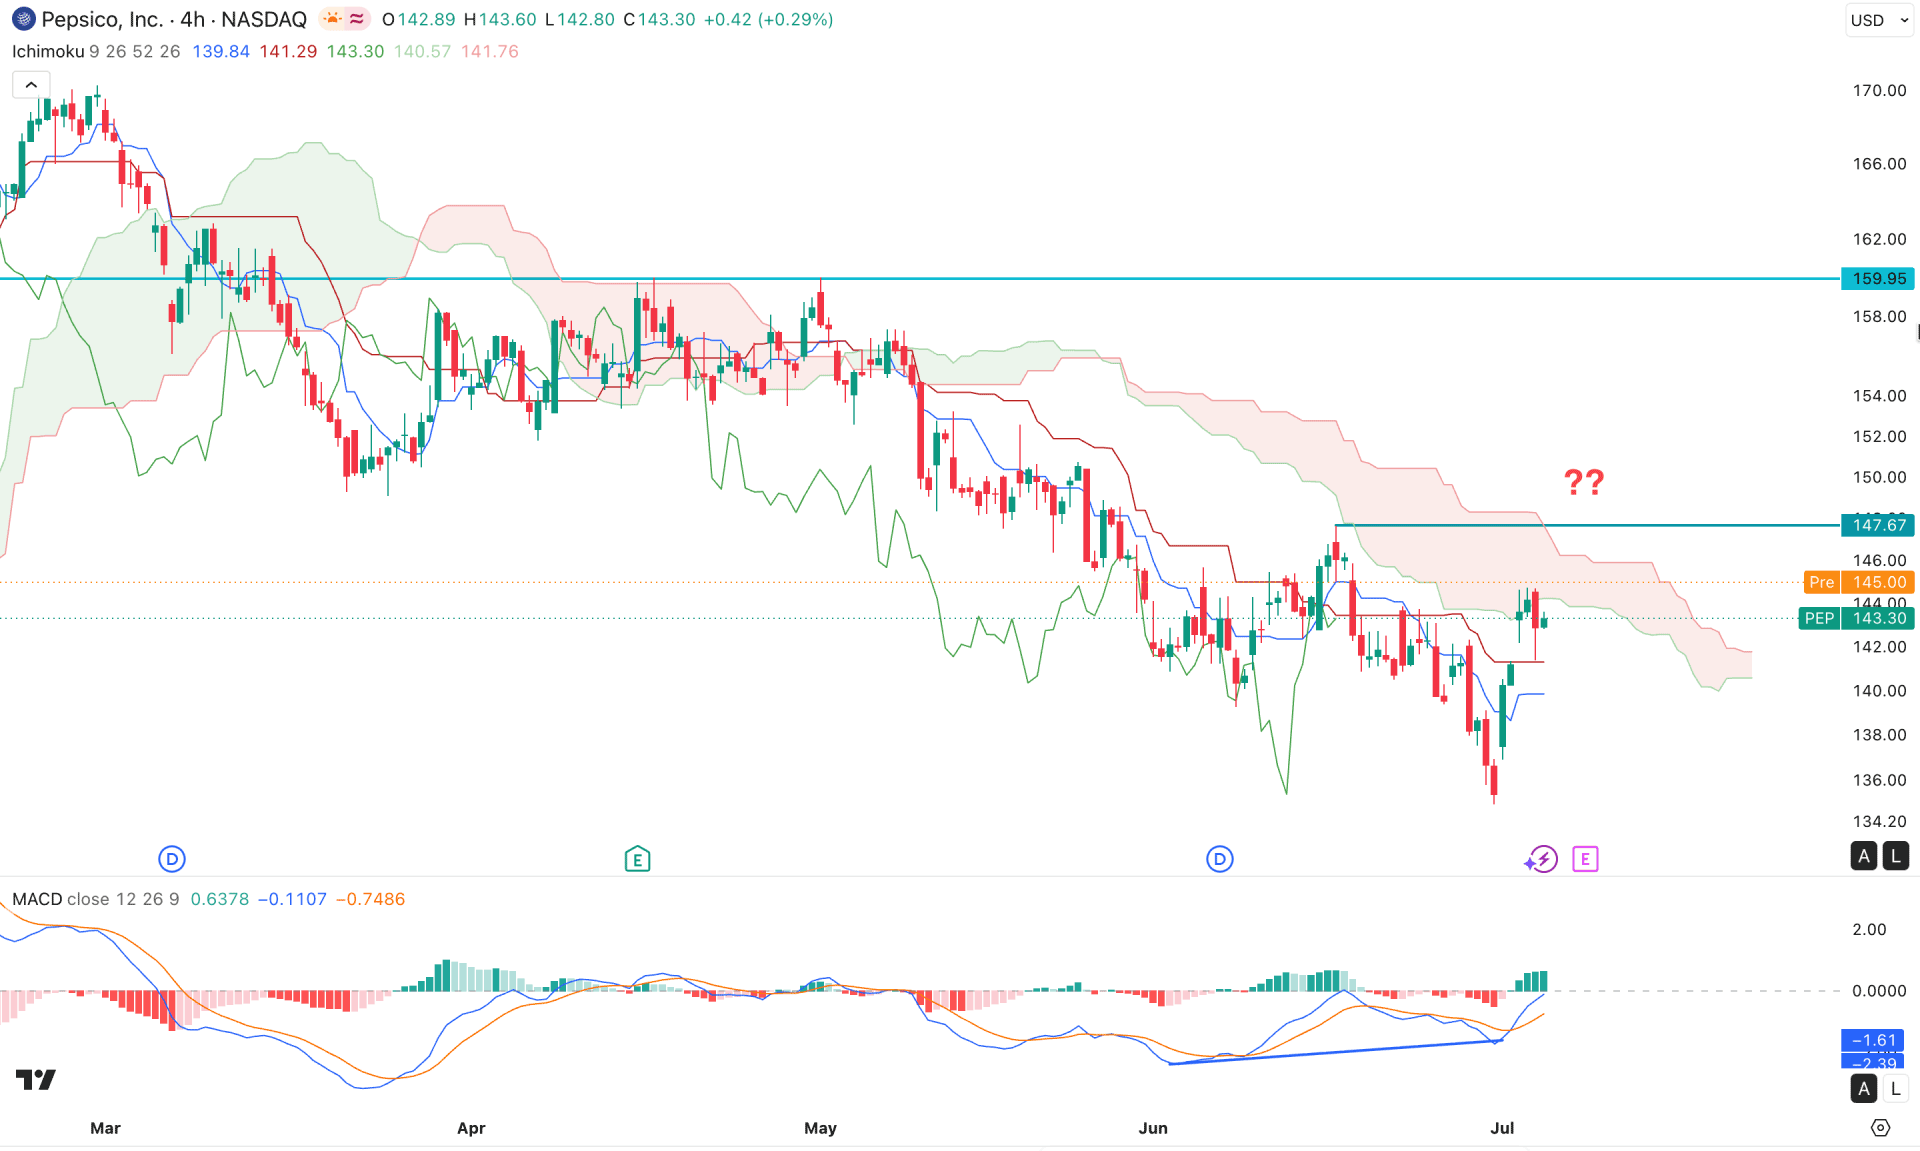
In the H4 chart of PEP, the recent price is trading below the resistance, signalling a bearish continuation. Moreover, the future cloud is bearish while the most recent future cloud line is flat. It is a sign of an existing bearish trend. A bullish recovery is also possible. In this context, investors should remain sceptical as proper validation is mandatory before opening any trade.
In the secondary indicator window, the MACD signal line has formed a divergence with the price swing, signalling a reversal of momentum. Moreover, the histogram is above the neutral level for a considerable time, which signals a buyer's presence in the market.
Based on the market structure, the price is facing a crucial resistance at the cloud area, while the 147.67 static swing high is a crucial level to look at. As long as the price remains below this level, downside continuation is highly possible. On the bearish side, a break below the Kijun level with a four-hour close could be a potential short opportunity targeting the 130.50 area.
On the other hand, a rebound with a four-hour close above the 147.67 level could validate a bullish recovery, which could open the room for testing the 159.95 level before moving beyond the 170.00 area.
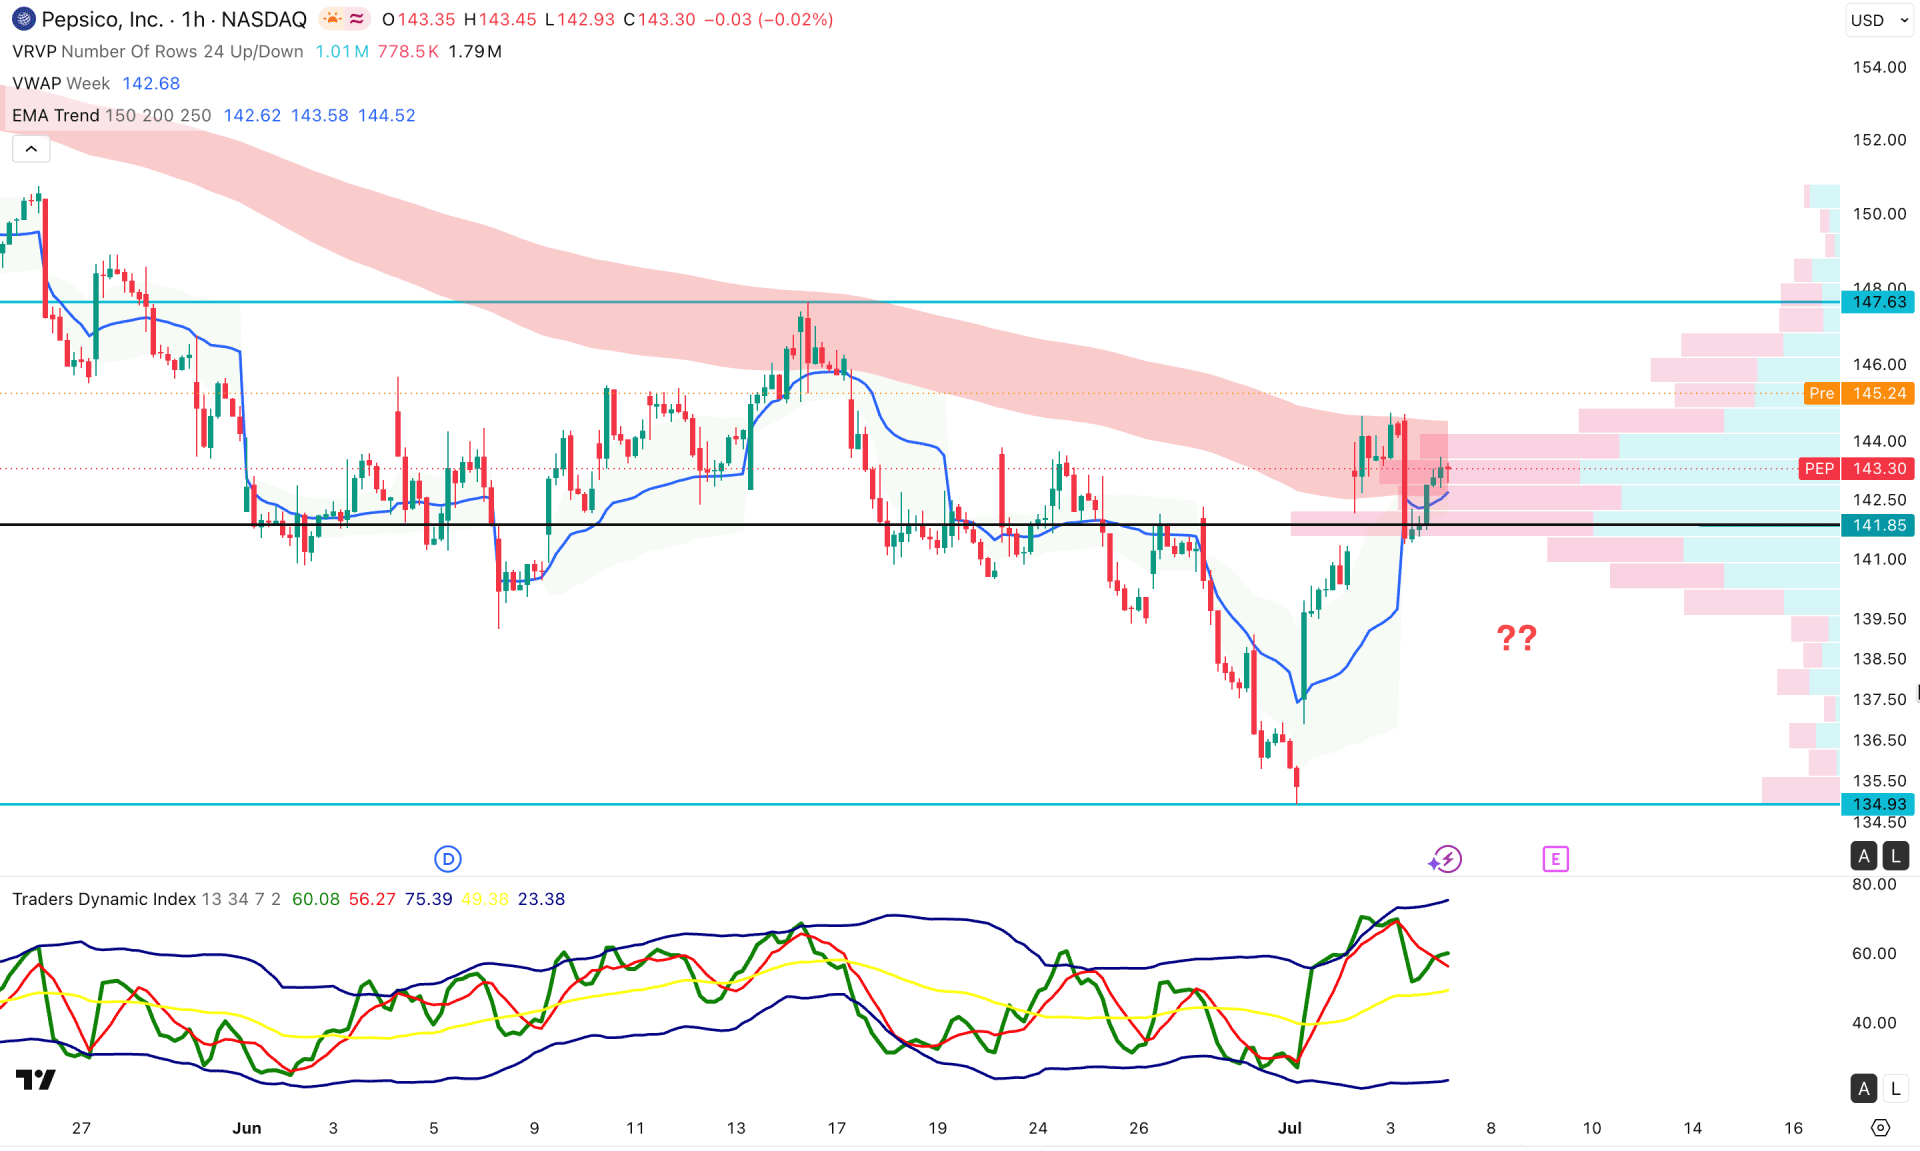
In the hourly timeframe, PepsiCo stock is trading in a neutral zone where the recent bullish recovery from 134.93 is not sufficient to consider a trend change. A resistance at the exponential moving average wave suggests a bearish rebound is possible. However, the recent bullish recovery with a stable price above the 141.85 resistance shows a counter-momentum within an early bullish breakout possibility.
The weekly VWAP level is closer to the current price and working as an immediate support, which is in line with the structure shown in the Traders Dynamic Index. The current TDI line is above the 50.00 neutral level, which signals ongoing buying pressure in the market.
Based on this market structure, investors should closely monitor how the price holds the buying pressure above the high line, where a bullish break above the 146.00 level could increase the possibility of testing the 156.00 area.
On the other hand, any immediate rebound below the 141.85 level could test the 134.93 area soon.
Based on the overall market structure, Pepsi stock is trading at a discounted price area, from where a corrective buying pressure is possible. The upcoming earnings report is a crucial factor to look at, where any better-than-expected earnings projection could boost the buying pressure at any time.


