
Published: February 22nd, 2023
Pepsi reported its quarterly financial results, which exceeded analysts' expectations due to increased snack and beverage prices.
The company experienced a 2% decline in volume globally as higher prices reduced consumer demand. To combat this, Pepsi intends to focus on "revenue management" to increase prices, anticipating persistent inflationary pressure in 2023.
The company's net sales grew by 10.9% to $28 billion, with organic revenue increasing by 14.6%, ignoring acquisitions and divestitures. However, demand for Pepsi products decreased during the quarter, with volume falling by 7% at Quaker Foods North America and by 2% at its North American beverage division.
One positive note was the 26% increase in volume for Pepsi Zero Sugar, which the company recently revamped to match the formula used in Western Europe. Pepsi plans to promote the product through two Super Bowl ads.
For 2023, Pepsi predicts a 6% increase in organic revenue and 8% growth in constant currency earnings per share. Wall Street analysts anticipate net sales growth of 3.5% and earnings per share growth of 7.3%.
Should you buy Pepsico stock (PEP) now? Let’s see the future price direction from teh Pepsico Stock (PEP) technical analysis:
A strong volatility is seen in the US stock market, but some stocks steadily increase even if indexes show an adverse situation. Pepsico stock is a crucial stock to look at, trading 5.44% higher from the 2023 low.
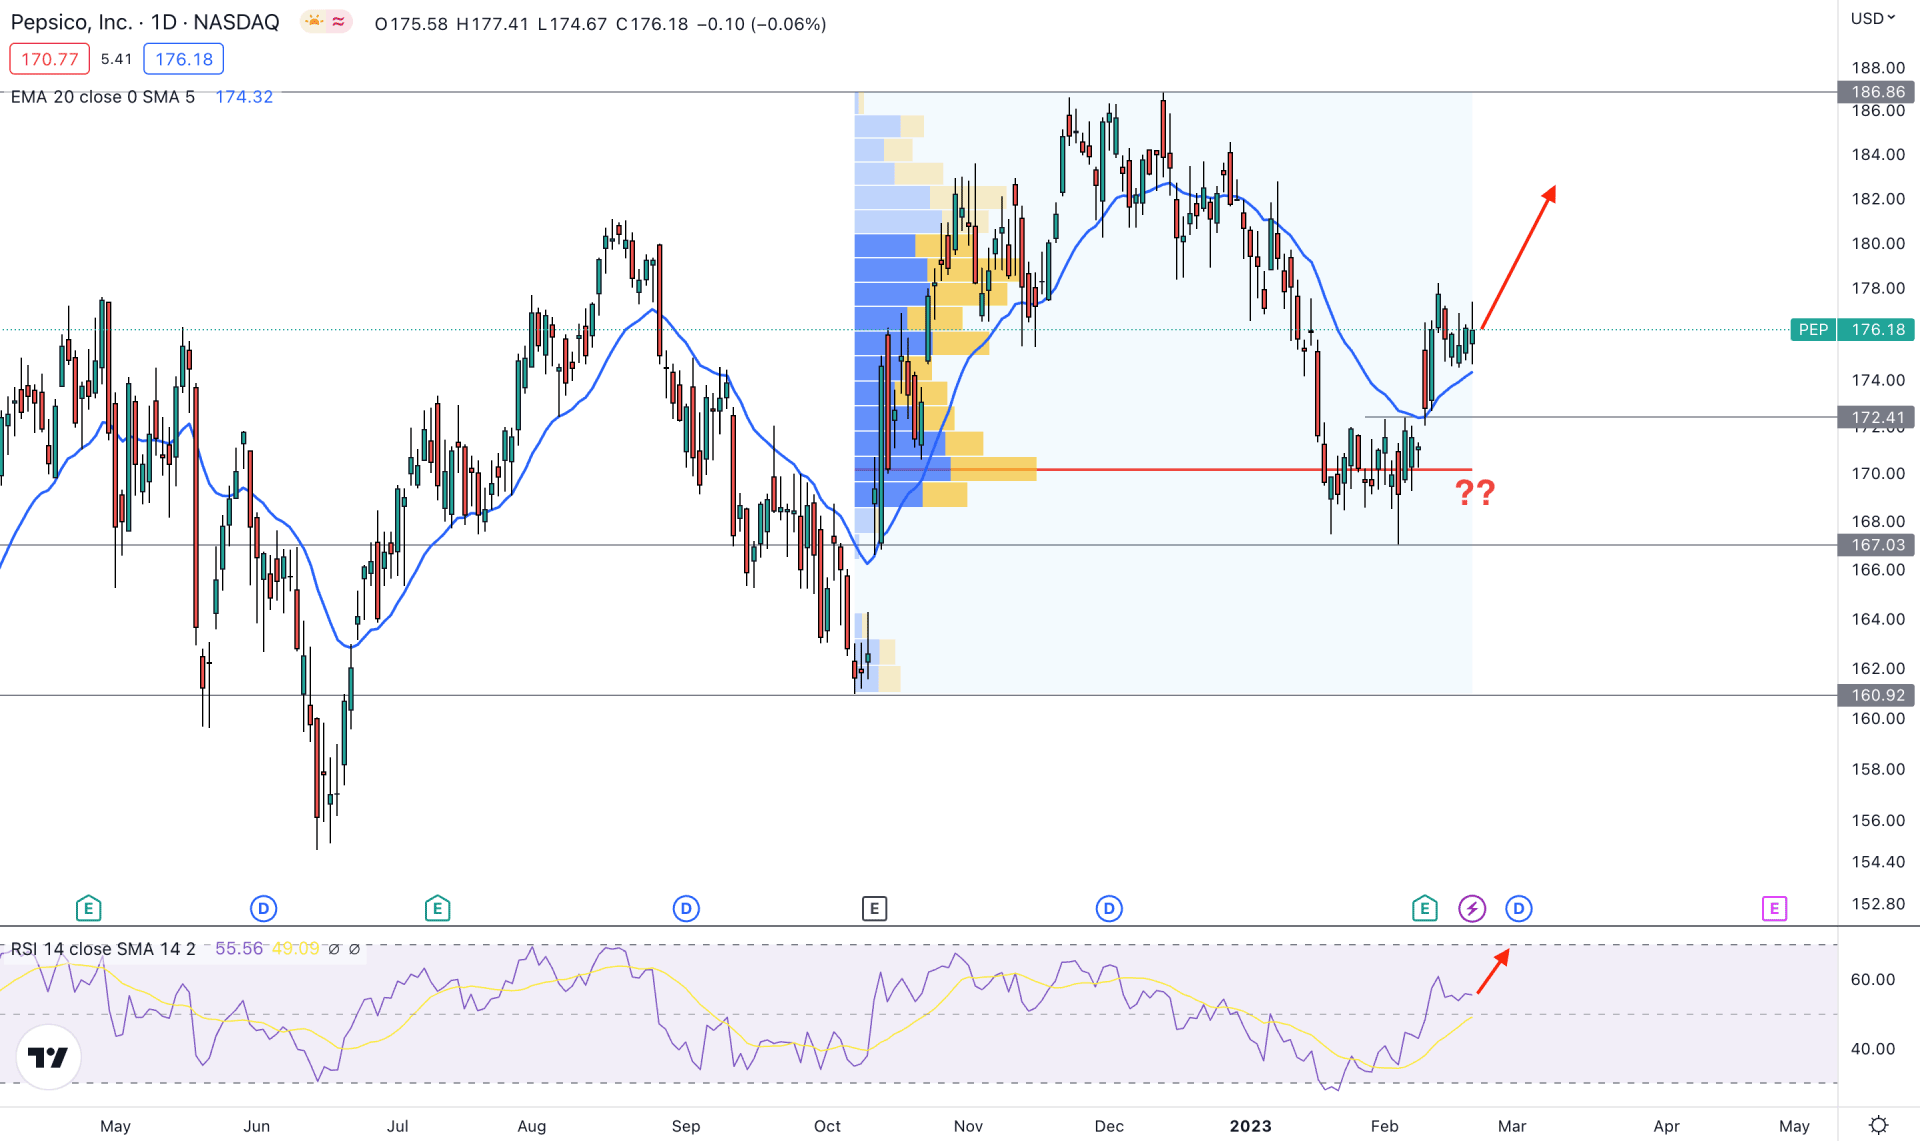
A strong institutional traders interest is visible in this stock as the current high volume level from October to February is spotted below the current price. The great accumulation and a stable price above the 172.41 event level is a sign that bulls are active in the market, and the price may increase at any time.
If we identify the tradable range, the 167.09 level would be a solid bottom from where the current buying pressure has come. On the upside, the critical resistance level is spotted at 186.86 level, which is 6.02% higher from the current price. Overall, the price is more likely to show a buying pressure as long as it remains above the 167.03 support level.
In the main price chart, a strong bullish momentum is visible from the dynamic 20 EMA. A valid bullish breakout and retest of the 20 DMA is visible. Moreover, the RSI is bullish above the 50.00 level, and aiming towards the overbought 70% area.
Based on the current price prediction, investors should consider the upcoming price direction as bullish as the dynamic 20 EMA is signaling short-term buyers presence in the market. In that case, the primary target of the bull run will be towards the 186.00 area.
A strong break below the 170.16 high volume level could eliminate the current bullish possibility by lowering the price towards the 165.00 level.
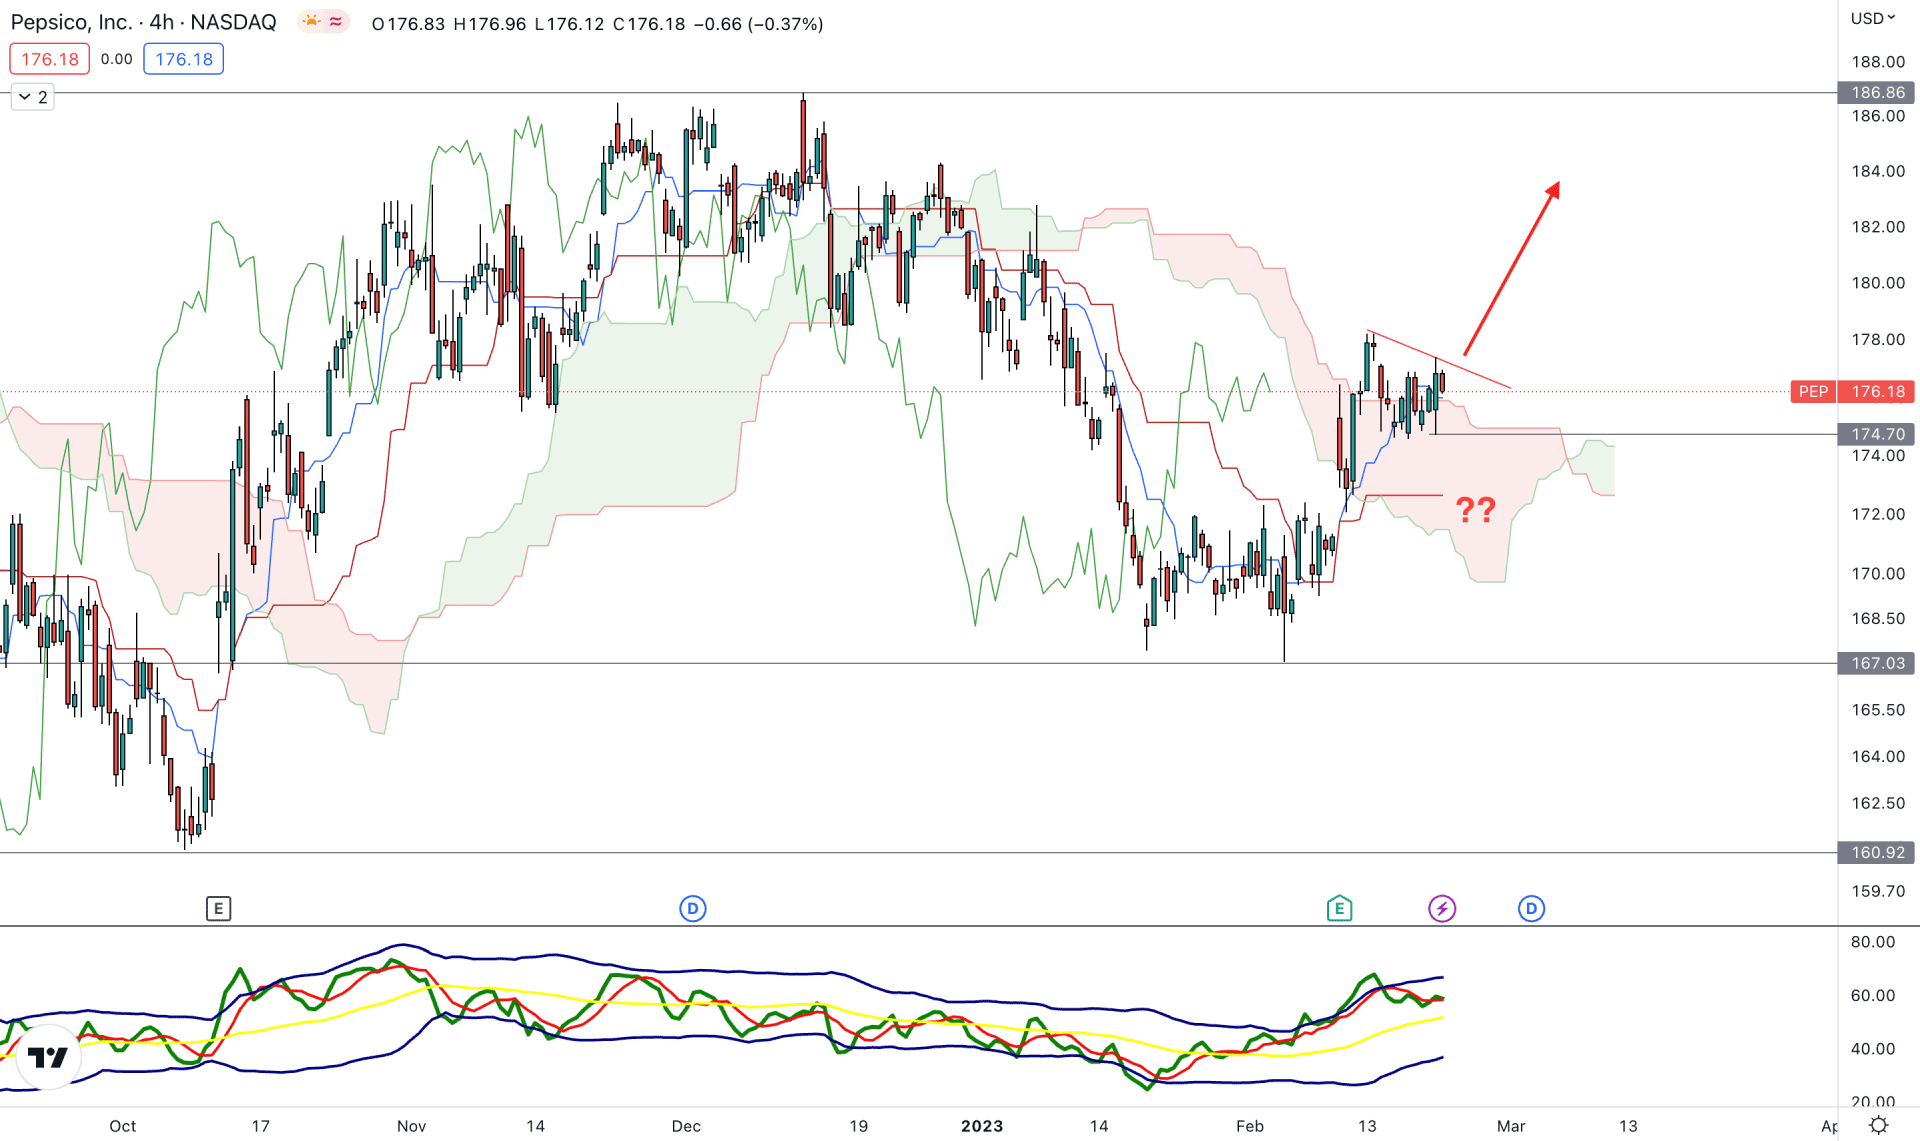
In the intraday chart, the current price trades above the dynamic Kumo Cloud support, but the price is very corrective above the cloud area. In that case, a new swing high must be formed before considering the buying pressure as valid.
The future cloud's price direction is still bullish as the Senkou Span A and B formed a bullish crossover.
In the indicator window, the current TDI level is above the 50.00 area, which indicates a strong buyers’ presence in the market.
Based on this outlook, a bullish trendline breakout with a H4 close above the 177.38 level could offer a long opportunity, where the main aim is to test the 186.00 level.
On the other hand, a sharp decline, with a daily candle close below the 170.00 psychological level, is needed before aiming for the 160.00 level.
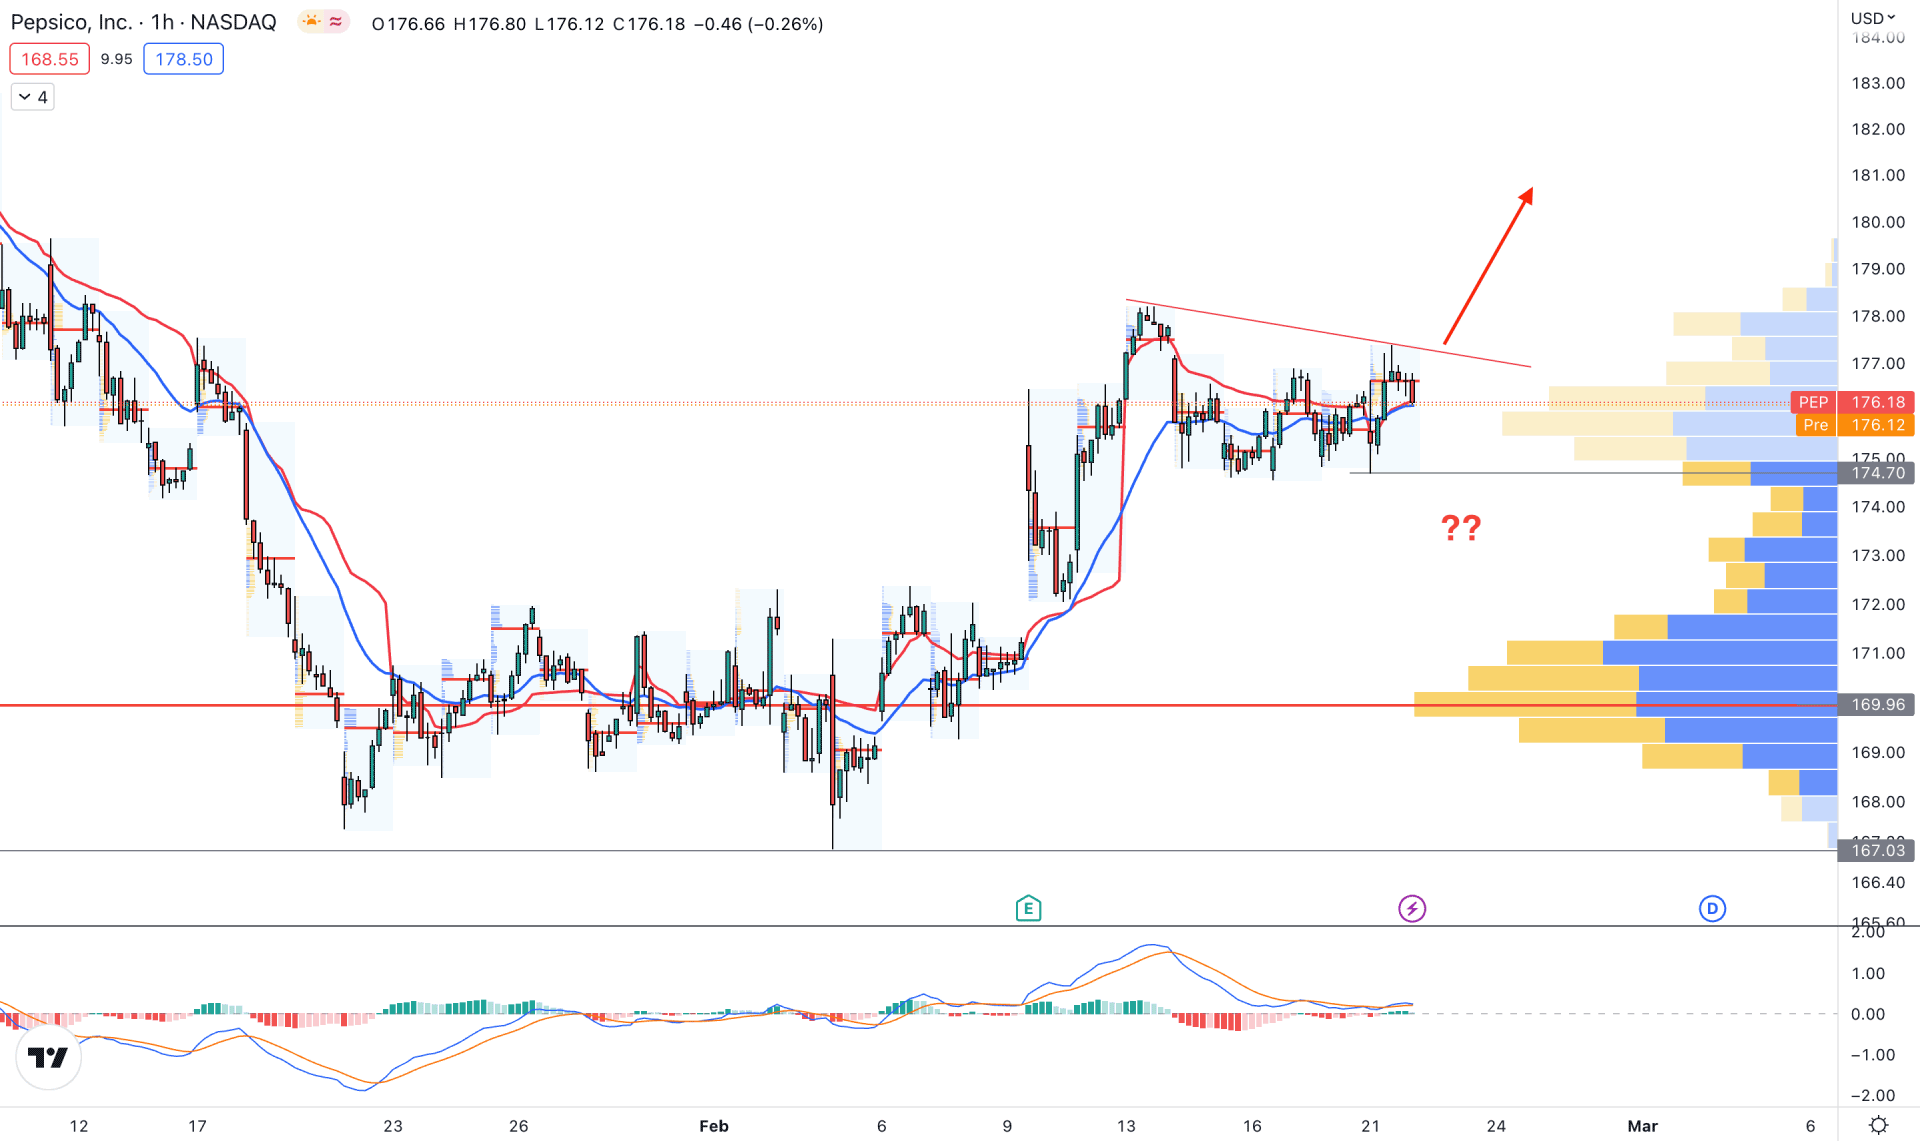
In the hourly chart, the price is stable above the visible range high volume level of 169.97. In that case, a bullish trendline breakout is valid for joining the possible buying pressure for the coming hours.
The dynamic 20 EMA and weekly VWAP are closer to the price, while the near-term support level is spotted at 174.70 level.
The MACD Histogram is corrective at the neutral zone, while MACD lines are above the 0.0 level.
Based on this structure, investors should monitor how the stock market opens. As the broader outlook is bearish due to rate hike possibilities, a lower price with a H1 close below the 174.00 level could create a downside pressure in this stock.
Based on the current price outlook, an intraday trendline breakout would offer a buying opportunity in this stock, which could resume the existing bullish trend.
On the other hand, a break below the daily high volume level could reverse the current market momentum and initiate a bearish trend.


