
Published: July 10th, 2024
PepsiCo, Inc. (PEP) is scheduled to release its results before the market opens on July 11. The current analysts estimate for Q2 revenue is $22.6 billion, representing a 1.2% increase from last year's quarter. The consensus for earnings is $2.16 per share, a 3.4% increase from the $2.09 reported in Q2 2023. It is important to note that these estimates have remained constant for the past 30 days.
PepsiCo exceeded earnings expectations by 5.9% in the previous quarter and has maintained an average earnings surprise of 5.1% over the past four quarters.
In particular, PepsiCo's performance is anticipated to be driven by its diverse portfolio, modernized supply chain, enhanced digital capabilities, flexible distribution systems, and strong consumer demand. Organic revenue growth is anticipated in all international units, with projections of 6% in Latin America and AMESA, 10% in Europe, and 8% in APAC.
In contrast, FLNA is anticipated to experience unchanged organic revenues for the quarter, while organic revenues are anticipated to decrease by 22% in QFNA and increase by only 1% in PBNA.
Year-to-date, PepsiCo's stock has declined by 3.2%, underperforming the Consumer Staples sector and the broader industry, which have grown by 1.7% and 0.6%, respectively.
Let's see the further aspects of this stock from the PEP technical analysis:
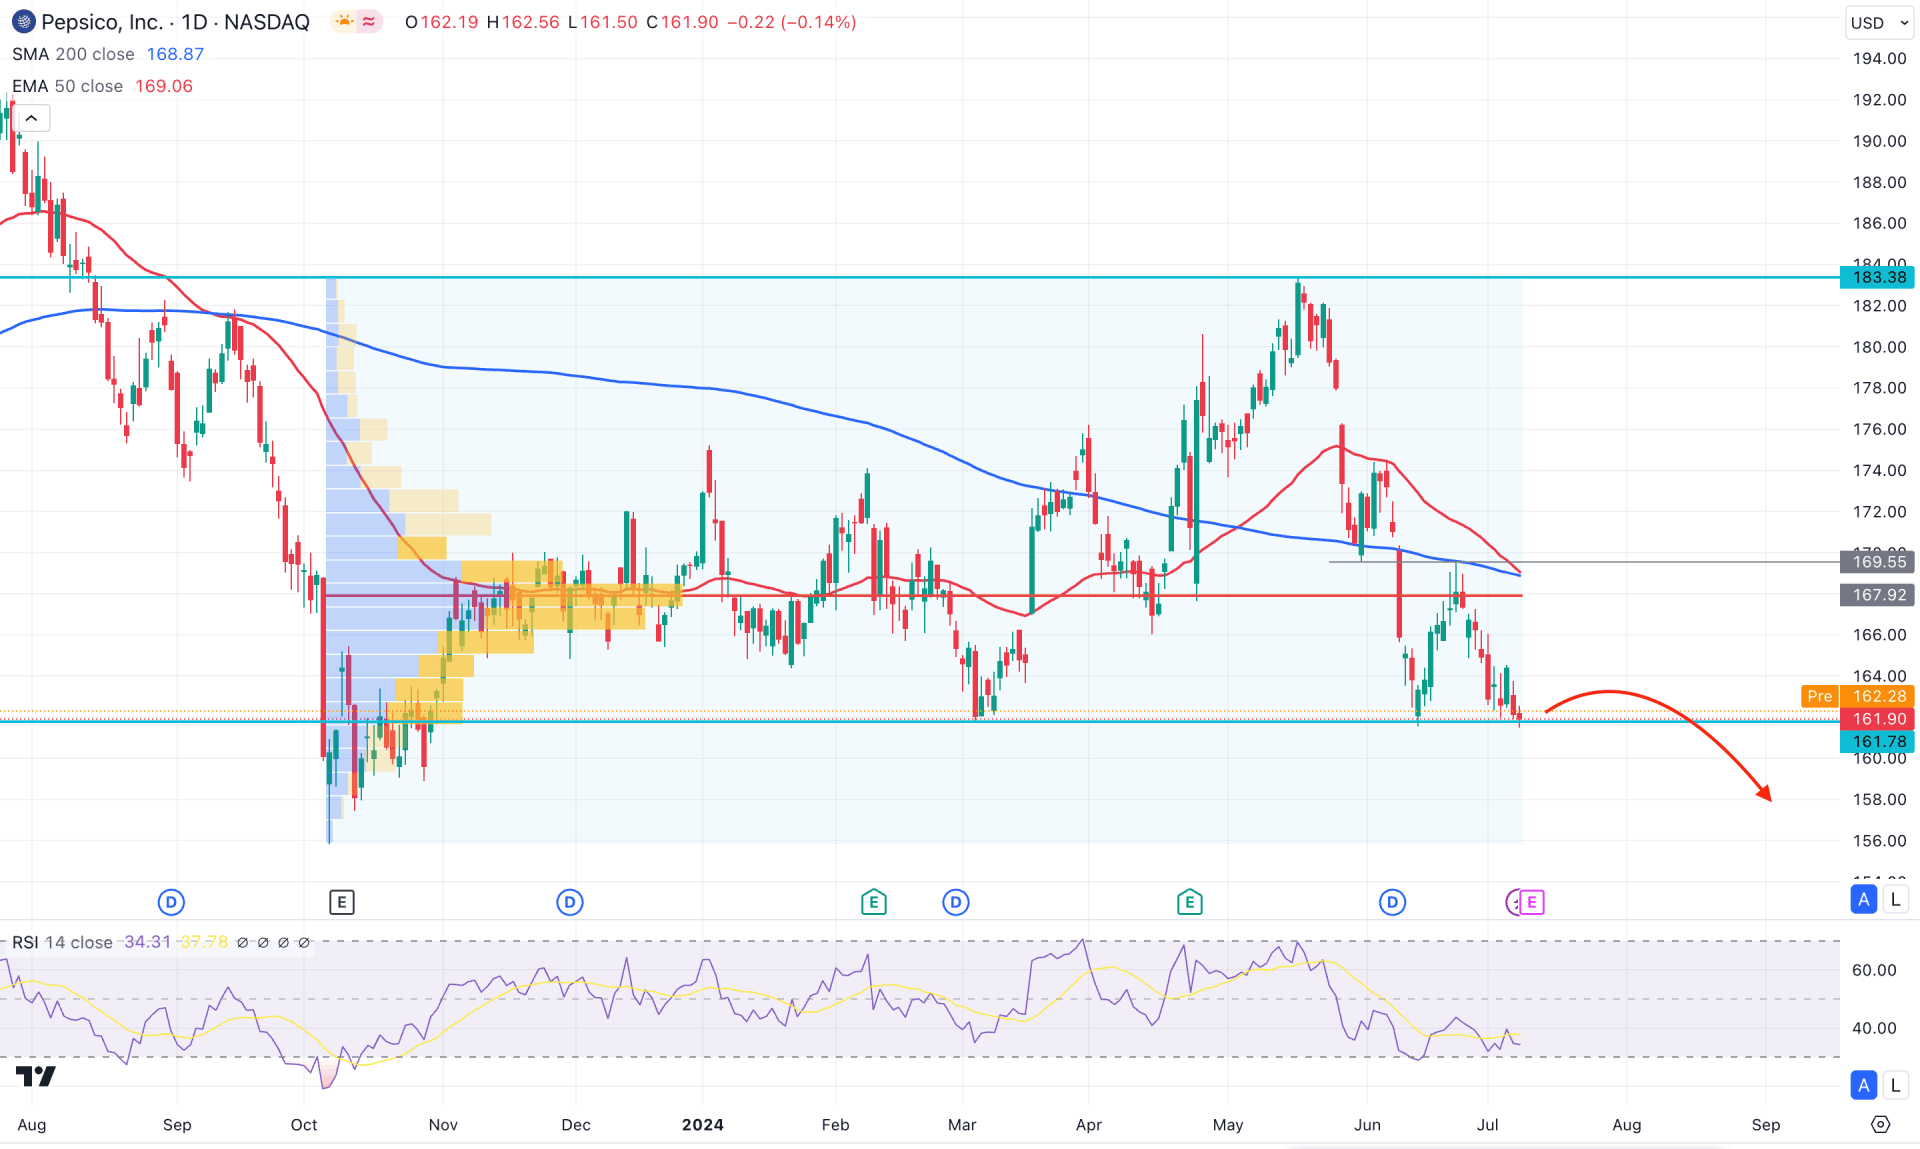
In the daily chart of PEP, the ongoing market momentum is bearish as the recent price hovers below the dynamic line. Although the 161.78 support level is still protected, the existing selling pressure is supported by the buy-side liquidity sweep from the 180.58 swing high.
In the higher timeframe, the ongoing corrective pressure is visible where the recent price hovers above the crucial bullish pennant support level. Moreover, the weekly price remained bearish, where a drop-base-drop formation could signal more downside pressure in the coming weeks.
In the volume structure, the highest activity level since October 2023 is above the current price, signaling a strong bears presence in the market. Moreover, the 200-day Simple Moving Average has a bearish slope at the high volume line, suggesting a confluence bearish signal. The 50-day Exponential Moving Average is also above the current price, where a successful break below the 200-day SMA could signal a death cross formation.
In the indicator window, the Relative Strength Index (RSI) hovers below the 50.00 line with a sideways momentum. It is a sign that a downside pressure is still present in the market, which may result in a downward continuation.
Based on the current market outlook of PEP, a bearish daily close below the 160.00 level could activate the Death Cross formation. In that case, the price is more likely to move down and reach the 146.76 event level.
On the bullish side, an upbeat earnings report with a stable market above the 169.55 swing high could invalidate the bearish possibility. In that case, a bullish opportunity might open, aiming for the 183.38 resistance level.
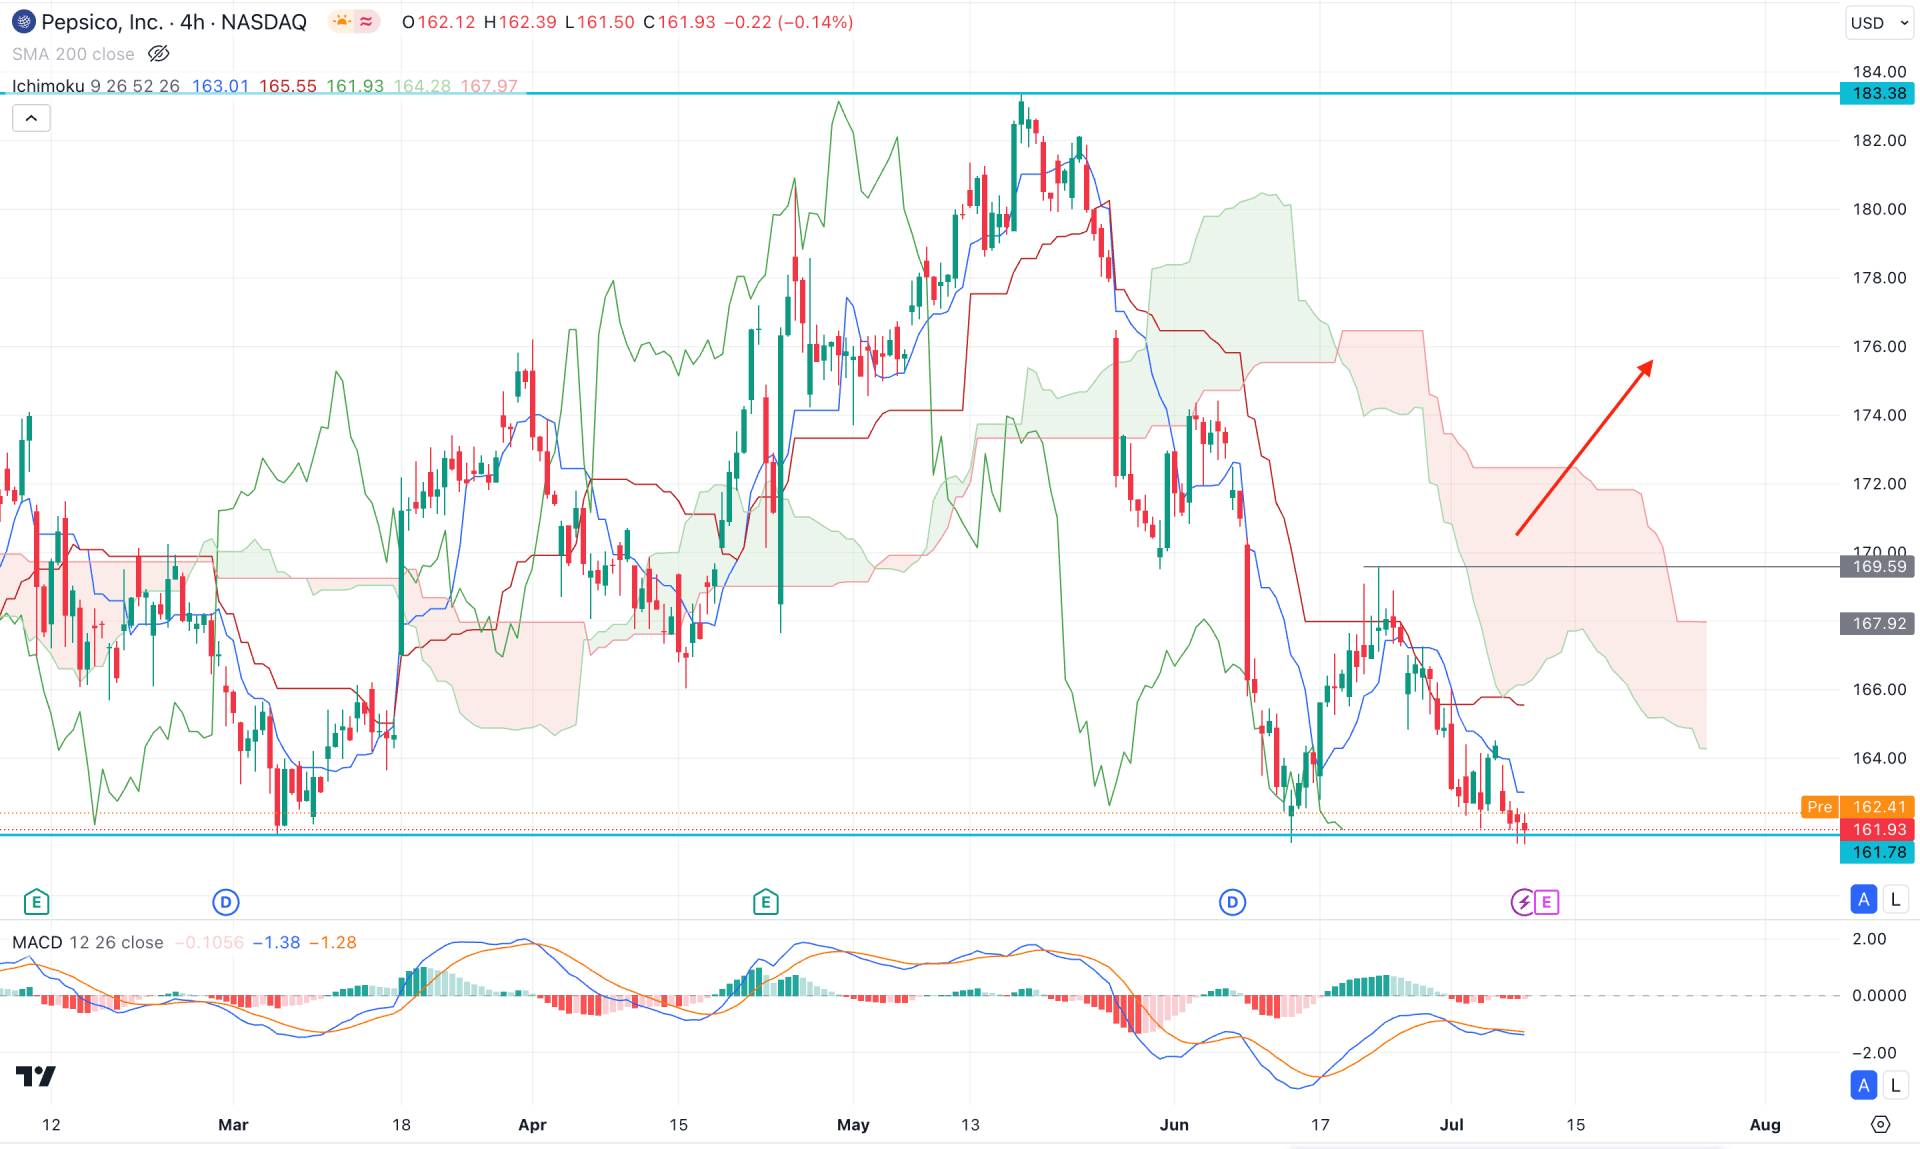
In the intraday chart of PEP, the recent price trades below the crucial dynamic Kijun Sen level, while the dynamic Cloud is working as a major resistance. Moreover, the Senkou Span A remains steady below the current price, suggesting a bearish trend continuation.
In the indicator window, the MACD Indicator remains sideways, while the signal line shows to buying pressure from the bearish zone.
In this context, a minor upward correction might happen, but a bearish reversal from the dynamic Kijun Sen line could open a bearish opportunity, targeting the 150.00 area.
The alternative approach is to look for a bullish reversal, which might be initiated after overcoming the 169.59 resistance level. A successful bullish daily candle above this line could open a long opportunity, aiming for the 180.00 psychological area.
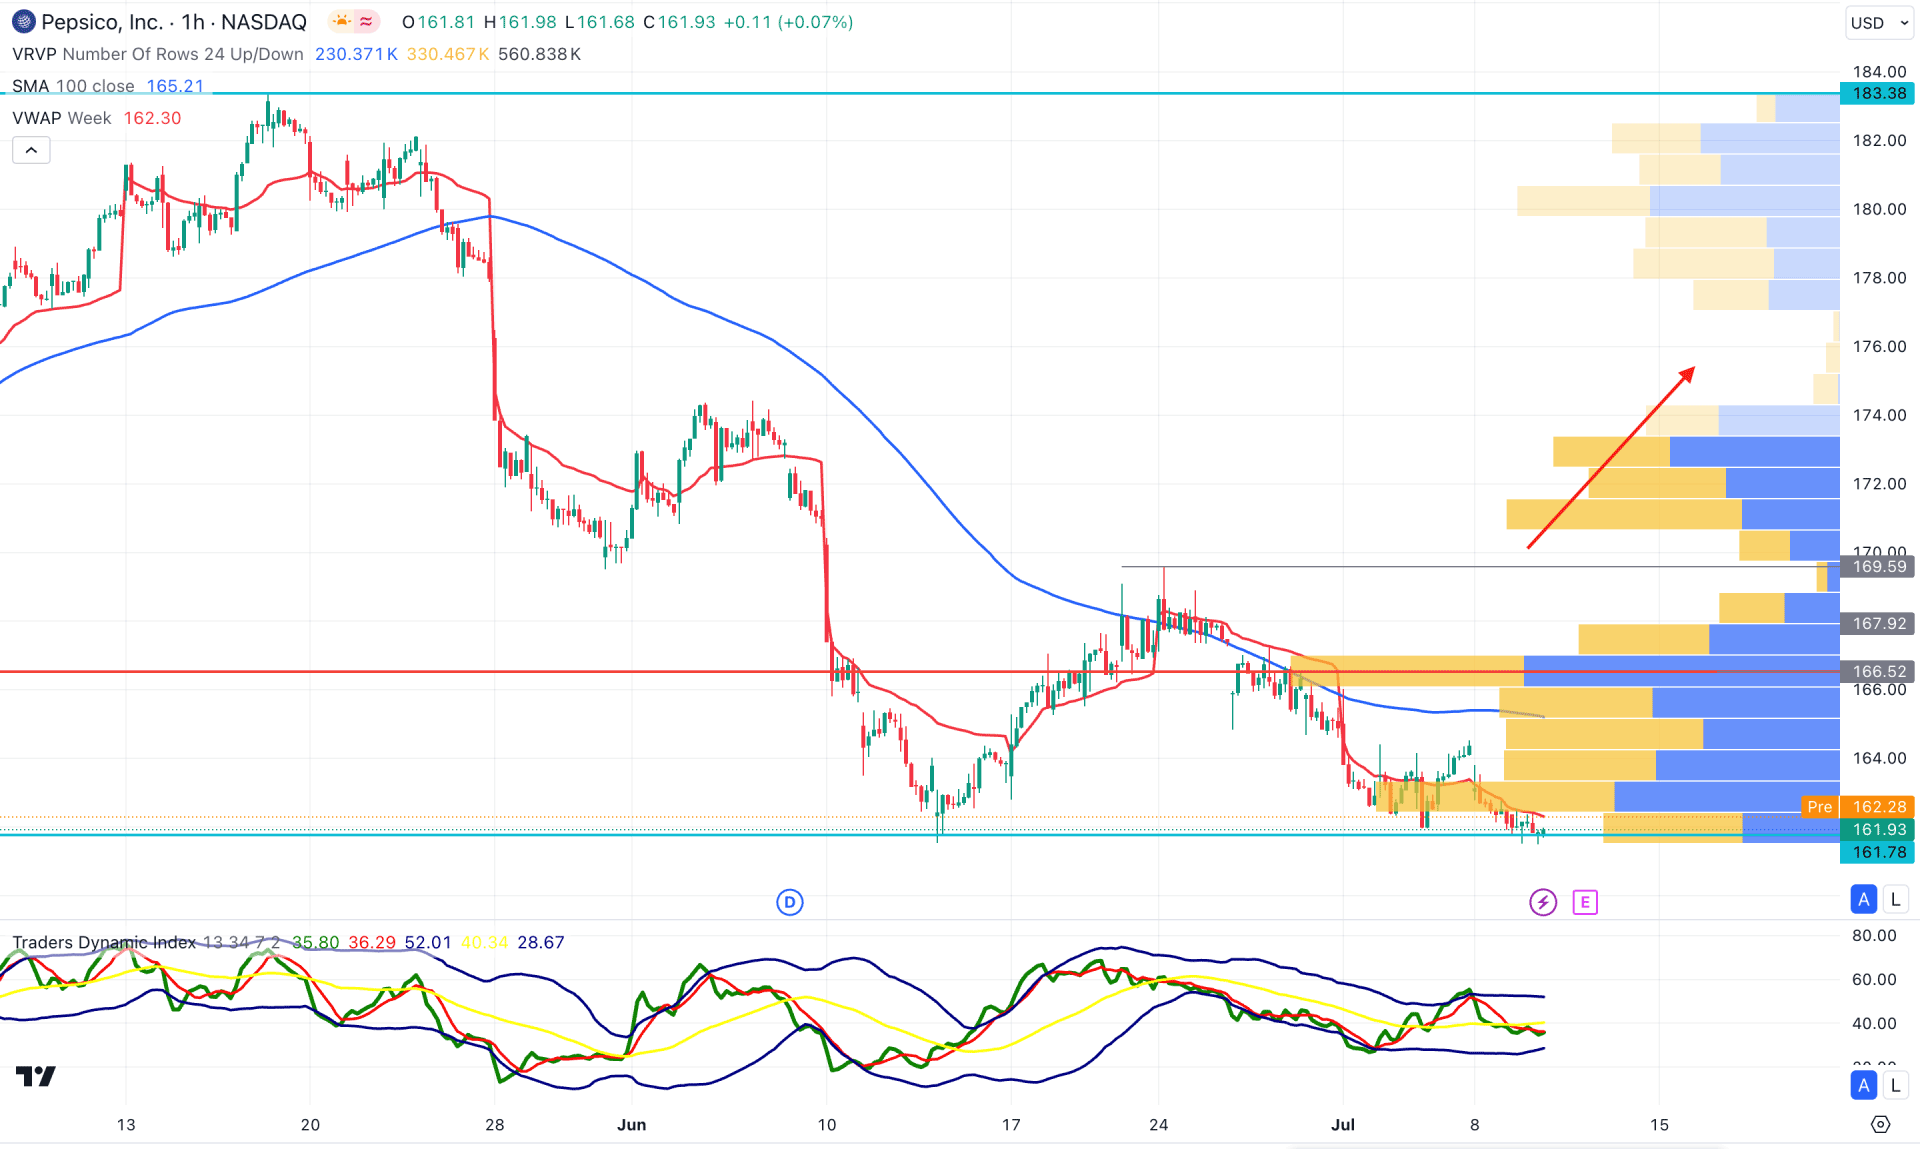
In the hourly timeframe, the recent price shows a corrective bearish pressure, where no sign of a bullish reversal is visible.
The visible range high volume line remains at the 166.52 level, while the dynamic 100-day SMA is acting as a resistance above the weekly VWAP level.
In the indicator window, the Traders Dynamic Index (TDI) remains sideways, but a failure to hold the upward pressure is visible.
Based on the hourly market structure, bullish exhaustion with a stable market above the 168.00 level could signal a bullish trend reversal. As the current price trades below the 100 SMA line, we may expect the downside pressure to extend below the 160.00 level.
Based on the current market structure, PEP is more likely to extend the buying pressure once a valid bullish reversal comes above the H4 Kumo Cloud zone. As of now, a downtrend is visible, which might extend below the 150.00 psychological level.


