Published: March 30th, 2023
PBF Energy's earnings per share (EPS) has increased by 103% annually over the past three years, resulting in a price increase for the company's stock. Notably, the average annual increase in share price is 95%, which is close to the EPS growth rate. This indicates that the market sentiment surrounding the company has remained relatively stable and that the share price has reflected the EPS growth during this time period.
TSR evaluates the value of spin-offs, discounted capital raises, and dividends, assuming dividends are reinvested. It is crucial to differentiate between share price return and total shareholder return when evaluating investment returns (TSR).
Frequently, the TSRs of dividend-paying companies are greater than their share price returns. The three-year TSR for PBF Energy was 648 percent, which is greater than the previously mentioned share price return. This is due to the company's dividend payments, which have helped to increase the total shareholder return.
In the past year, PBF Energy shareholders have received a total return of 83%, including dividends. This increase exceeds the average annual TSR over the past five years, which is 7%.
Therefore, it appears that recent sentiment surrounding the company has been favorable. Given the continued strong momentum in the share price, examining the stock more closely may be prudent so as not to miss an opportunity.
Let’s see the future price projection from the PBF Energy Stock (NYSE: PBF) technical analysis:
PBF is enjoying strong bullish momentum in the higher timeframe price action, as shown in the weekly chart. The solid fundamental and daily price structure supports the weekly and monthly price action, where any bullish opportunity could work well.
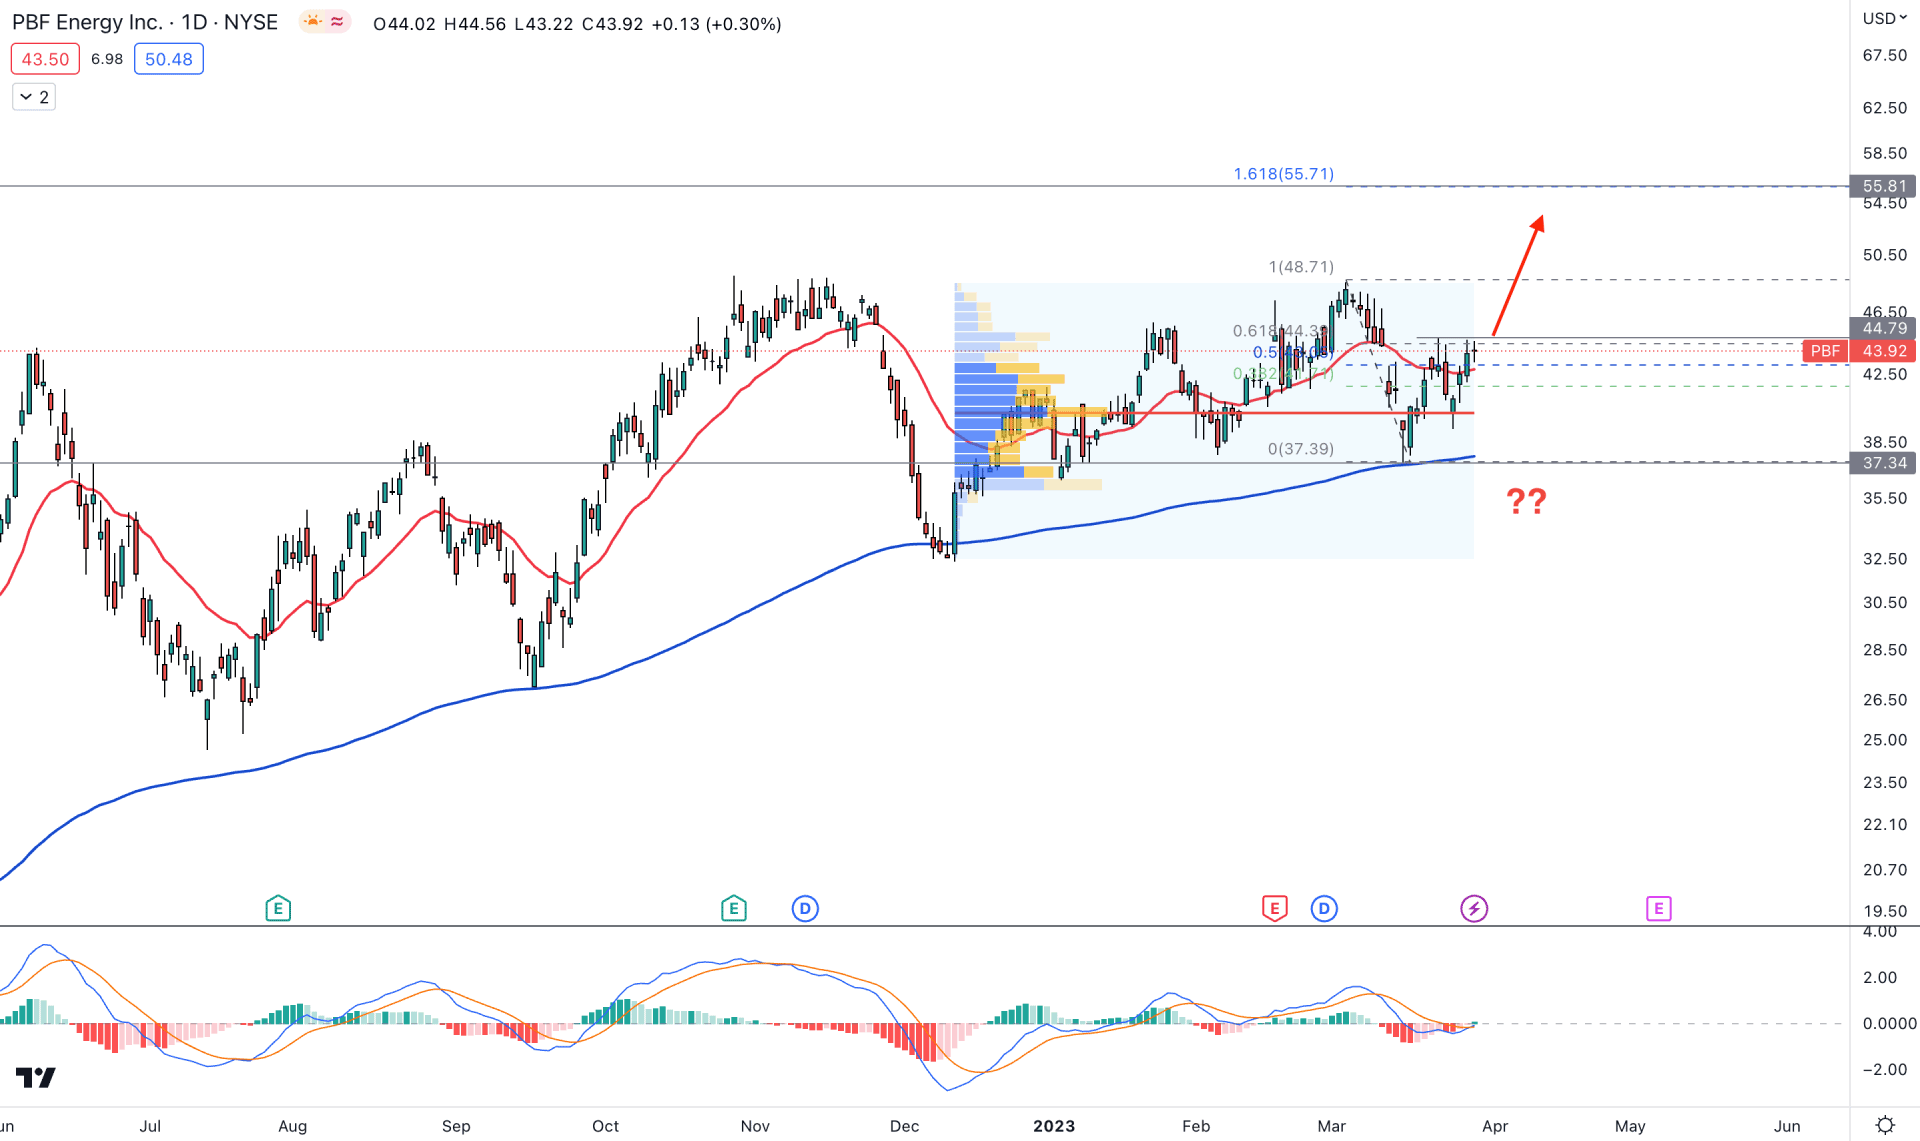
In the daily chart, the current market momentum is solid to bulls, as shown by the dynamic 100-day SMA. The current dynamic level is stable and aiming higher by providing confluence support to the daily trend. Moreover, the dynamic 20-day EMA is above 100 SMA, which is a sign of short buyers' accumulation in the market.
In the most recent chart, the immediate internal structure break above the 45.89 swing high signifies a potential bullish continuation opportunity. Moreover, the current price shows a buying pressure above the dynamic 20 EMA after forming a bottom at the 37.34 level. Therefore, as long as the price trades above the 37.34 level, we may expect the bullish pressure to extend.
On the other hand, the highest trading volume since 12 December 2022 is spotted at the 40.15 level, which is below the current price. It is a sign that bulls are still interested in instruments.
The indicator window also shows a bullish opportunity as the current MACD EMAs prepare for a bullish crossover at the neutral zone. Moreover, the Histogram turned positive from the neutral area.
Based on the daily outlook, investors should wait for the price to have a daily candle close above the 44.79 level, which could validate the bullish structure break. In that case, a buying opportunity would be open, targeting the 50.00 level.
The alternative approach is to wait for the price to come below the 37.34 level before initiating a deeper consolidation.
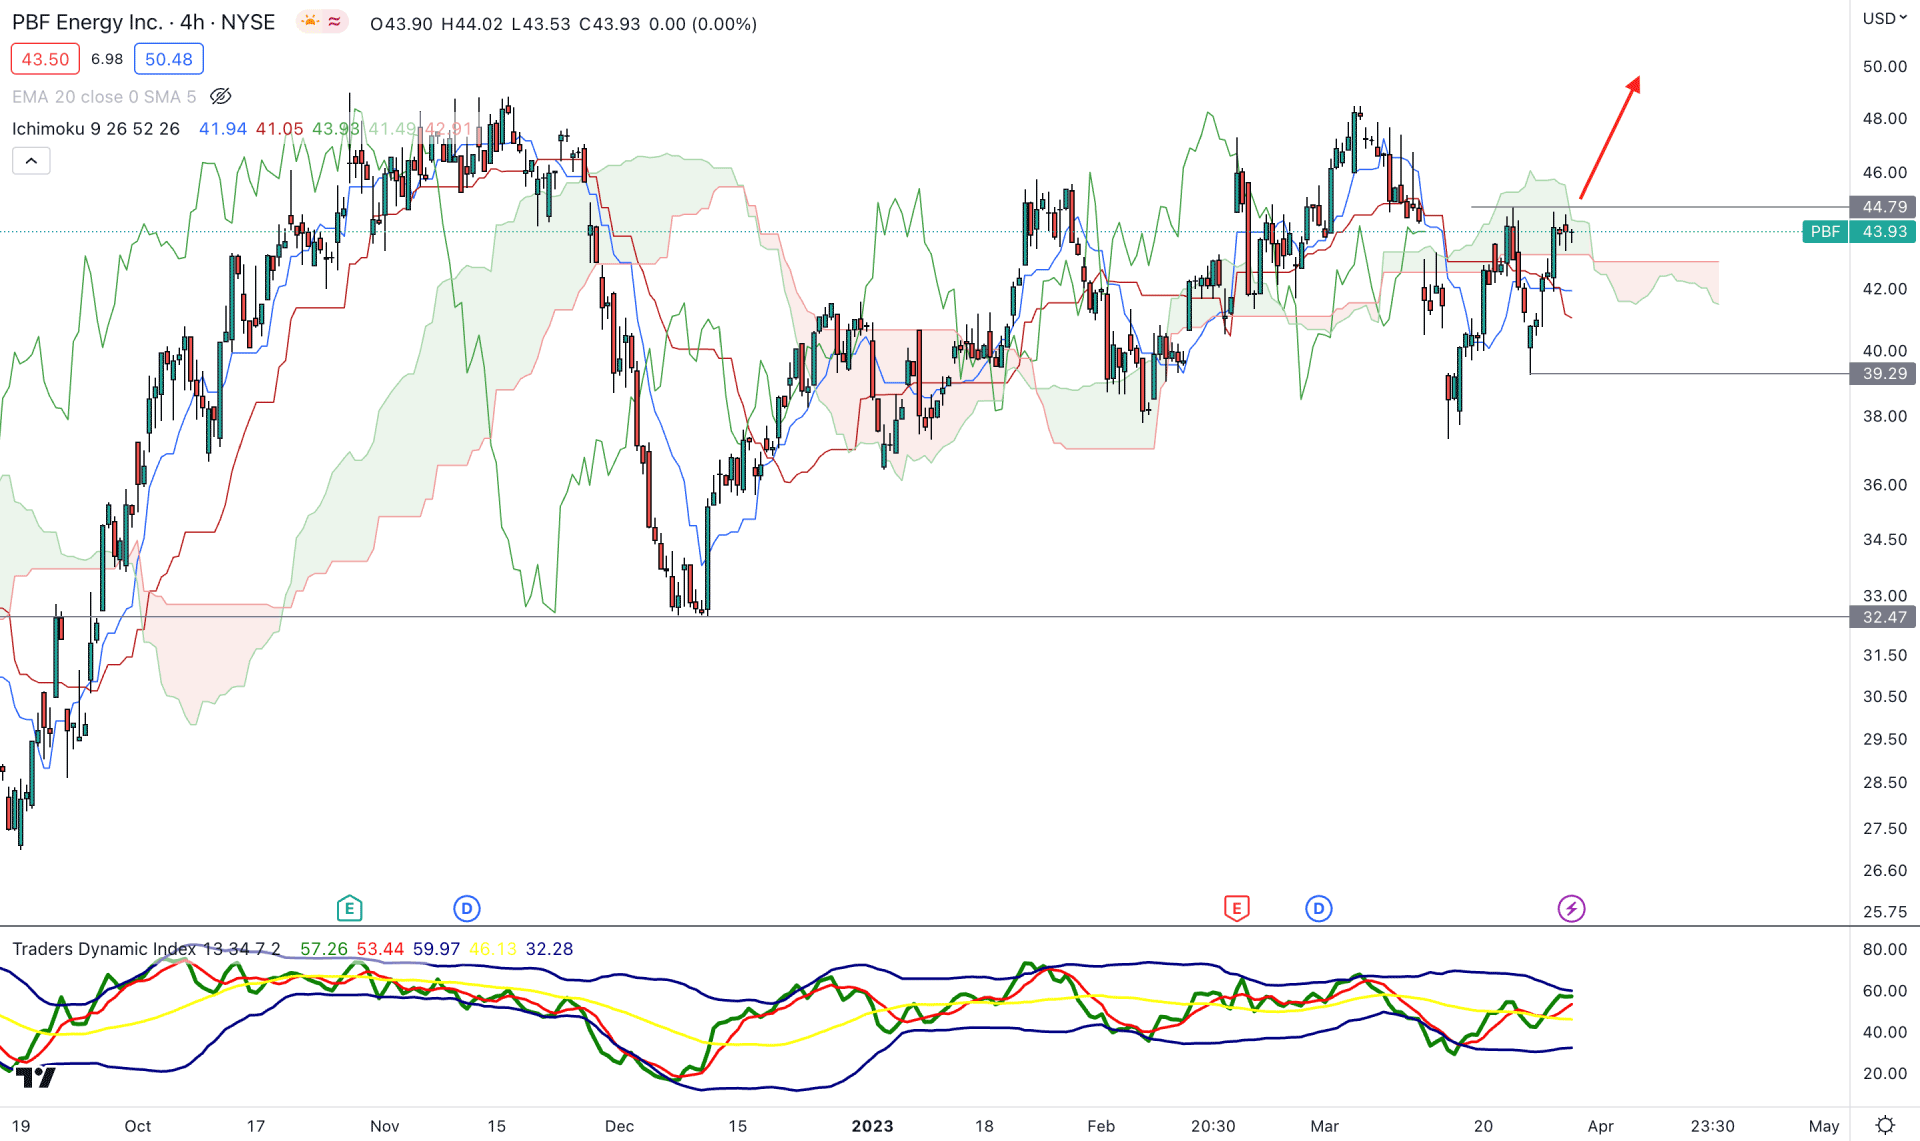
In the H4 chart, the Ichimoku Cloud shows a corrective structure as the current price is within the Kumo Cloud. Moreover, the future cloud shows a bearish possibility as the Senkou Span A is Below B, while the lagging span is closer to the current price.
The dynamic Tenkan Sen moved below the Kijun Sen even if the price exceeded these levels. It is a sign that an extensive correction is activated, indicating a breakout.
Based on the H4 structure, a bullish break and an H4 close above the Kumo Cloud will provide the primary sign of buying pressure, targeting the psychological 50.00 level.
On the other hand, the current Future Cloud’s structure is bearish, and a stable bearish break below the 39.29 swing low could initiate a bearish possibility towards the 30.00 area.
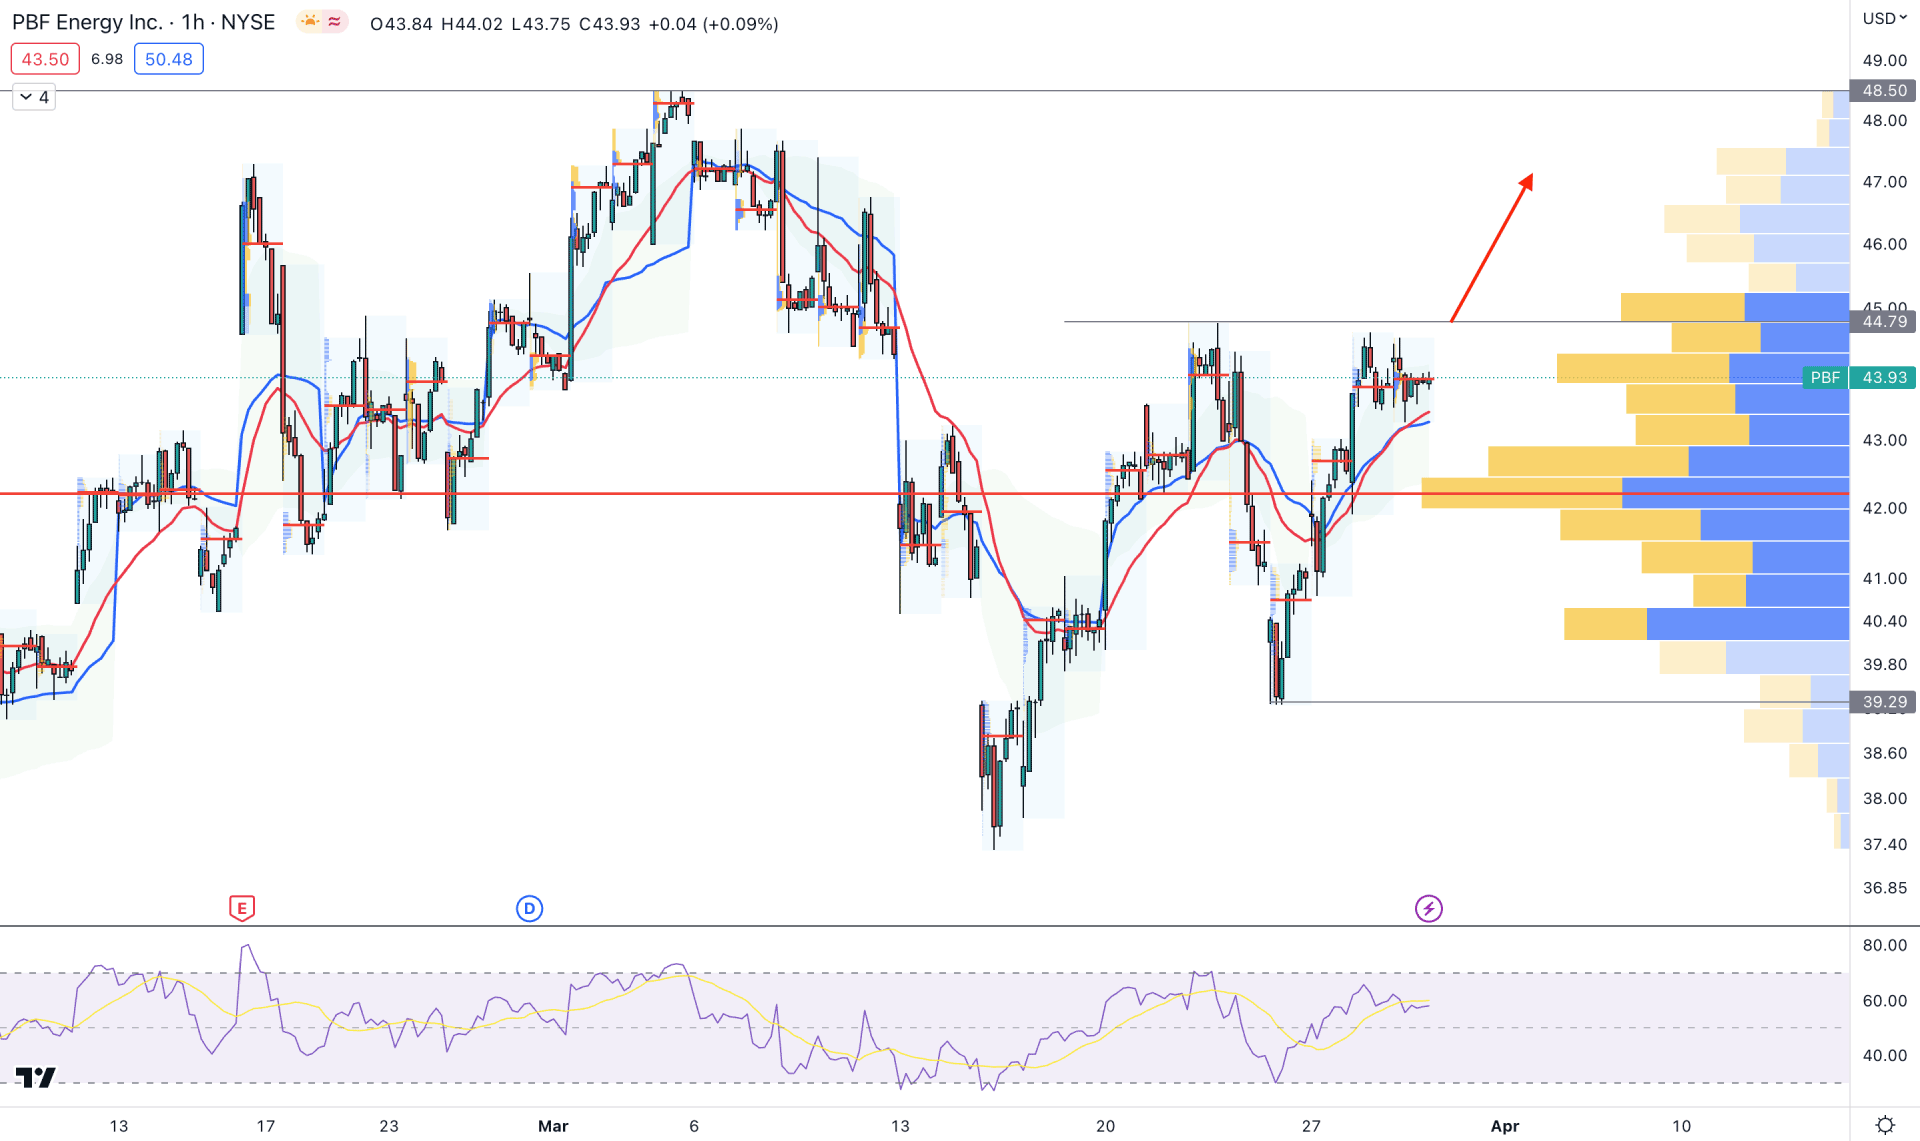
In the H1 chart, the broader outlook is bullish as the most recent price is at the resistance level after forming a V-shape recovery. Although the currently visible range high volume level is closer to the price, the immediate recovery from the 39.29 level is a valid reason to rely on the buyers’ side.
The RSI is also above the neutral 50.00 line, while the current dynamic 20 EMA and VWAP are below the current price.
Based on this behavior, investors might expect a bullish trend continuation opportunity if a daily candle closes above the 44.79 near-term resistance level. However, breaking below the 42.00 level would increase the possibility of testing the 38.00 area.
Based on the current market structure, PBF stock is trading within a strong bullish trend, and investors might expect the price to increase in the coming days. Therefore, any intraday bullish opportunity from the H4 breakout could offer a high probable buying opportunity.


