Published: December 20th, 2022
If you are seeking a terrific growth stock that is less susceptible to volatile price swings, consider PayPal (PYPL -0.45%). Shares of the payment processing giant are trading for just 17.1 times forward-looking earnings expectations after declining by 77.6% from the 2021 peak.
From one year to the next, the current valuation of PayPal is pleasant for a business expected to grow by a mid-single-digit percentage. That hardly ridicules the immediate future of the company or its past. The total payment proceeding volume of PayPal has gained by 25% compound annual growth rate since 2015.
The recent Covid pandemic led the company to invest more than it should have. In 2023, management expects adjusted earnings to increase by 15%, with help from more recently instituted cost-cutting measures.
PayPal added around 2.9 million net new accounts in Q3, bringing the total to 432 million. It also gets older accounts to raise their usage. Over the past twelve months, it recorded over 50.1 transactions per account, 13.1% more than the previous year's record. Investors who purchase some shares of PayPal now and hold on, over the long run, have decent chances to come out miles ahead, as it has an operation firing on all cylinders.
Despite the fundamental bullishness this instrument is trading at a discounted price from where a decent upside pressure may come.
Let’s see the future price of PYPL from the PayPal Stock (PYPL) technical analysis:
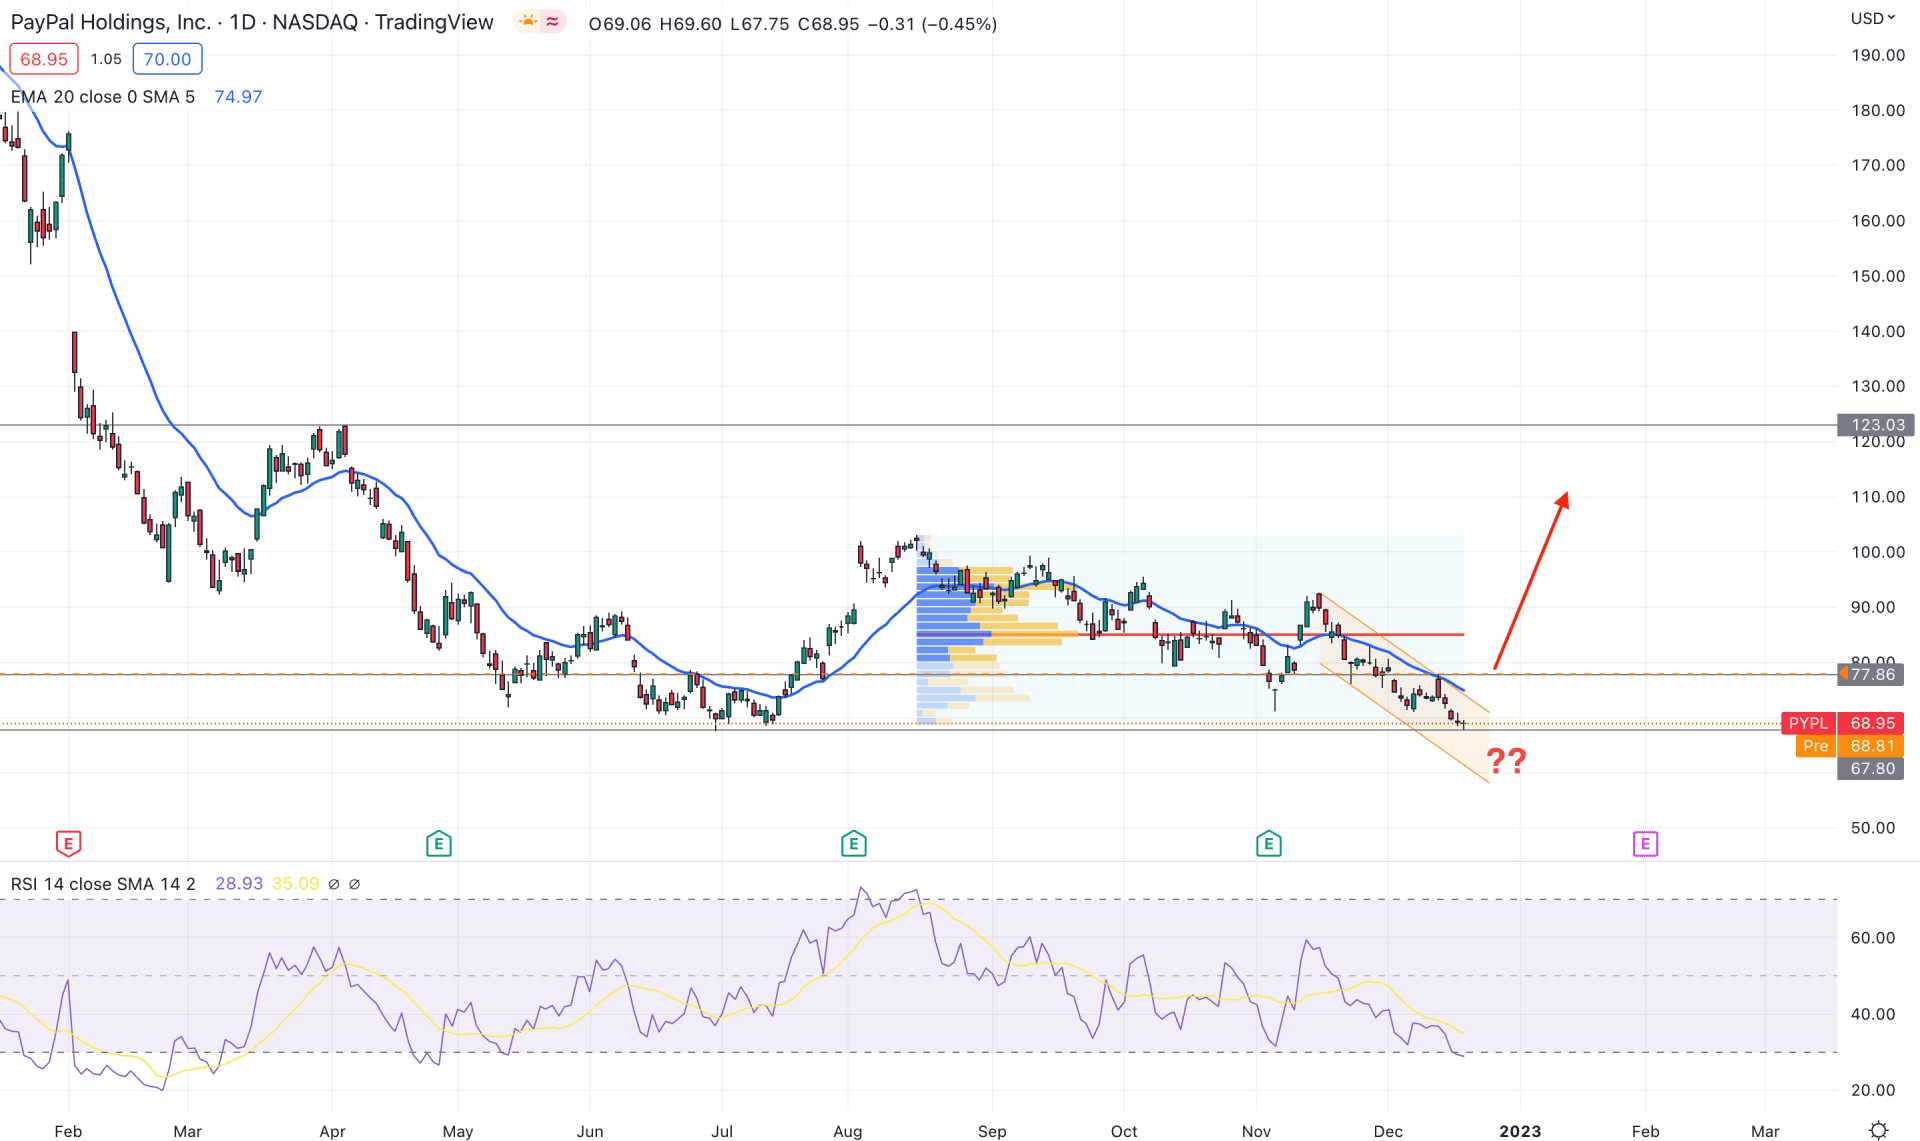
In the daily chart, it is clearly visible that the current price is trading at a discounted level from the 2022 opening. Therefore, the primary aim of this stock would be to look for long opportunities to grab a higher return. In that case, finding some buyers' presence is important.
In the most recent chart, the price is bottoming at the 67.80 level, which is the immediate horizontal support level. As the current price is trading above this level and bullish rejection would provide a long opportunity in this instrument.
Based on the visible range high volume level from the August high to December low, the current price is trading below it with a corrective momentum. In that case, an upside possibility is potent as a mean reversion but more confirmations are needed to consider it a trend change.
The dynamic 20-day Exponential Moving Average is above the current price and working as a resistance level. Moreover, the Relative Strength Index (RSI) is in a bearish zone, below the 30% oversold area.
Based on the daily price outlook of the PYPL, bulls should wait for a strong recovery above the dynamic 20-day EMA before finding a long opportunity targeting the 123.03 level. Moreover, a bearish liquidity grab from the July 2022 low and an immediate bullish recovery could offer another long opportunity.
On the bearish side, a minor upside pressure and a bearish rejection from the 69.00 to 79.00 area could offer a short opportunity, where the main aim is to test the 50.00 psychological level.
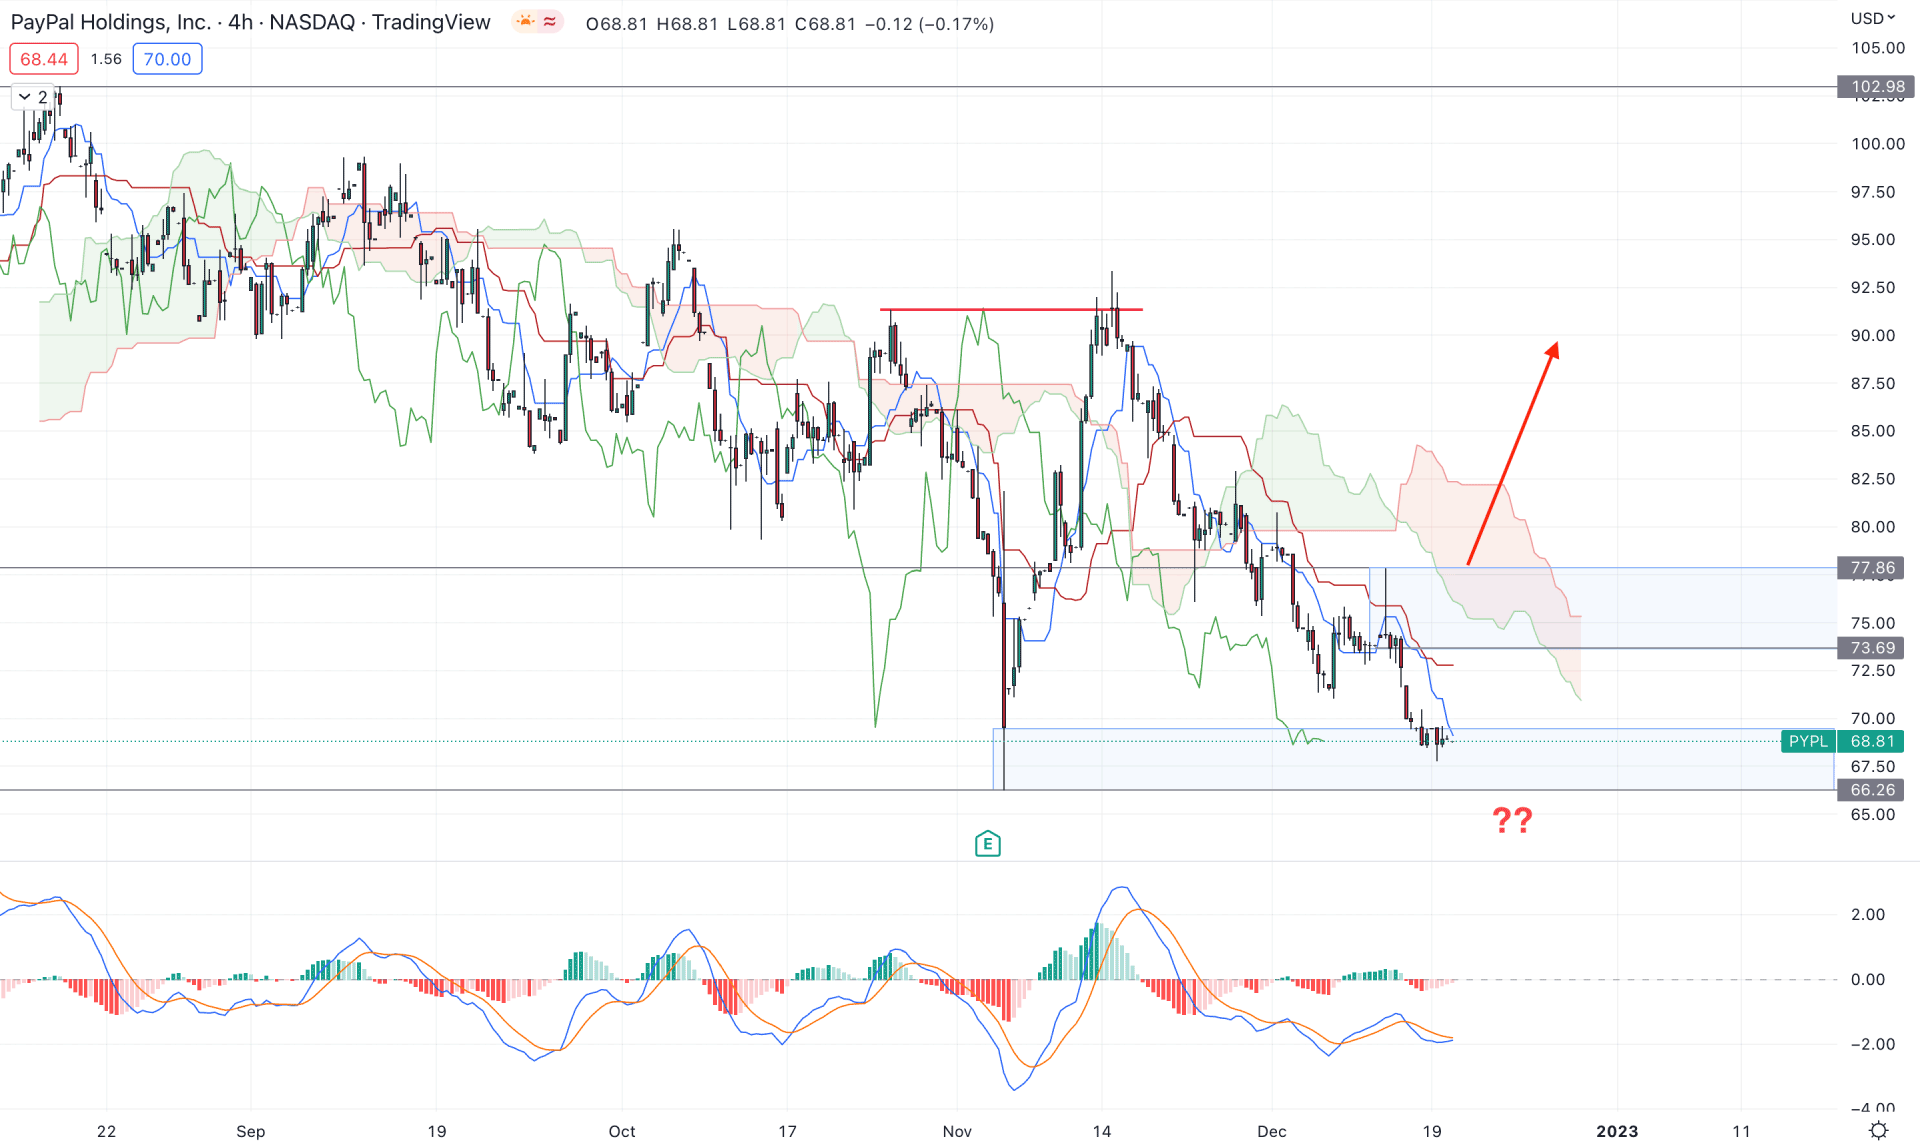
In the H4 timeframe, the broader outlook of the PYPL price is bearish as it is trading below the dynamic Kumo Cloud, where the Senkou Span A is below the Senkou Span B.
However, the upside pressure has become potent as the buying momentum from the November 2022 swing made a bullish break of structure, making the 69.00- 66.26 area a valid demand zone. As the current price is trading with a corrective pressure on that demand zone a buying possibility can regain momentum at any time.
The price chart shows the corrective price action in recent days, where the dynamic Tenkan Sen is above the price while the Kijun Sen is flat. The indicator window also shows a corrective momentum as the current MACD Histogram is at neutral point, with a bullish crossover in MACD EMA’s.
Based on the H4 outlook, a bullish rejection and a stable price above the 77.86 level would validate the long-term buying opportunity in the PYPL price, However, any strong bearish rejection from the 77.00 to 73.00 area could resume the existing bearish trend towards the 65.00 level.
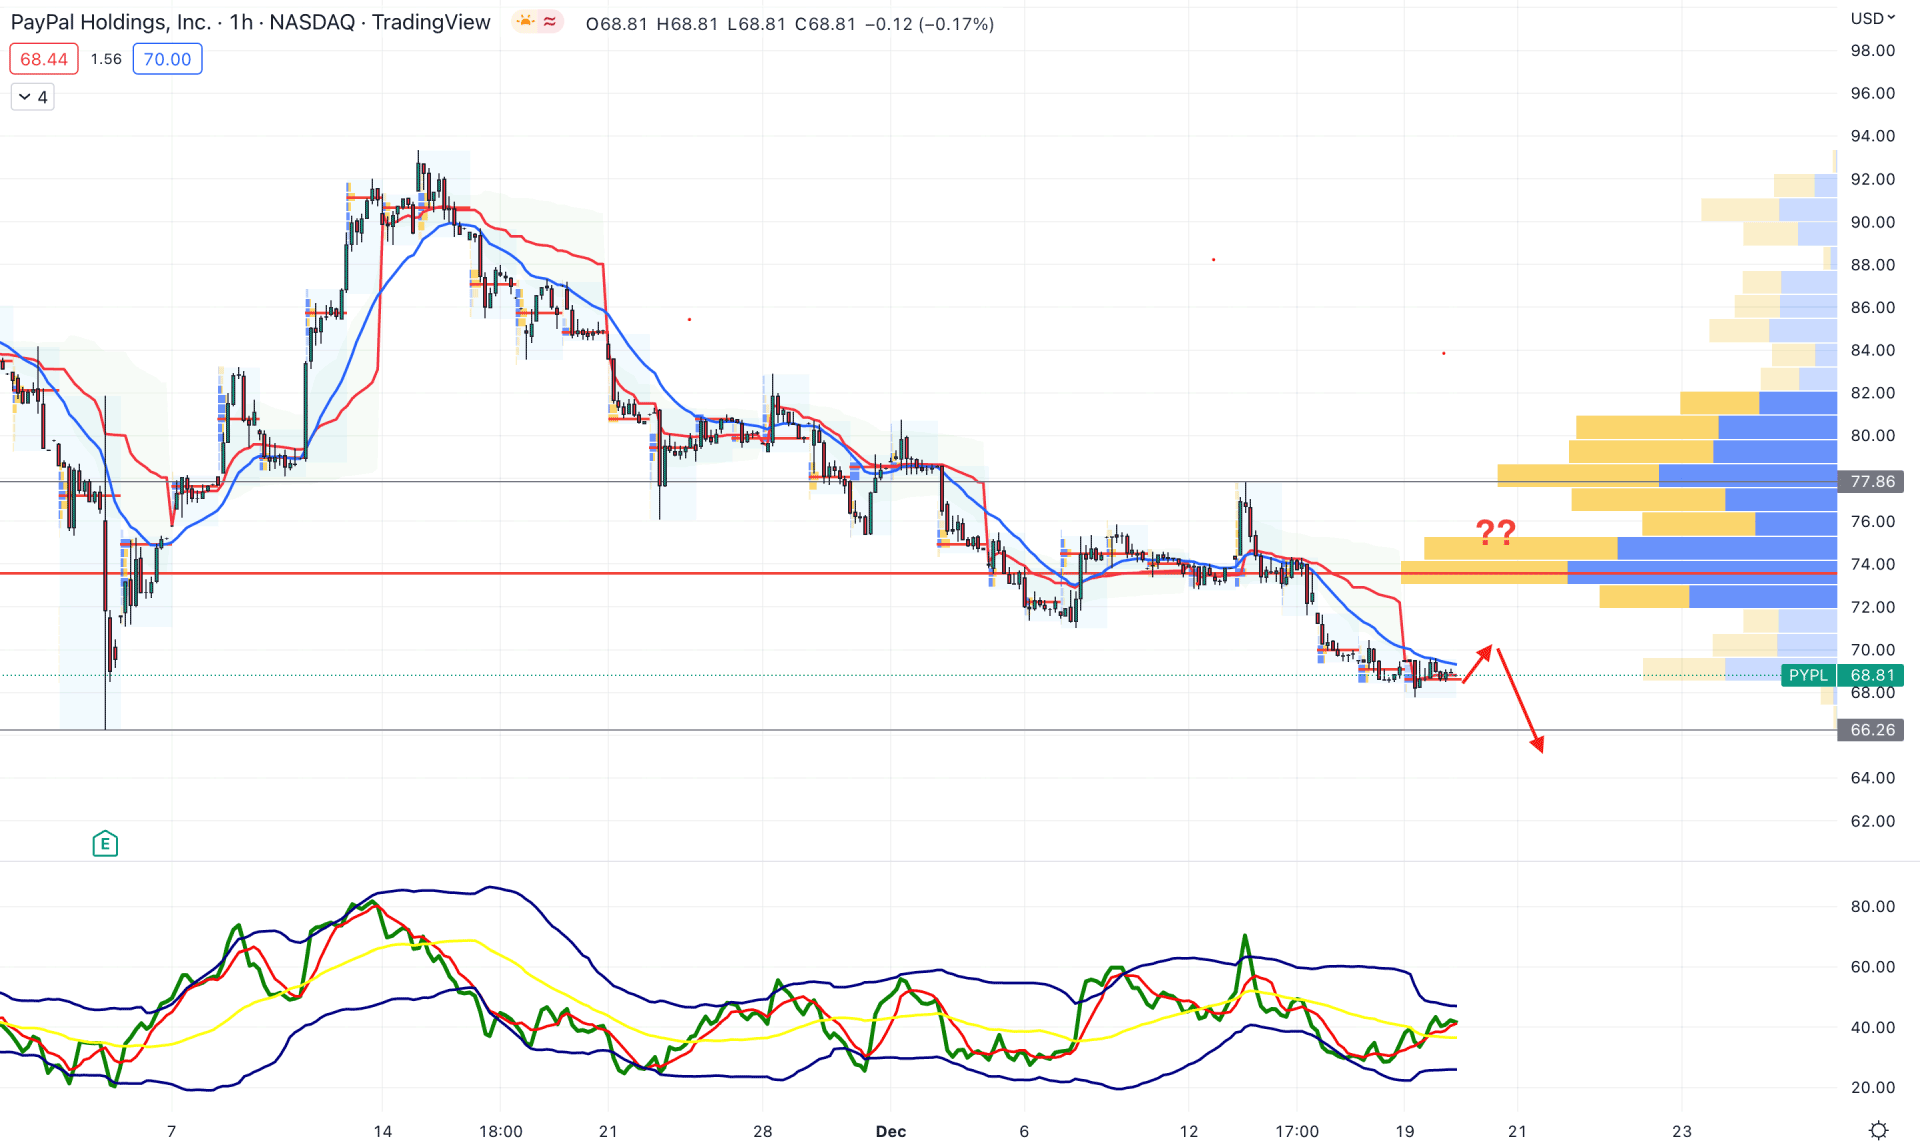
In the hourly chart, the broader outlook of the PYPL is bearish as the current price is trading below the visible range high volume level of 73.75. In that case, any short opportunity in the intraday chart could lower the price in the coming hours.
The dynamic 20 EMA and weekly VWAP are above the price and provide resistance, while the current Traders Dynamic Index (TDI) shows a buying pressure above the neutral 50% line.
Based on the current H1 outlook, a strong bullish recovery above the 77.86 level is needed to validate the long-term upside possibility. On the other hand, the bearish possibility is potent as long as it trades below the 73.75 level, which can drag the price down toward the 65.00 area.
Based on the current price outlook, PayPal stock needs to form a strong bullish breakout before offering a long opportunity. In that case, a bullish channel breakout and a stable price above the 20 DMA would be the safest position to go long.


