
Published: March 20th, 2024
In the past month, PayPal Inc. stock (PYPL) has increased by 8.61%, surpassing the Computer and Technology sector's (3.42%) and the S&P 500's (2.97%) gains.
PayPal's forthcoming earnings report is anticipated to disclose an EPS of $1.16, signifying a marginal decrease of 0.85% compared to the corresponding quarter of the previous year. Analysts anticipate a quarterly revenue of $7.51 billion, representing a 6.7% increase over the same period last year.
Analysts forecast fluctuations for PayPal warrant careful attention, as they frequently indicate alterations in immediate business patterns. Positive adjustments commonly indicate analysts' sanguine perspectives regarding the performance and profitability of the company.
Paypal is presently valued at a Forward P/E ratio of 12.91, which indicates a discount compared to the average Forward P/E for the industry, which stands at 30.15.
Furthermore, Paypal has established a PEG ratio of 1.15, which accounts for anticipated earnings growth in conjunction with the P/E ratio.
Let's see the upcoming price direction of this stock from the PYPL technical analysis:
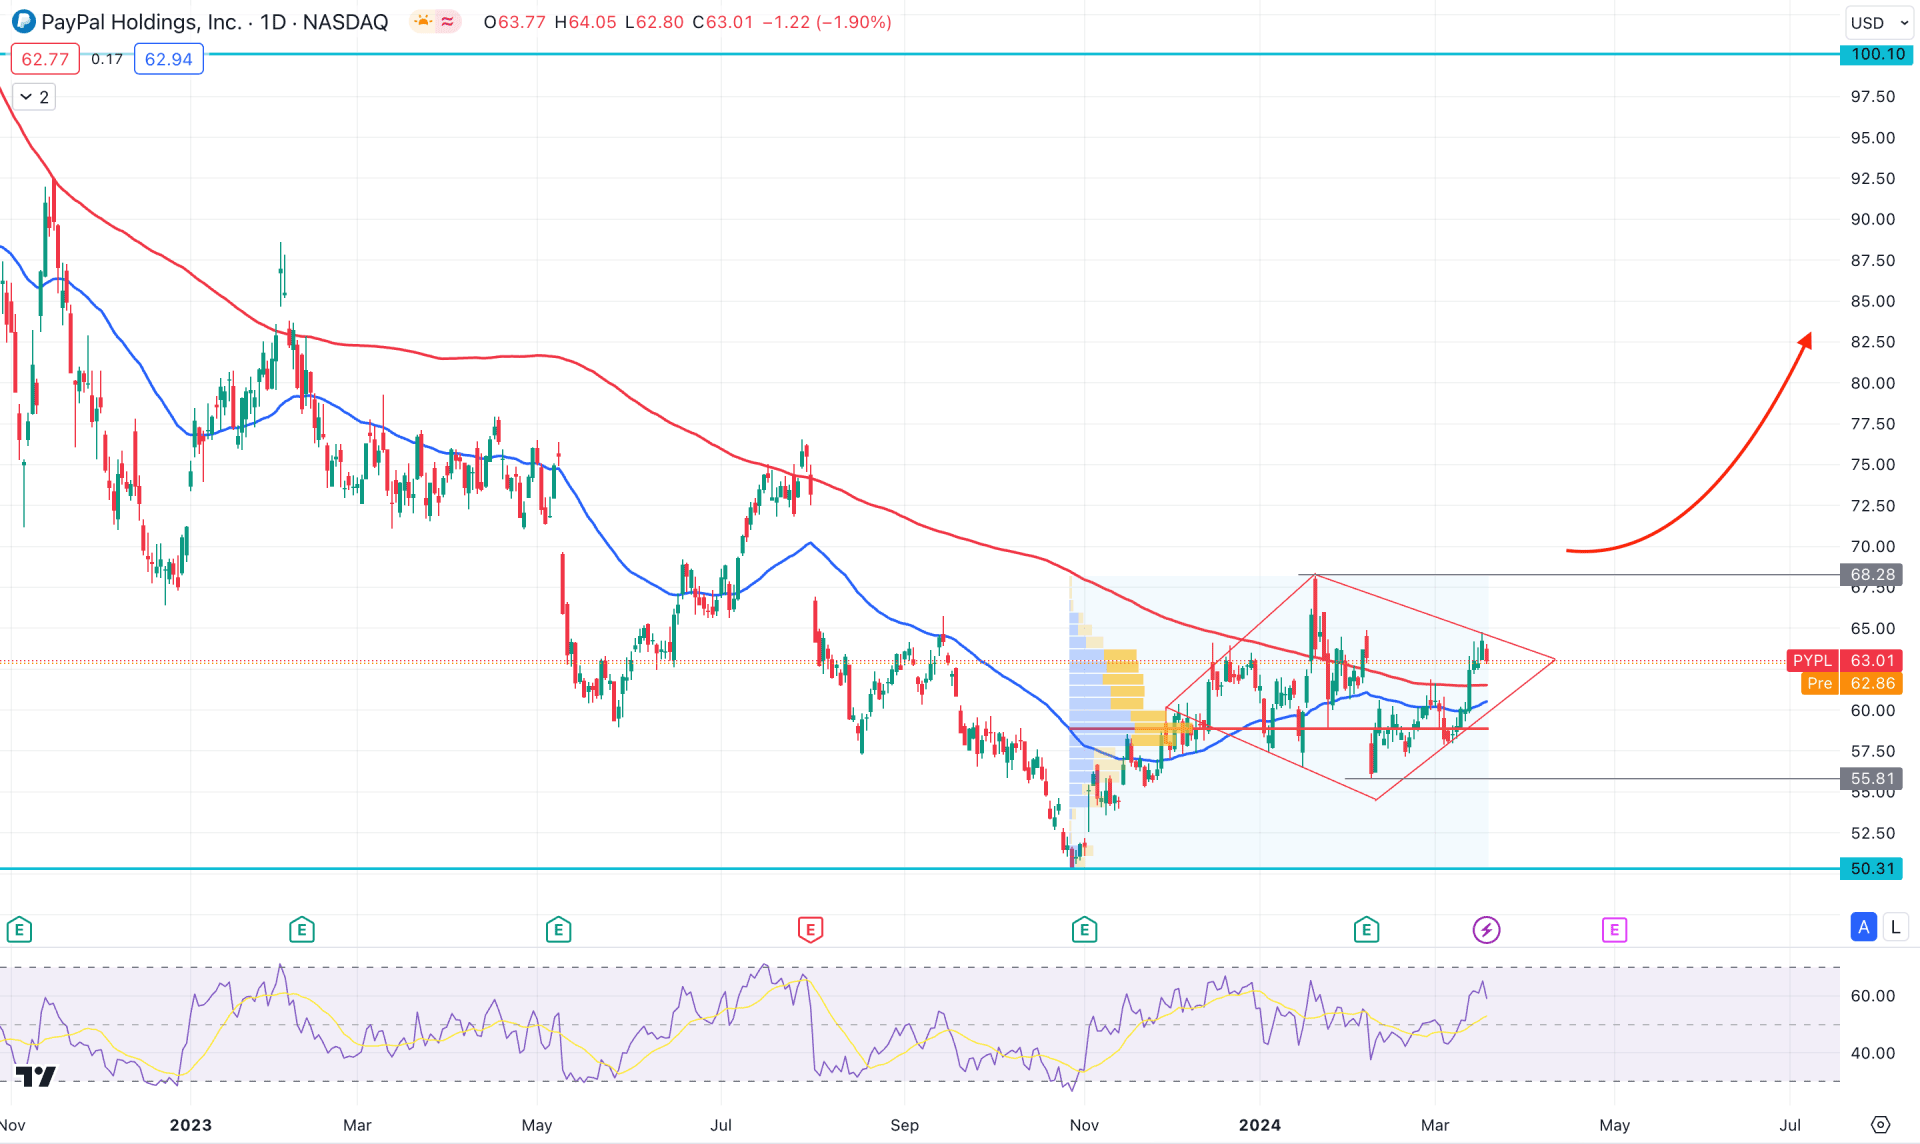
In the daily chart of PYPL, the overall market trend is bearish, influenced by the downside momentum in the broader crypto market. As there is no significant upward pressure seen in the current area, investors need more time to find a bottom. However, an early sign of buying pressure could come from the chart pattern, but it needs validation from the higher timeframe.
In the monthly chart, the current candle is trading bullish after two indecisive momentums in January and February. Moreover, the recent pressure is supported by the bullish two-bar reversal formed in December 2023. However, no significant bullish pressure is seen in the weekly chart, which would be a crucial factor to look at.
In the volume structure, the most significant level from October 2023 is at the 58.82 level, which is below the current price. Therefore, this stock's upward pressure is potent, as long as the price trades above this crucial line.
In the daily chart, the recent price moved above the 200-day Simple Moving Average and formed multiple daily closes above it. It is the first sign of a possible bullish reversal but not enough to open a long position. The dynamic 50-day EMA is still below the 200-day SMA line, which needs to form a crossover to indicate a Golden Cross.
In the specific chart pattern, the ongoing sideways market formed a possible Diamond pattern, where a bullish crossover above the Diamond pattern's resistance could be a potential long opportunity.
In the indicator window, the Relative Strength Index (RSI) shows a buying pressure as the current line hovers above the 50.00 line. Moreover, the MACD Histogram remains stable above the neutral line, while the 14-day ADX shows upward traction below the 20.00 line.
Based on the daily outlook of PYPL, a strong bullish signal is potent after having a valid breakout from the Diamond pattern. The conservative trading approach is to find a daily candle above the 68.25 resistance level before aiming for the 100.00 psychological line.
On the other hand, a deeper discount is possible towards the 60.00 line before offering another long opportunity, but a break below the 55.81 level with a daily close might alter the current market structure. In that case, a new swing low might form, targeting the 40.00 level.
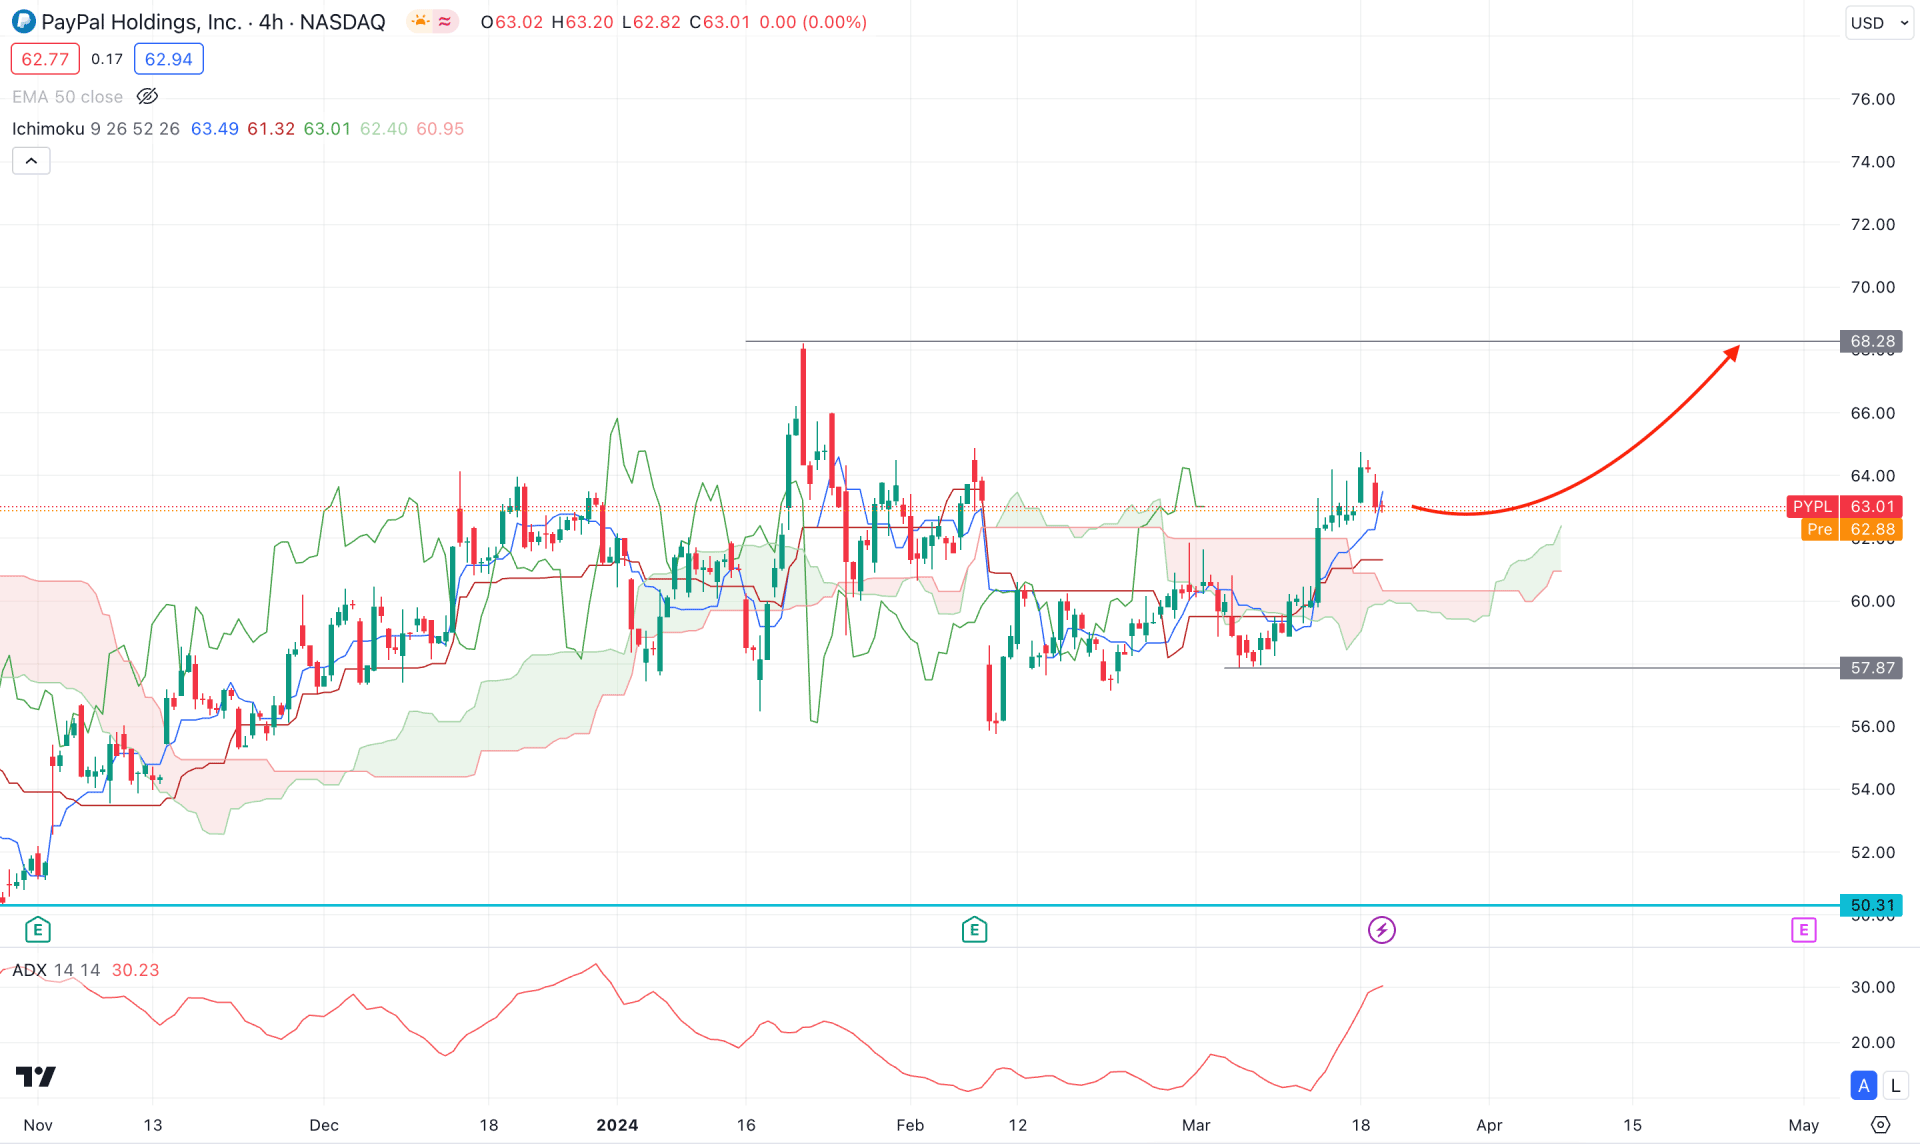
In the H4 timeframe, the ongoing market momentum is corrective, as multiple violations are visible in the Ichimoku Cloud area. However, the most recent price moved above the dynamic area and formed multiple bullish closes. Moreover, the future cloud is potent for bulls as the dynamic Senkou Span A is above the Senkou Span B line.
On the other hand, the Average Directional Index (ADX) moved higher and reached the 30.00 line, suggesting an ongoing impulsive wave.
Based on the H4 chart of PYPL, a bullish continuation is potent as the current price trades above the Ichimoku Cloud zone. Therefore, a bullish continuation and an H4 close above the 66.00 line could be a potential long opportunity, targeting the 80.00 level.
On the other hand, an extensive bearish pressure with an H4 close below the 57.87 low could indicate a bearish signal, whereas a consolidation below this line could lower the price toward the 50.31 support level.
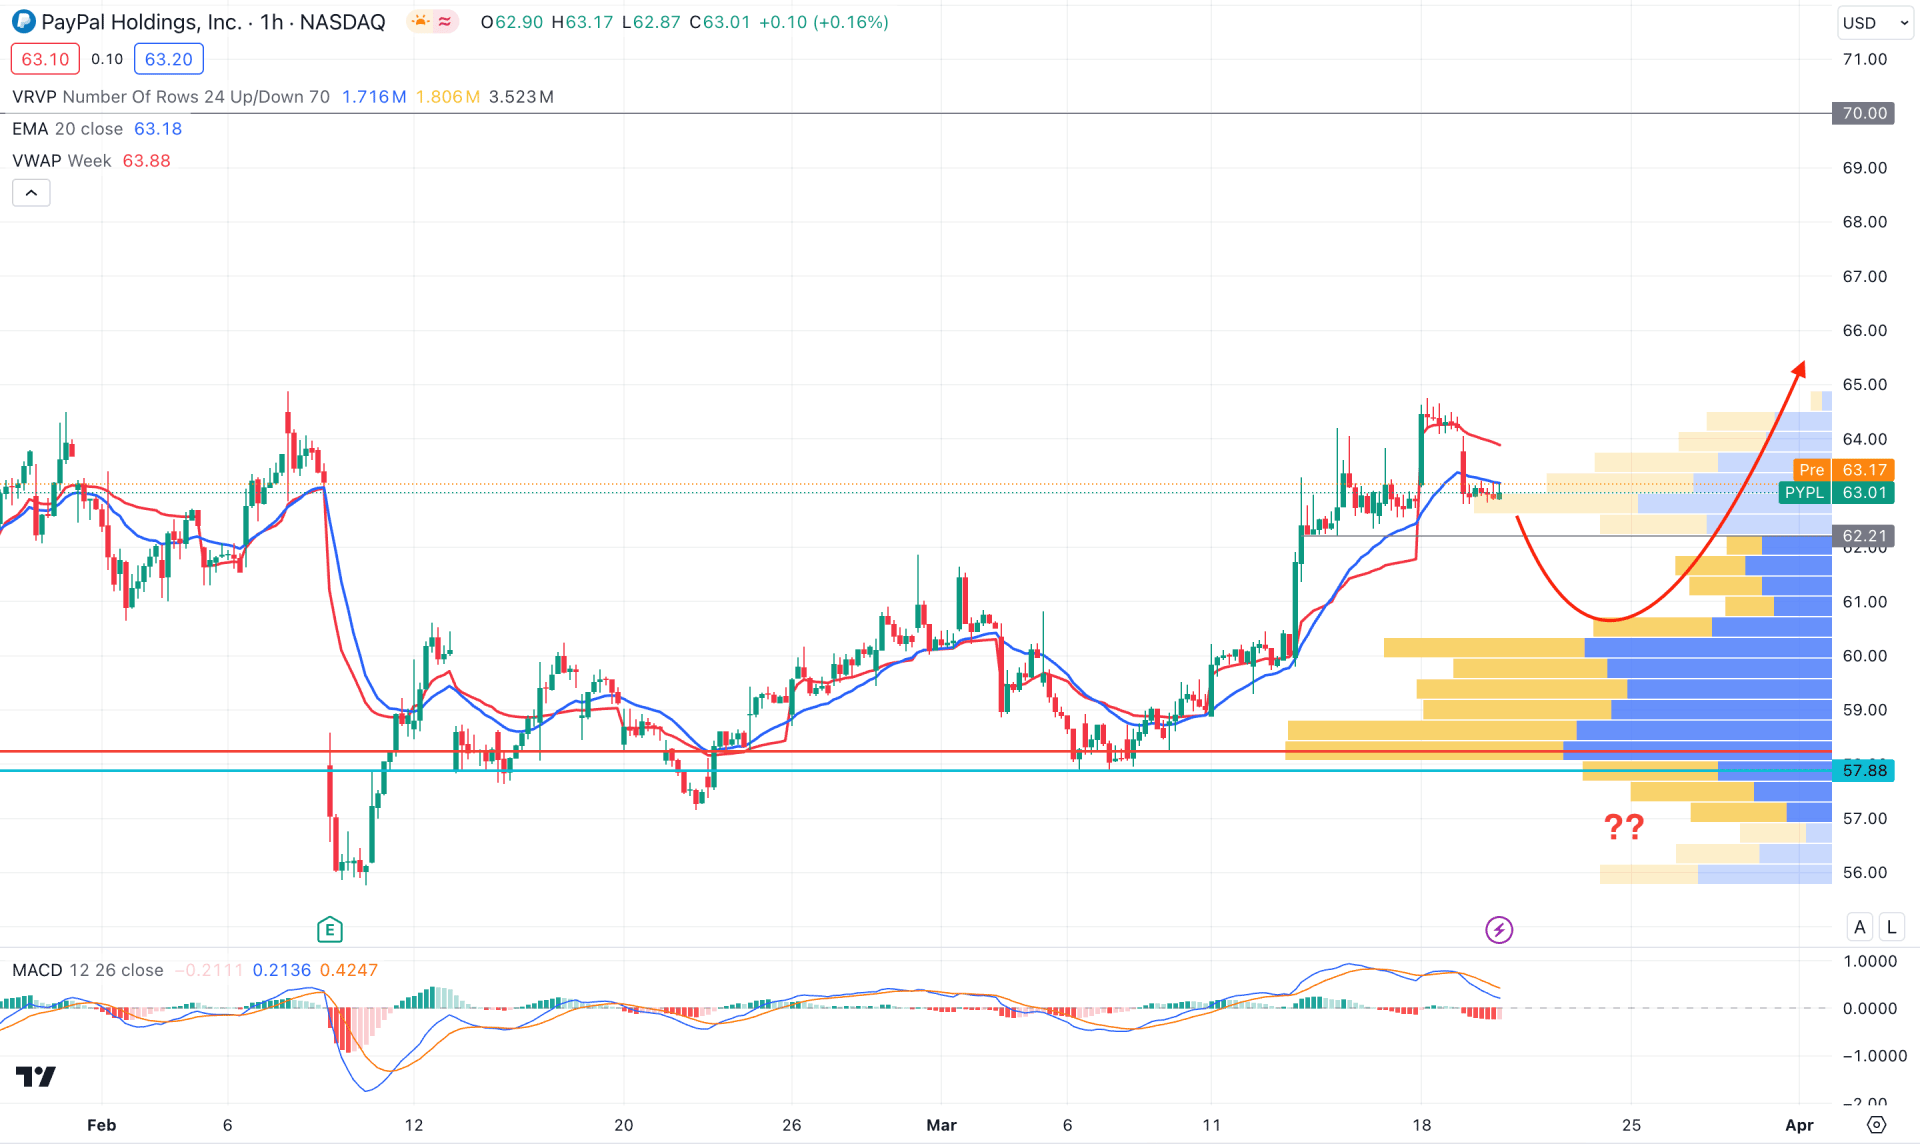
In the hourly chart, the broader context is bullish as the current price trades above the visible range high volume level. However, downside pressure is visible below the dynamic 20 EMA level, which indicates a possible top at the 64.75 level.
In the indicator window, the MACD Histogram turned bearish, while a bearish crossover is visible on the Signal line.
Based on this outlook, a bearish intraday pressure might come after having an H1 candle below the 67.21 support level. In that case, the downside pressure might extend toward the 59.00 to 56.00 area before forming a bullish signal. However, a prolonged selling pressure below the 56.00 line could lower the price towards the 40.00 level.
Based on the current price behavior, PYPL is more likely to form a bullish signal after forming a valid breakout from the trendline resistance. In that case, investors should keep a close eye on the daily price action for a conservative long opportunity in this stock.


