Published: May 9th, 2023
PayPal Inc (PYPL) reported the first quarter earnings report on Monday, which topped analysts' expectations. However, the stock dipped after the news release as the 2023 outlook showed a concern.
For the March 31 quarter ending, the earnings came 33% higher at $1.17 a share. Moreover, the revenue showed a 9% increase to $7.04 billion, topping analysts' projections by 1%.
The total payment volume from merchant customers showed a 10% increase to $354.50 billion, topping analysts expectations of $344.80 billion.
The company's drawback is its full-year projection, where the adjusted earnings growth could come 20% higher at $4.95 a share.
After showing a 62% discount last year, PayPal stock has advanced 5% in 2023. The company also announced a $15 billion share buyback program in August, which may work as a bullish factor for PYPL buyers.
Another bull case for this stock is its recent 2,000 job cuts, representing 7% of the overall workforce.
Let’s see the upcoming price direction of this instrument from the PYPL technical analysis:

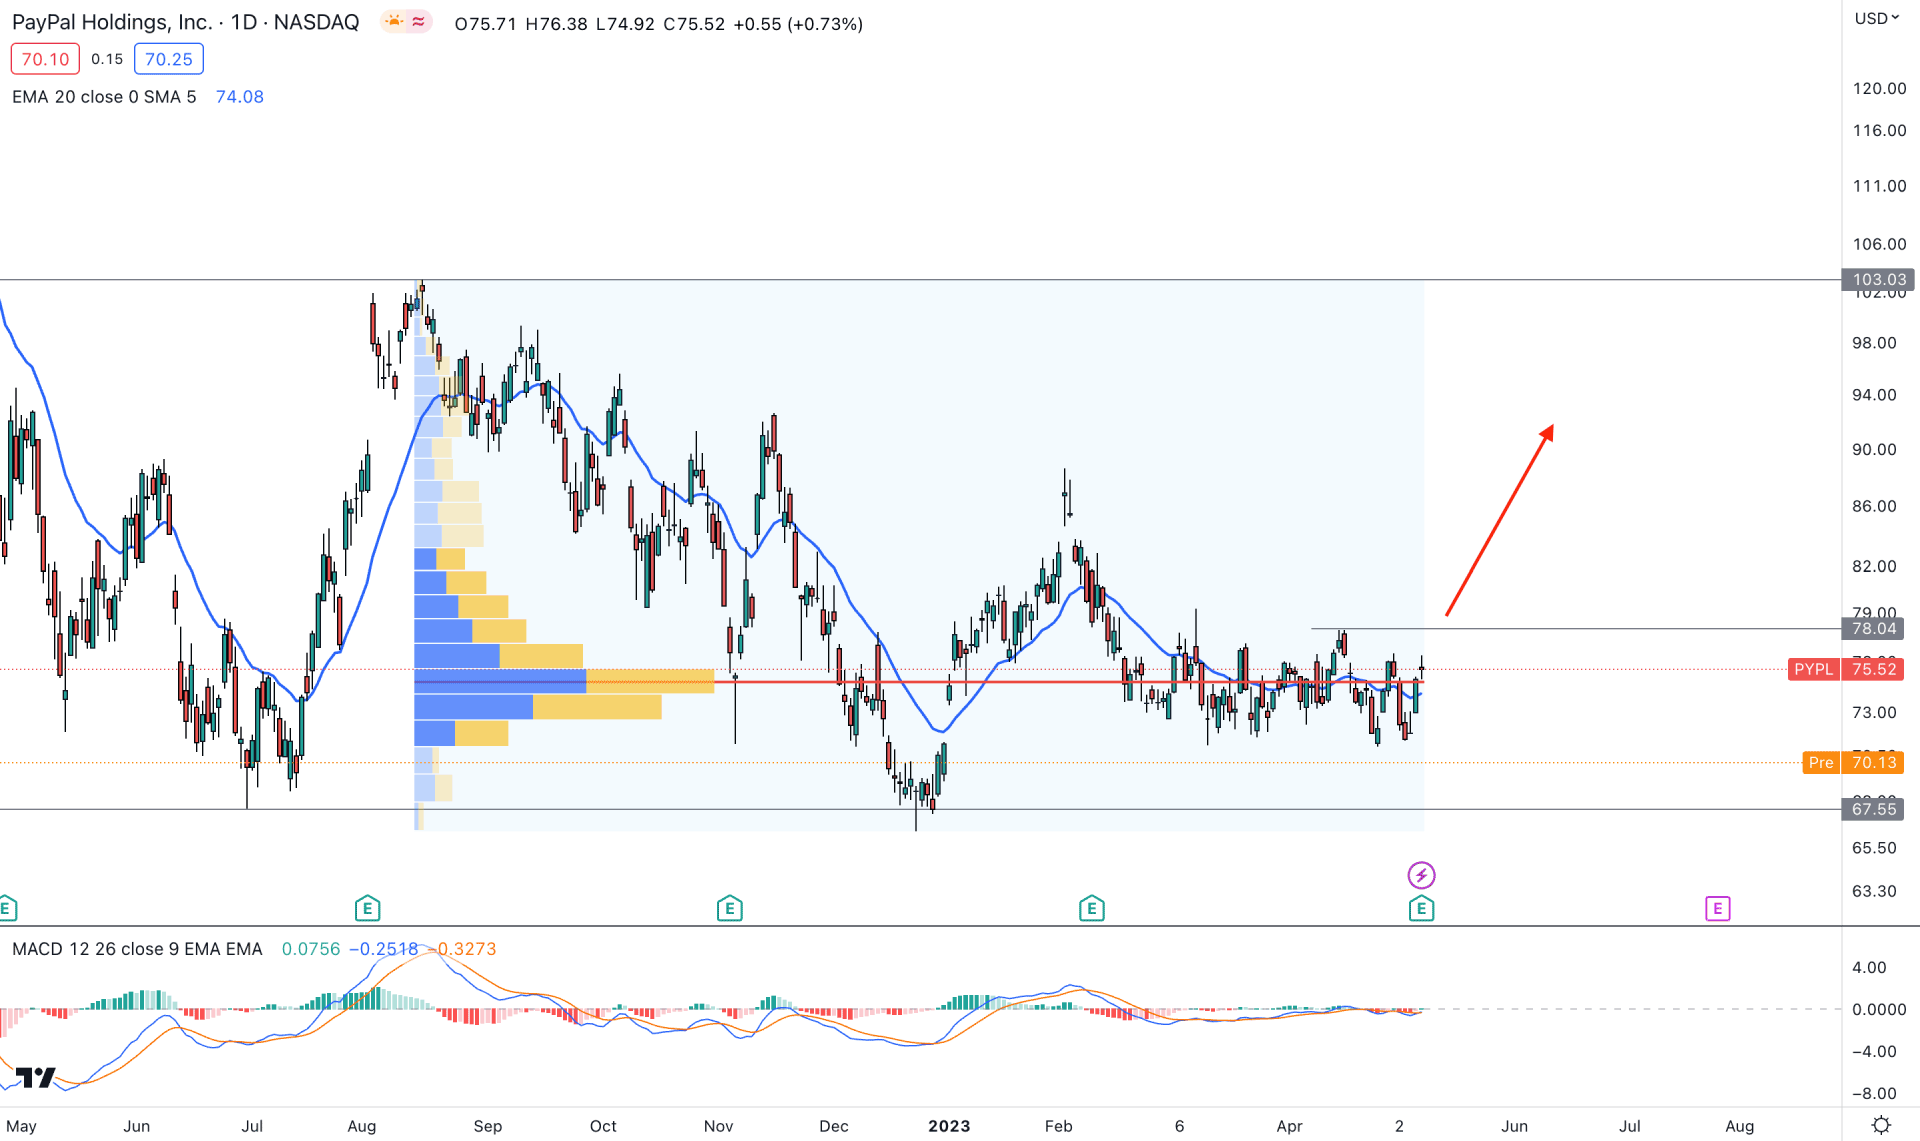
In the daily chart, the current price is trading sideways above the 67.55 critical support level. Therefore, downside pressure is present due to the negative yearly forecast for PayPal stock. The primary trading approach is to wait for the price to form a bullish breakout from the current range before opening any long position.
The current high volume level since 16 August 2022 is at 74.69 level, which is above the current price. Therefore, strong selling pressure is present in this instrument, where any intraday bearish opportunity could provide a high probability trading opportunity.
In the secondary window, the current MACD Histogram shows an extreme correction, which signals a potential breakout in this stock. Moreover, the main chart window shows a downside pressure as the dynamic 20-day Exponential Moving Average is above the current daily candle. Moreover, the latest daily candle stock came with a strong downside pressure with a broader gap, which can end up with a bearish impulsive trend.
Based on the daily price outlook, a bullish trading opportunity is present, which needs a bearish liquidity sweep from the 67.53 support level. Later on, a stable buying momentum with an intraday buy signal above the 78.00 level could open a long opportunity, targeting the 110.00 area.
On the other hand, as the current downside momentum is potent, a strong bearish daily candle below the 66.00 level could lower the price toward the 50.00 area.

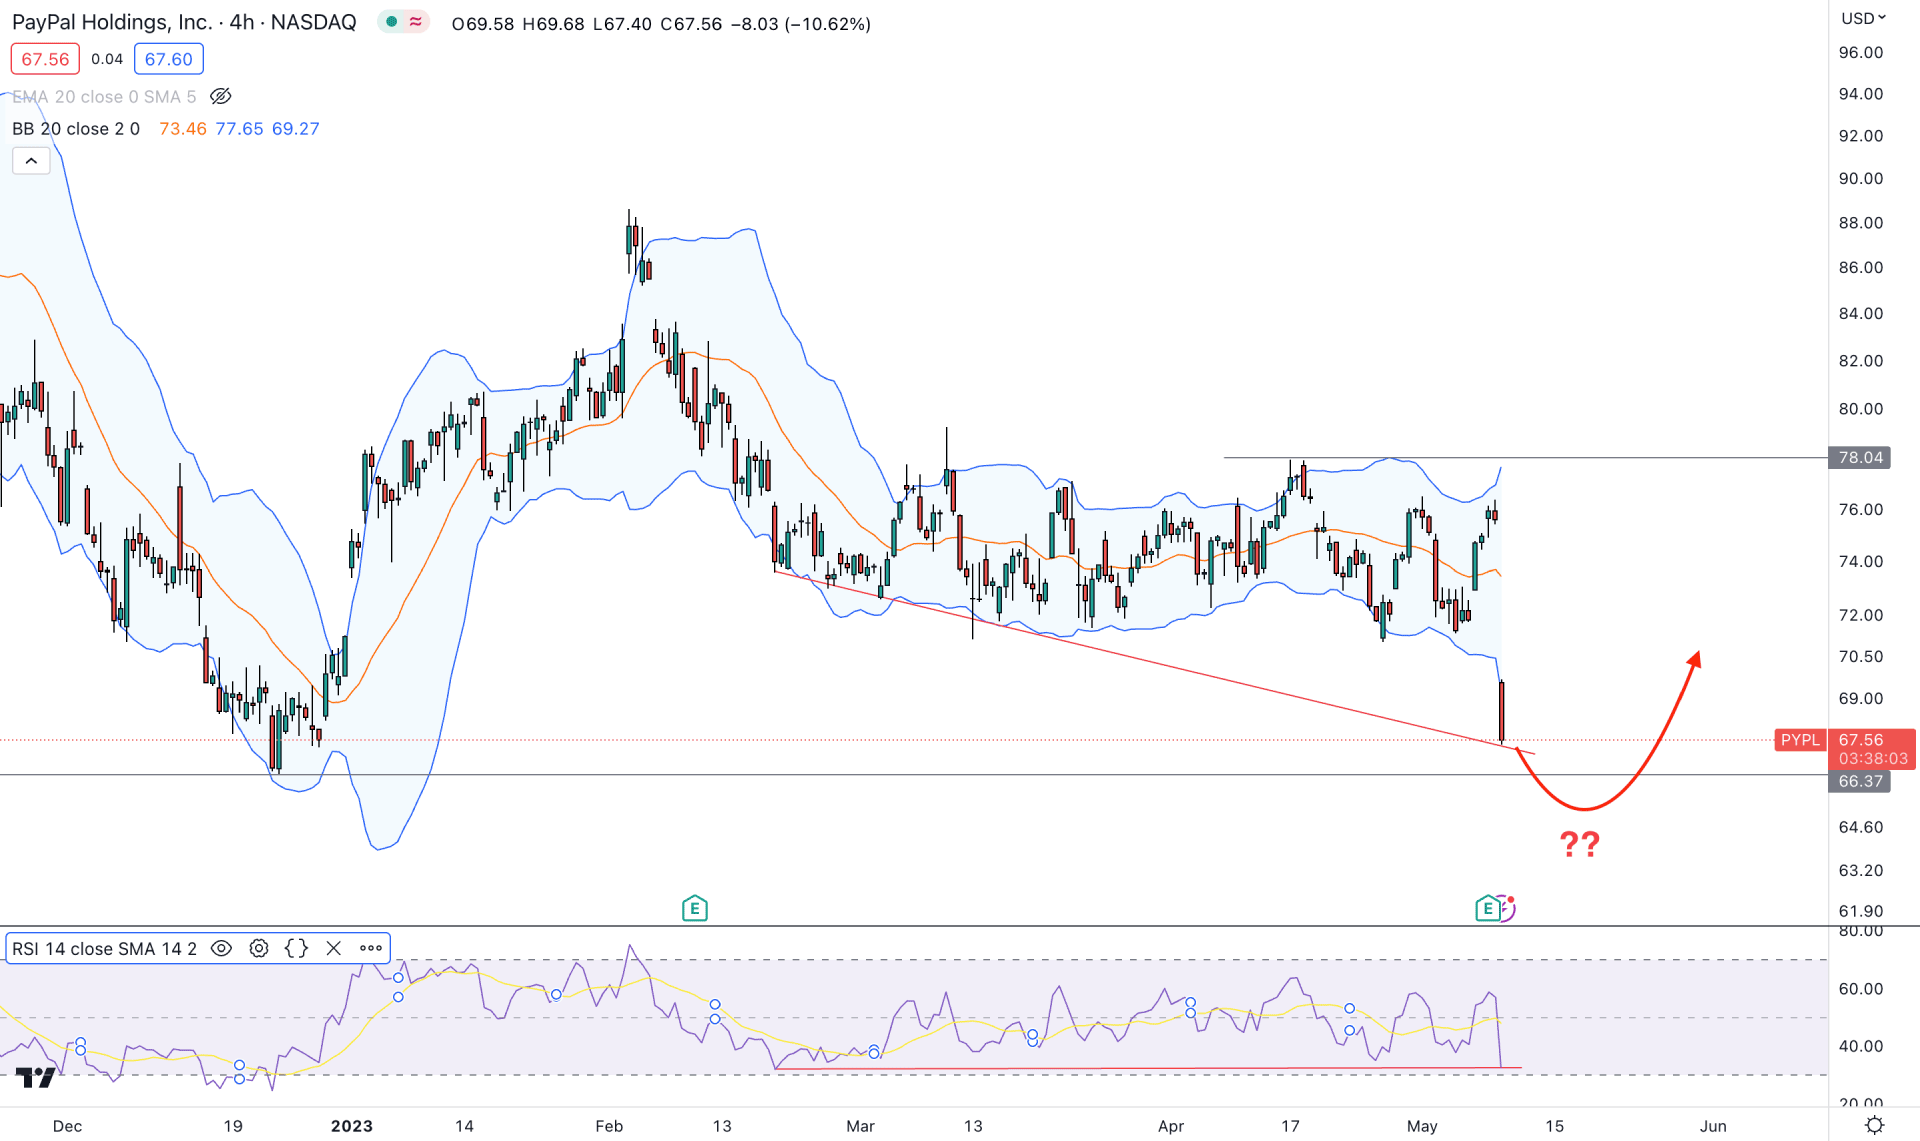
The H4 chart shows the current market trend is extremely bearish, where any short trading opportunity could work well. However, the recent price touched the Lower Bollinger Bands level, from where a mean reversion could happen.
In the indicator window, the Relative Strength Index (RSI) failed to make a new low, following the price, which is a clear sign of divergence. As the divergence is a strong trend reversal indicator, investors should find other clues from the main window.
The Bollinger Bands is a trend-following indicator, where the lower Bollinger Bands works as an extreme selling point from where a bullish correction may happen. For the PYPL H4 chart, the lower BB and 66.37 level would be the hope for bulls from where buying pressure may come.
Based on this outlook, the conservative buying approach is to wait for the price to come above the mid-BB line, where the ultimate target is to test the 78.00 resistance level. However, a bearish pressure below the 66.00 level needs solid exhaustion before offering a long opportunity.

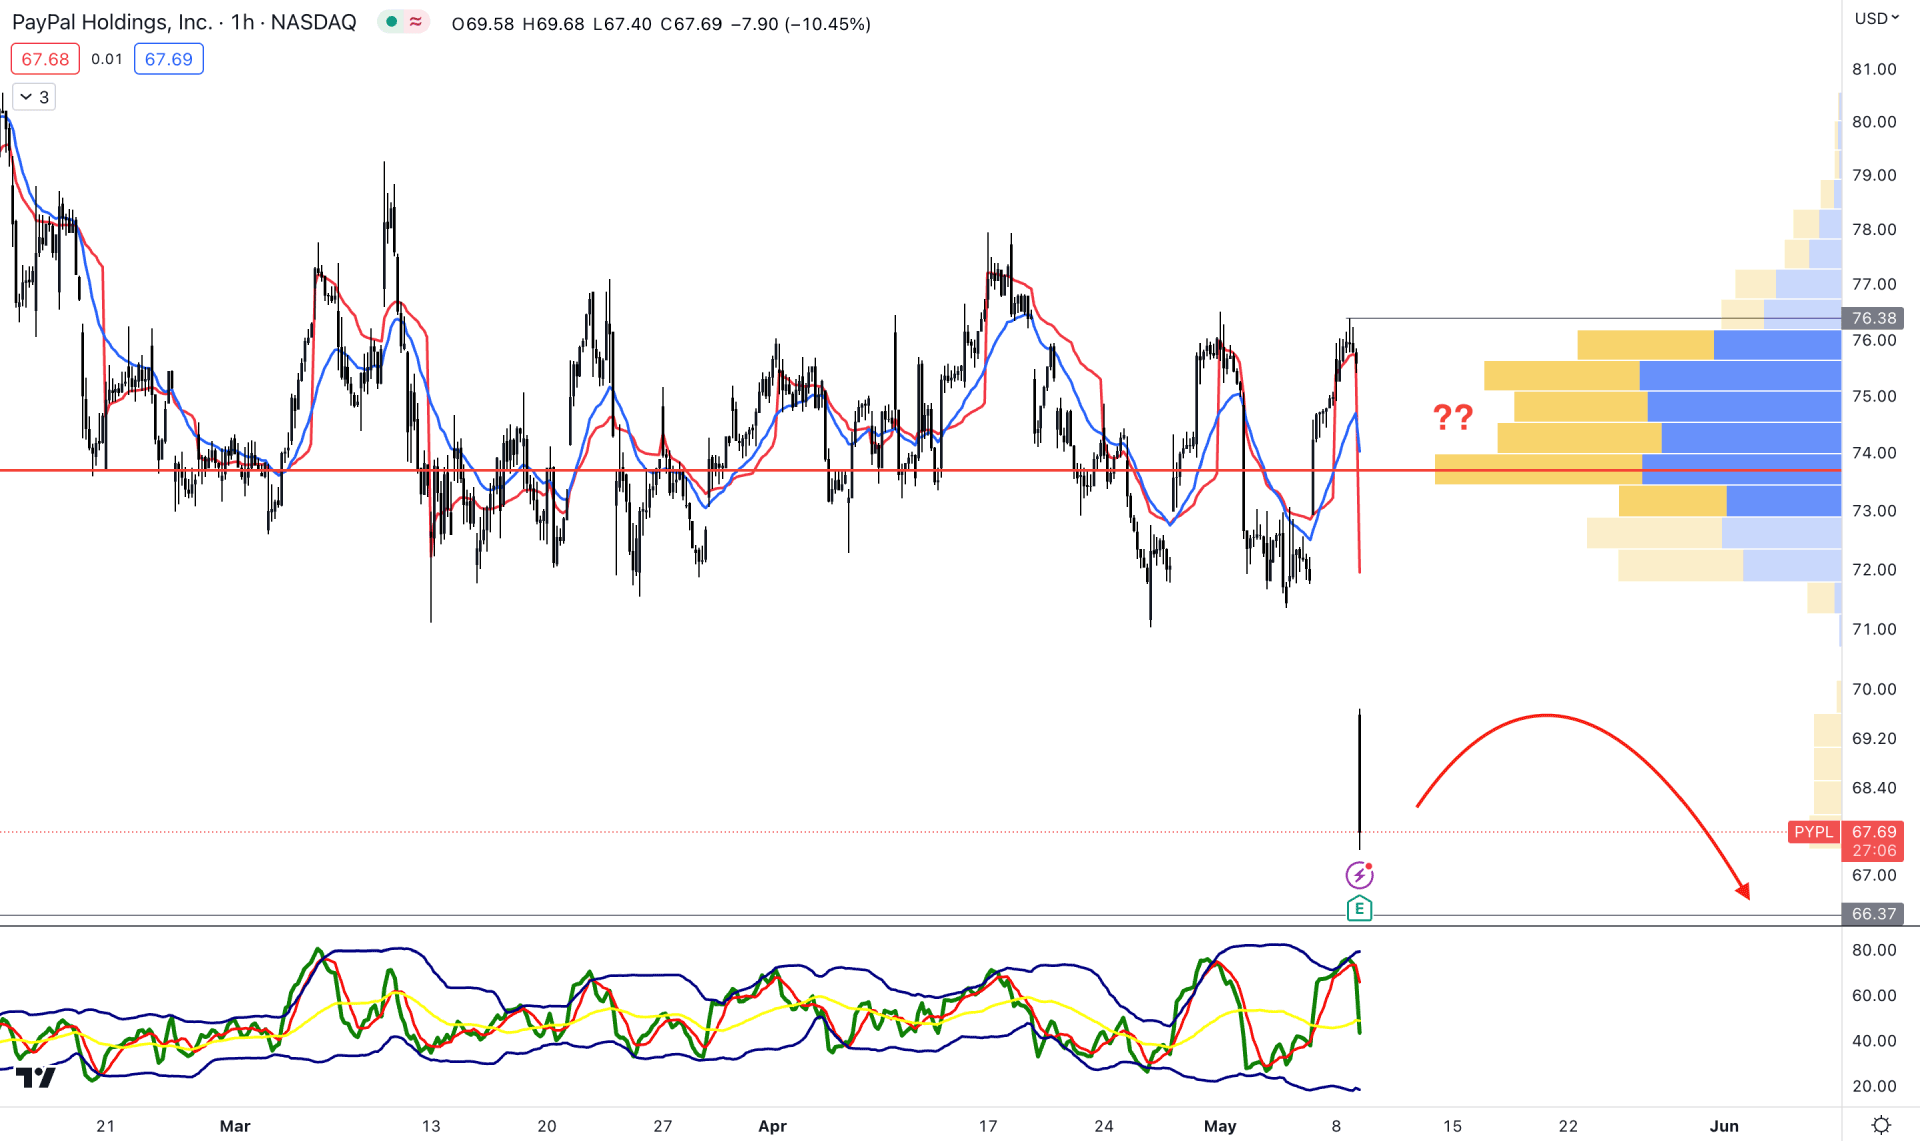
In the H1 chart, the broader market outlook is bearish as the current price is trading below the visible range high volume level. However, the price moved down with extreme selling pressure, which needs a sufficient bullish correction,
The dynamic 20 EMA and VWAP are above the price, working as resistance, while the Traders Dynamic Index (TDI) shows further room downside.
Based on the current H1 price behavior, a bearish trend continuation opportunity needs a bullish correction at the 72.00 area.
However, a strong bullish break with an H4 candle above the 75.00 high volume level could alter the current market trend and increase the price toward the 110.00 level.
Based on the multi-timeframe analysis, PYPL stock could move down following the recent bearish trend. However, a bearish liquidity sweep from the near-term support level, with bullish range breakout could offer a long opportunity in this stock.