
Published: September 20th, 2022
The ongoing bullish recovery in PancaeSwap token (CAKE) might offer a decent buying opportunity from the current dip. Since 19 August 2022, this token remained consistently up while the broader crypto market struggled. As a result, this token made a decent 23% gain in the last 30 trading days.
PancakeSwap offers an automated market maker model, where a decentralized finance application allows users to exchange their tokens and provide liquidity through farming.
The platform was launched in September 2020 as a decentralized exchange for swapping BEP20 tokens through Binance Smart Chain. Its AMM model allows traders to trade against the liquidity pool. Once these pools are filled, investors can receive CAKE as a return.
The live market cap of this token is $611,921,659.06, while the current circulating supply is 139,916,487.53 CAKE from 750,000,000 max supply.
Let’s see the future price action for PancakeSwap (CAKE) from the CAKE/USDT Technical analysis.
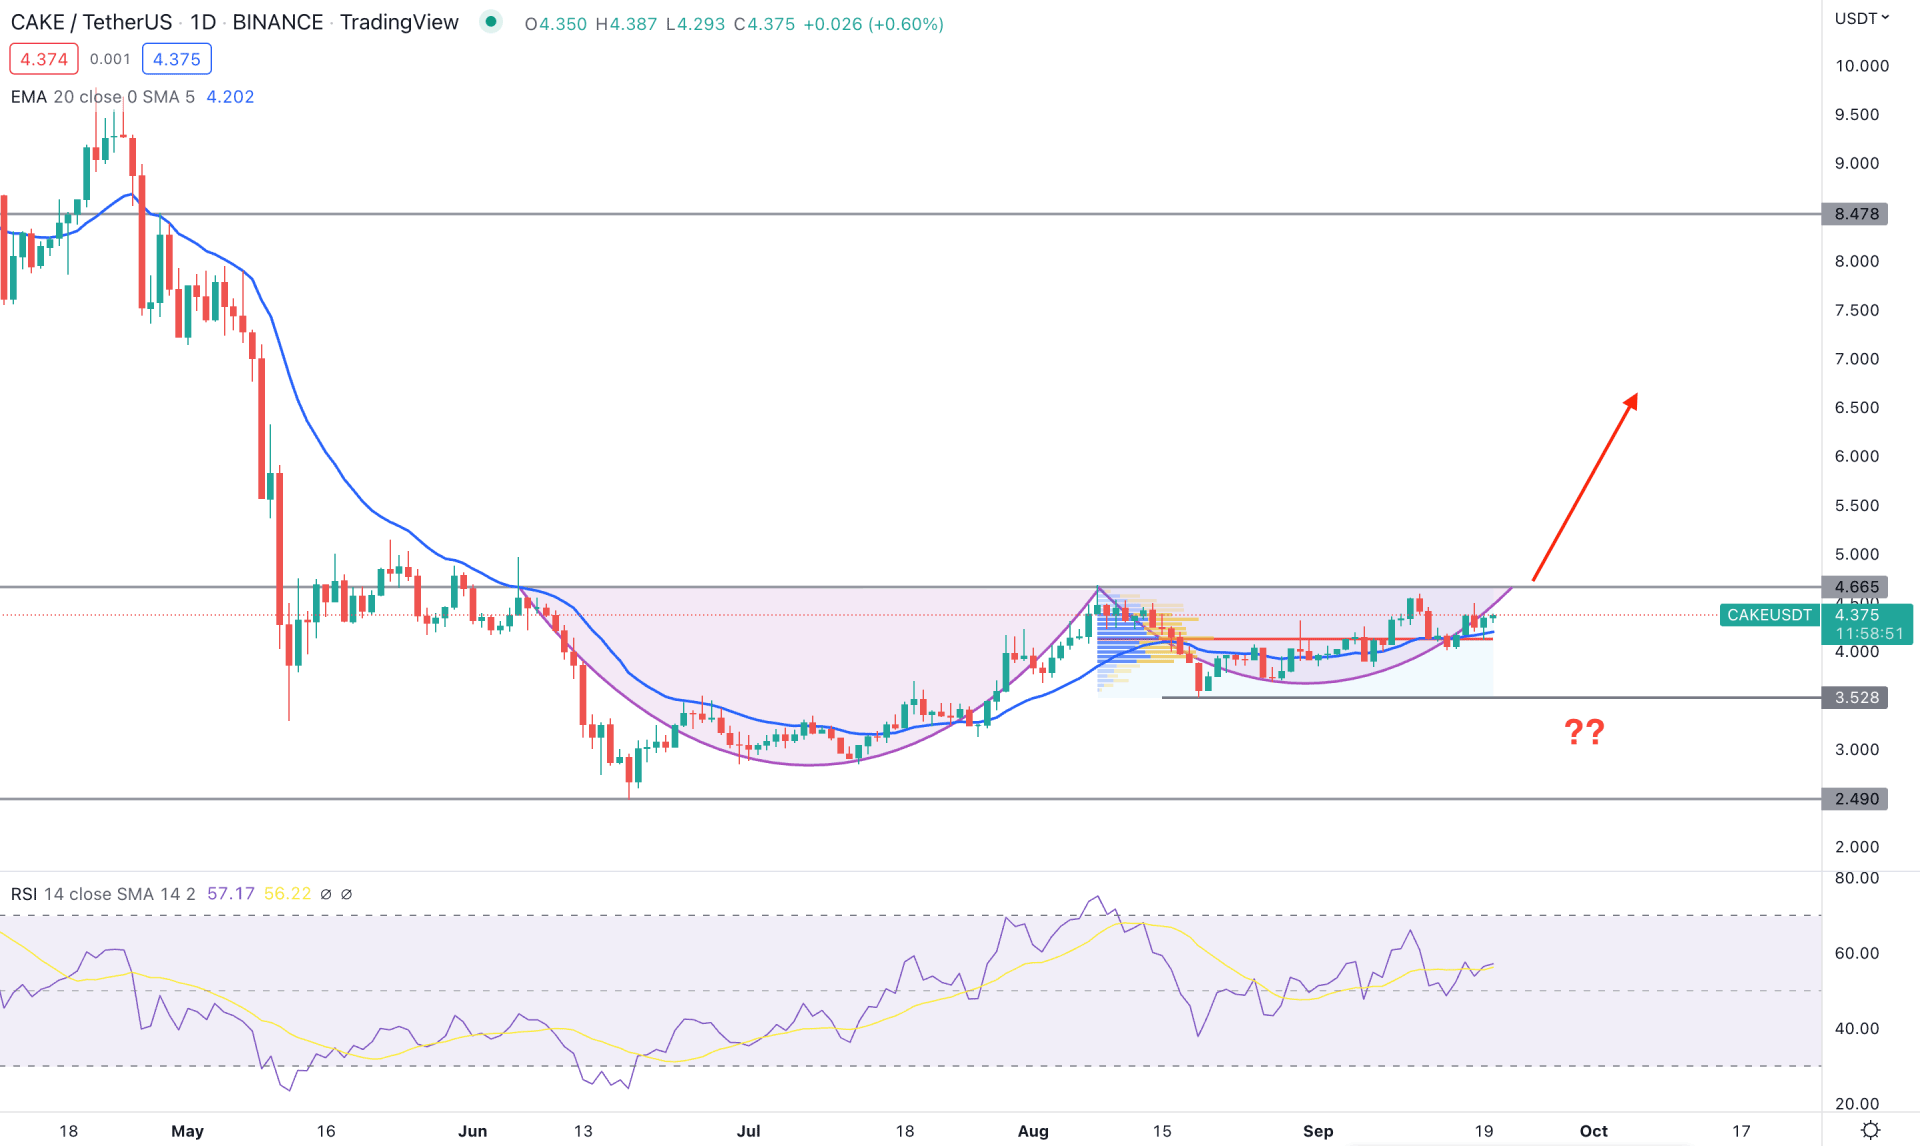
The CAKE/USDT daily chart shows that the current price trades range from 4.66 high to 3.52 low, where a breakout can form a trend.
The price structure is positive for bulls where the current daily trading range started from 9.75 high to 2.49 low, from where a Quasimodo pattern appeared. As the current price is below the 50% level of this zone, we can consider it a discount, from which any buying setup can offer a higher reward.
Based on the fixed range volume indicator, the highest trading volume from August high to September low is at 4.13 level, just below the dynamic 20-day EMA. The buying pressure is also supported by the Relative Strength Index (RSI), which is above the 50% level, aiming toward the overbought 70% zone.
The potential Cup and Handle reversal pattern is yet to form, where a bullish break above the 4.66 level will validate the pattern. Bulls should wait for the price to move above the 4.66 level with a bullish daily close, which can offer a 79% gin towards the 8.47 resistance level.
The alternative trading idea is to wait for the price to break below the dynamic 20 DMA and 3.52 level and form a bearish D1 candle. In that case, the selling pressure may extend towards the 2.49 or even 2.00 level.
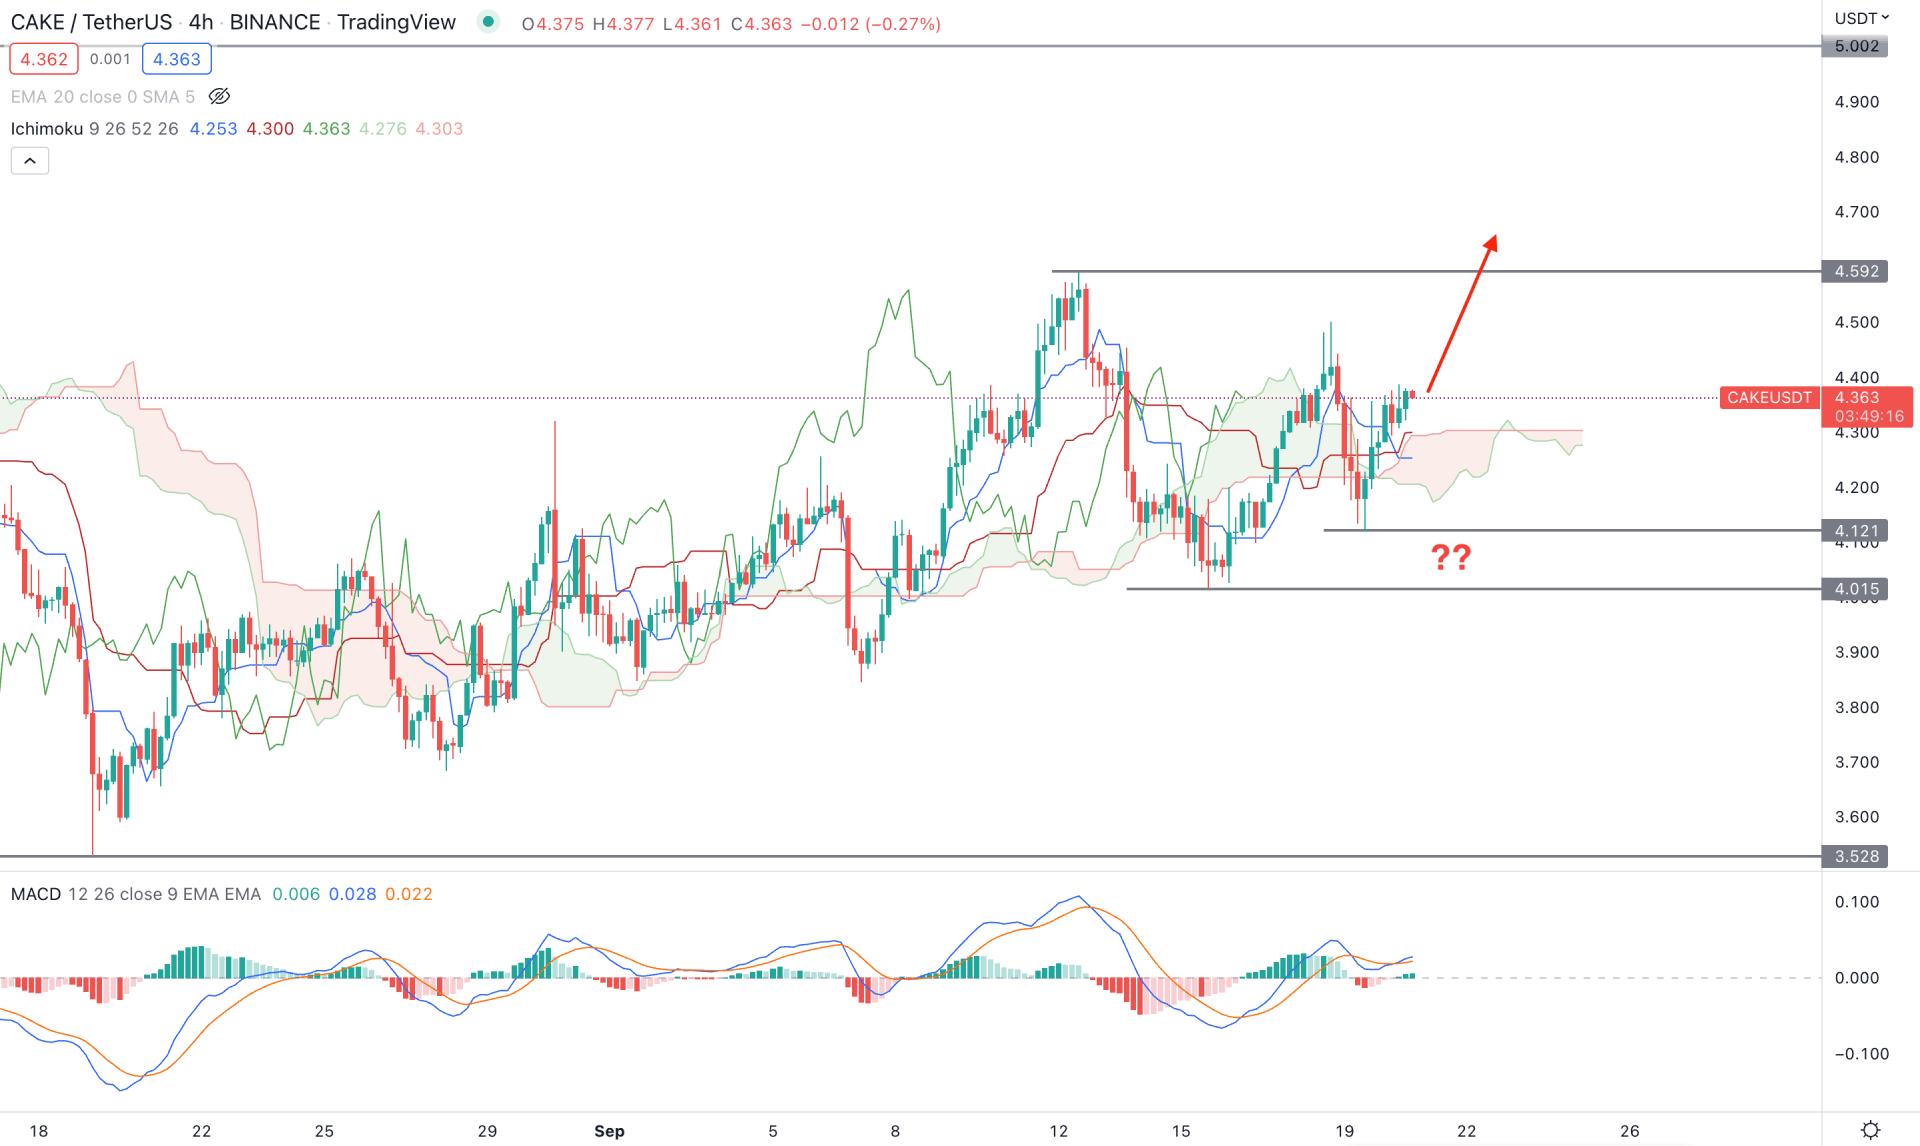
Ichimoku Cloud provides a potential trend-trading opportunity, where finding the primary trend from the daily chart and opening positions in the H4 timeframe would be a decent combination.
However, the current price direction is not strongly bullish in the H4 chart as the future cloud is not supportive. The Senkou Span A is still below the Senkou Span B, where a bullish crossover is pending to indicate a trend reversal.
On the other hand, the current price is above the Cloud support, backed by a bearish false break. The indicator window also shows buying pressure as the Histogram is above the neutral line with a bullish crossover in MACD lines.
Based on the H4 price prediction, the buying possibility is valid as there is a strong bullish crossover between Tenkan Sen and Kijun Sen. On the other hand, the current price is above two important swing lows- 4.12 and 4.01, which need to be overcome. A break below the 4.01 level with a strong bearish H4 candle would validate the bearish possibility and lower the price towards the 3.52 support level.
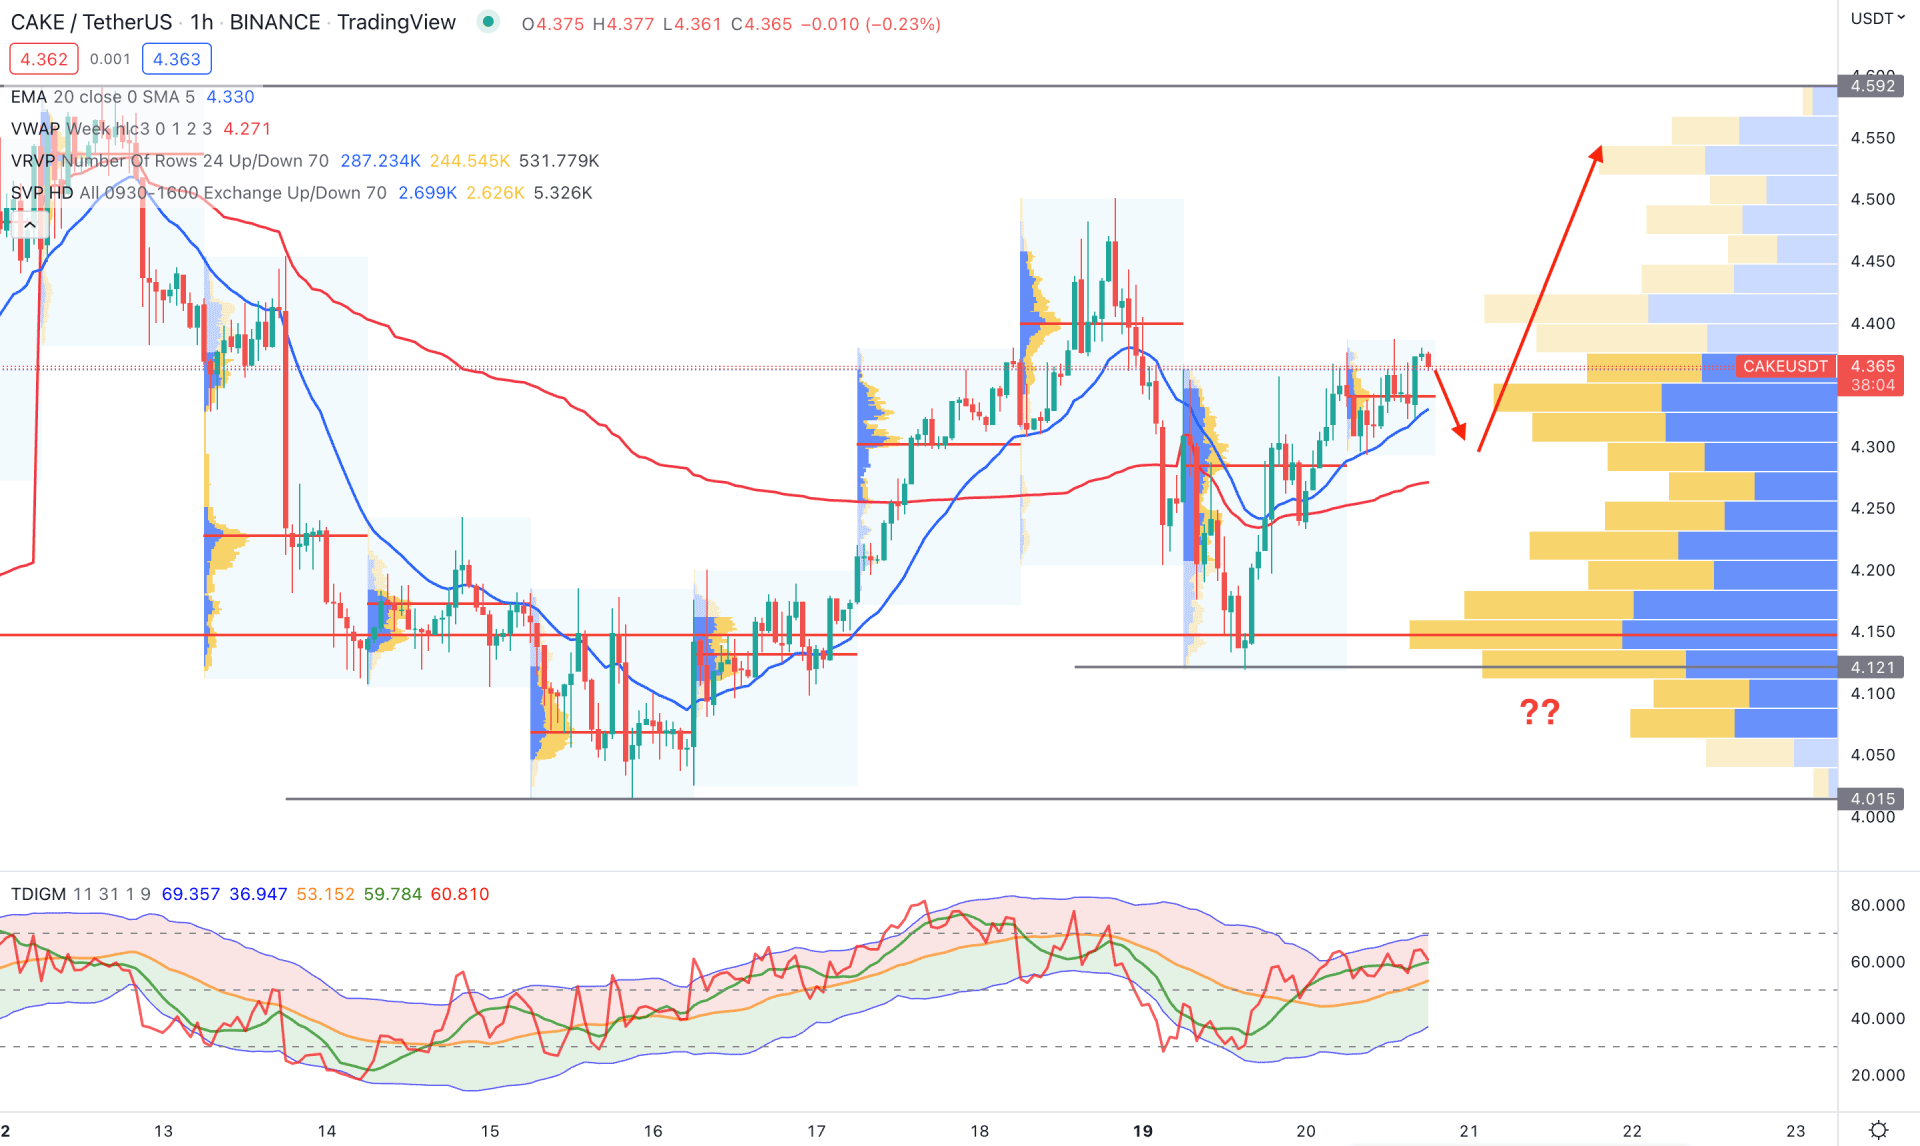
The broader market context in the CAKE/USDT intraday H1 chart is bullish as the current price is above the dynamic 20 EMA and weekly VWAP. Moreover, these dynamic levels are sloping higher, indicating buyers' presence in the market.
Based on the visible range high volume indicator, the highest trading volume in September is at 4.15 level, which is below the current price. Moreover, intraday high volume level made consecutive higher highs, which is also a reason to rely on buyers’ pressure.
The Traders' dynamic index indicator shows buyers' activity in the market, where the current TDI line has been above the 50% level for a considerable time. Moreover, the TDI line is yet to reach the upper band, representing a space for bulls.
Based on the H1 chart, the primary approach is to find a bullish rejection from the dynamic support level before aiming toward the 5.00 level. Another buying possibility is valid if bulls show further rejection from the high volume 4.15 area.
On the other hand, breaking below the 4.00 level with a bearish H1 candle would eliminate the current bullish structure and lower the price towards the 3.00 area.
Based on the current CAKE/USDT technical analysis, the bullish trend is yet to be valid from the Cup & handle pattern that can provide a decent 70% profit. However, investors should monitor how the price trades above the 4.66 resistance level, where any unexpected false break and bearish rejection could eliminate the bullish opportunity.


