Published: December 7th, 2023
Owens Corning has exhibited strong performance, documenting noteworthy expansion in the third quarter of 2023. This particular segment demonstrated a robust financial performance, as evidenced by an 8% growth in sales compared to the previous year. The expansion was driven by increased demand in diverse markets, which was impacted by heightened storm activity, a favorable product composition, and favorable pricing.
Both adjusted EBIT and adjusted EBITDA increased by approximately 6.4% and 5.9% annually, respectively, during this quarter. Furthermore, in comparison to the prior year, the adjusted EBIT and adjusted EBITDA margins experienced a growth of 200 basis points each.
Moreover, Owens Corning has been making substantial investments in the development of new products and processes as a means to assist its consumers and foster additional expansion. Production is anticipated to increase due to the organization's current product portfolio and initiatives to improve efficiency; furthermore, the company's ongoing endeavors to introduce new products appear auspicious.
Strategic initiatives aimed at enhancing overall performance have been executed, with particular emphasis on the Insulation business. Notably, the technical and other building insulation segments have exhibited robust performance. To expand its global product line, the organization continues to invest in novel insulation materials and systems for non-residential applications.
Owens Corning encounters obstacles, nevertheless, as a result of its substantial reliance on housing market demand. The housing sector is presently confronted with obstacles stemming from elevated mortgage rates and inflationary forces affecting materials, energy, and transportation. Additionally, labor constraints continue to be an issue.
Let’s see the upcoming performance of this stock from the OC technical analysis:
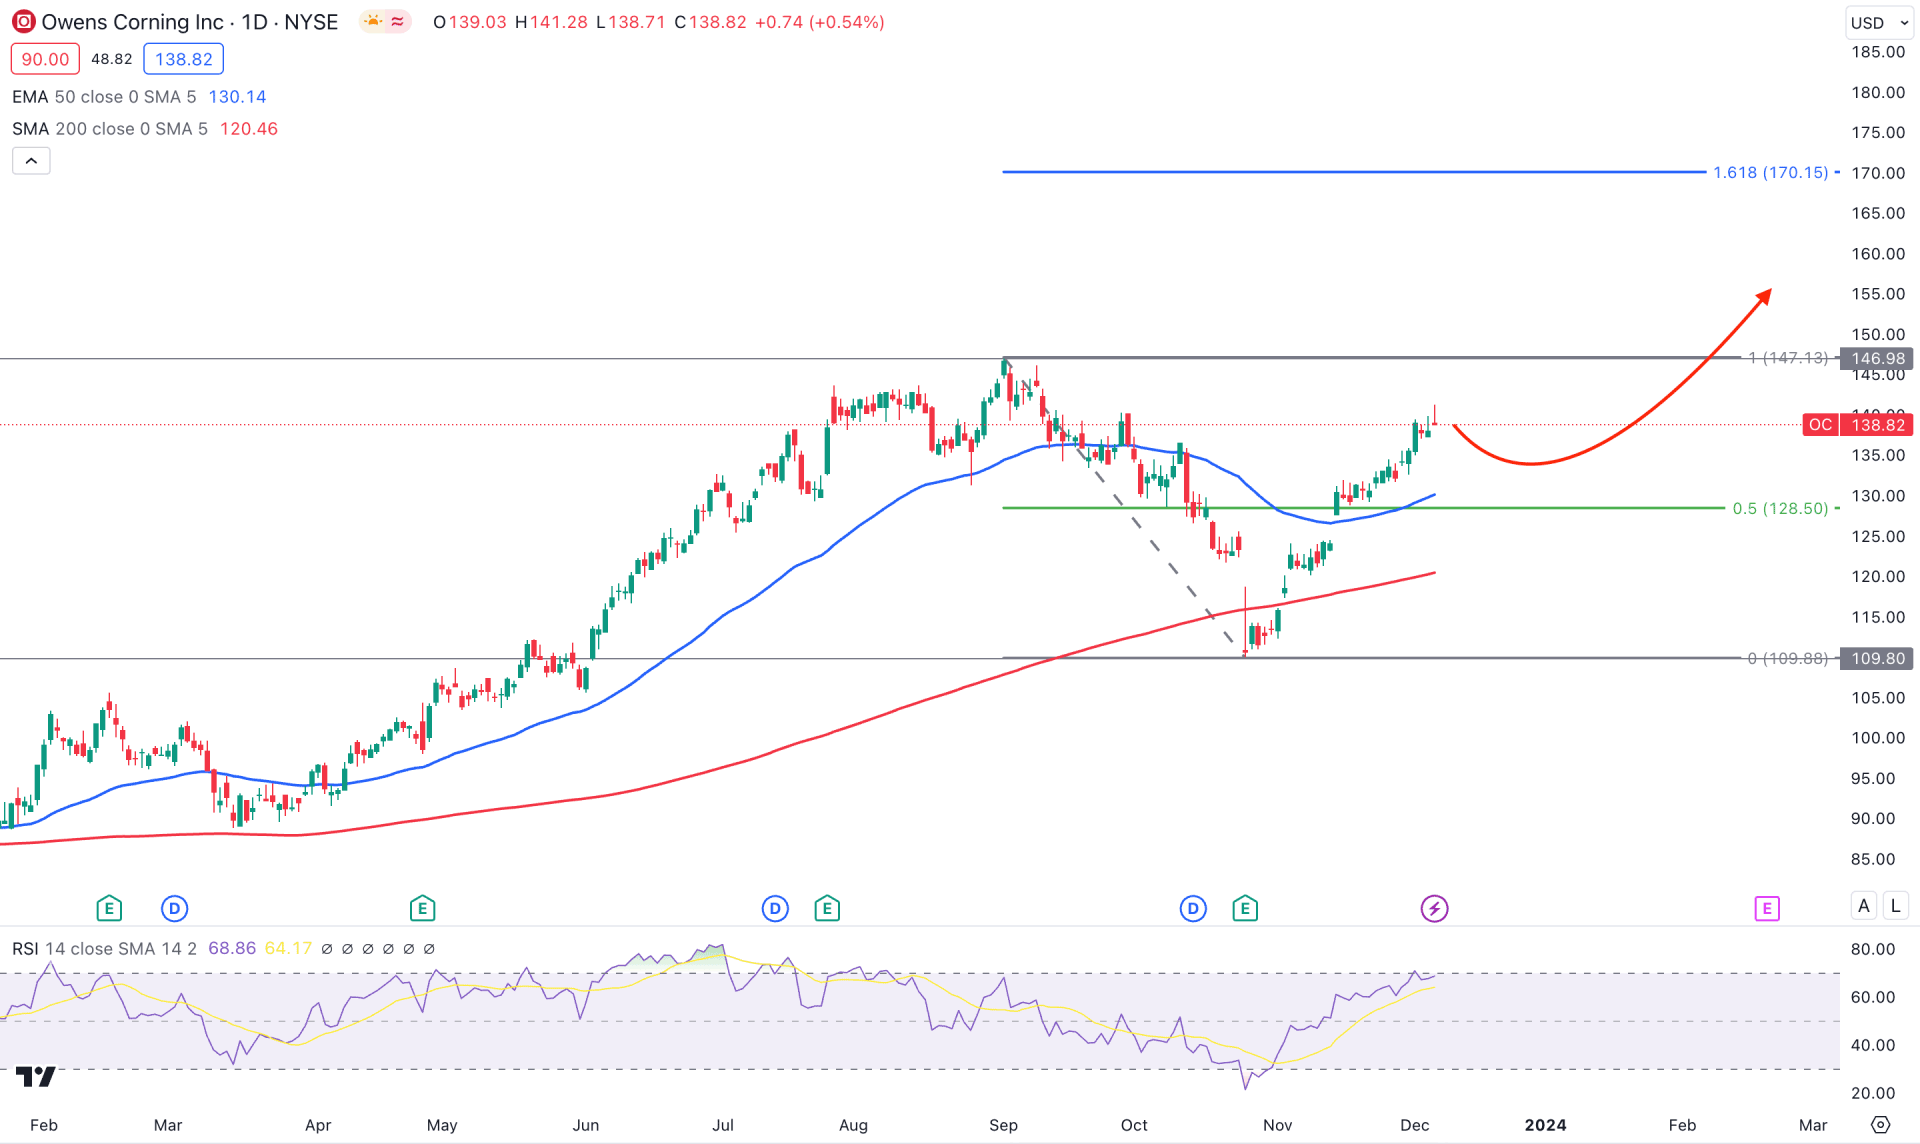
In the daily chart of OC, the overall market direction is bullish as the long-term trend shows consecutive higher high formations. In this context, the best approach is to look for long trades from reliable dips.
In the monthly time frame, the November close came as an immediate bullish reversal, which eliminated all losses from the previous month. A clearer view is visible in the weekly chart, which suggests a potential bullish V-shape recovery. However, the long-term direction might need validation from the daily chart.
An ongoing bullish continuation is present in the daily chart as the dynamic 50-day Exponential Moving Average works as an immediate support. Moreover, a bearish pressure below the 200-day SMA with an immediate recovery indicates a confluence support for bulls. Based on the daily outlook, a Golden Cross continuation strategy could be a decent trend trading opportunity, which needs proper validation from the intraday chart.
The 14-day RSI suggests ongoing buying pressure as the current reading is at the 70.00 overbought level. However, investors should monitor how the RSI line remains above the 70.00 line, from where a reversal is possible. Primarily, a divergence is seen with the main price chart, which needs a validation from the candlestick chart before anticipating a bearish correction.
Based on the daily outlook of OC, the ongoing buying pressure has a higher possibility of reaching the 170.15 level, which is the 161.8% Fibonacci Extension level from the recent swing. However, a downside correction is possible, where a failure to hold the price below the dynamic 50 EMA could be another long opportunity.
On the other hand, if the price comes below the 50 EMA and consolidates, it may extend the loss below the 200 DMA level. Moreover, a daily close below the 108.00 level could open the room for reaching the 90.00 psychological level.
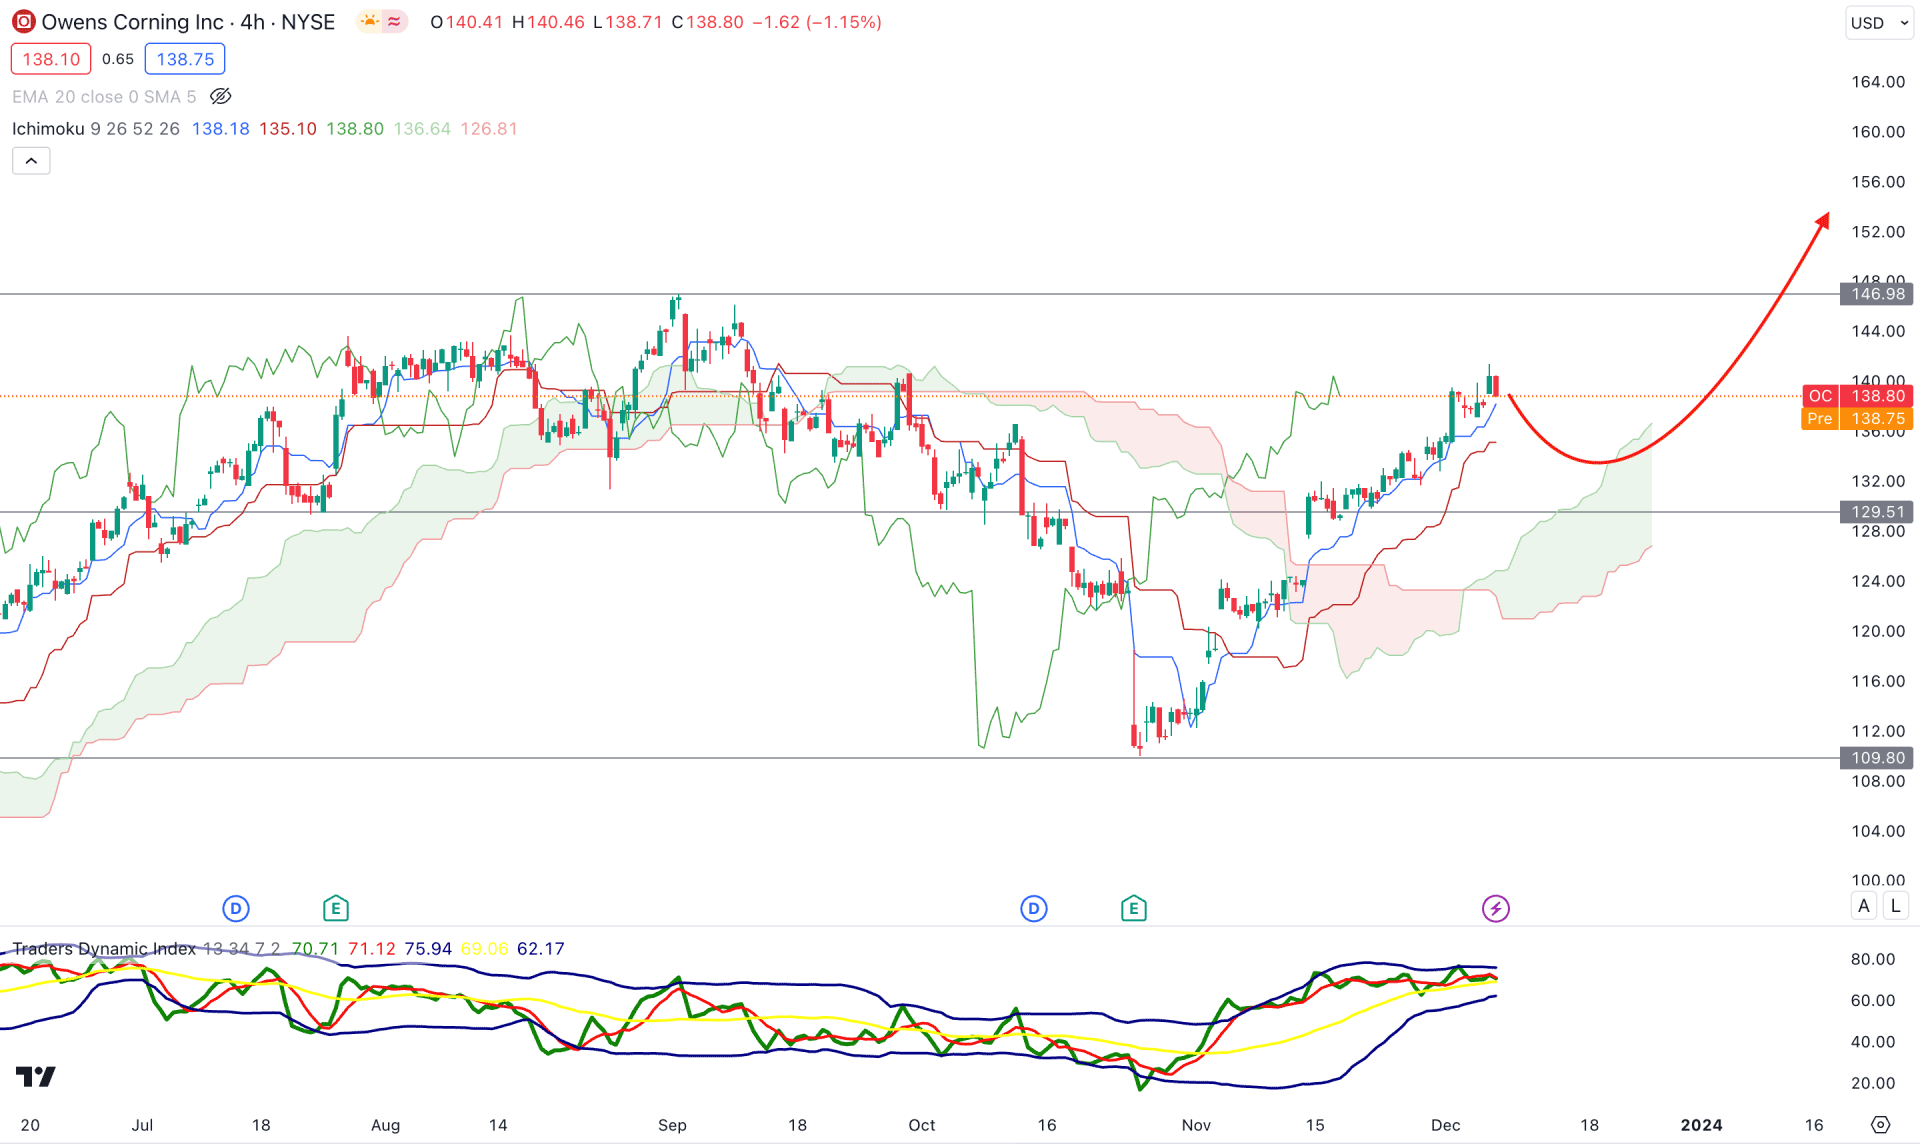
In the H4 timeframe, an impulsive bearish pressure with an immediate bullish recovery suggests buyers' presence in the market. Moreover, the future cloud's position indicates how bulls are active in the market. The Senkou Span A and B show an upward slope, which indicates a strong bullish signal for the coming days.
In the secondary window, a bullish corrective pressure is visible at the TDI indicator, where the current reading is above the 50.00 line.
Based on this outlook, investors should closely monitor how the price trades at the Kijun Sen support. A bullish rejection from the 133.00 to 129.00 area could be a potential long opportunity, targeting the 164.00 level.
On the other hand, a break below the 124.00 level could be a strong bearing opportunity, which could lower the price towards the 100.00 area.
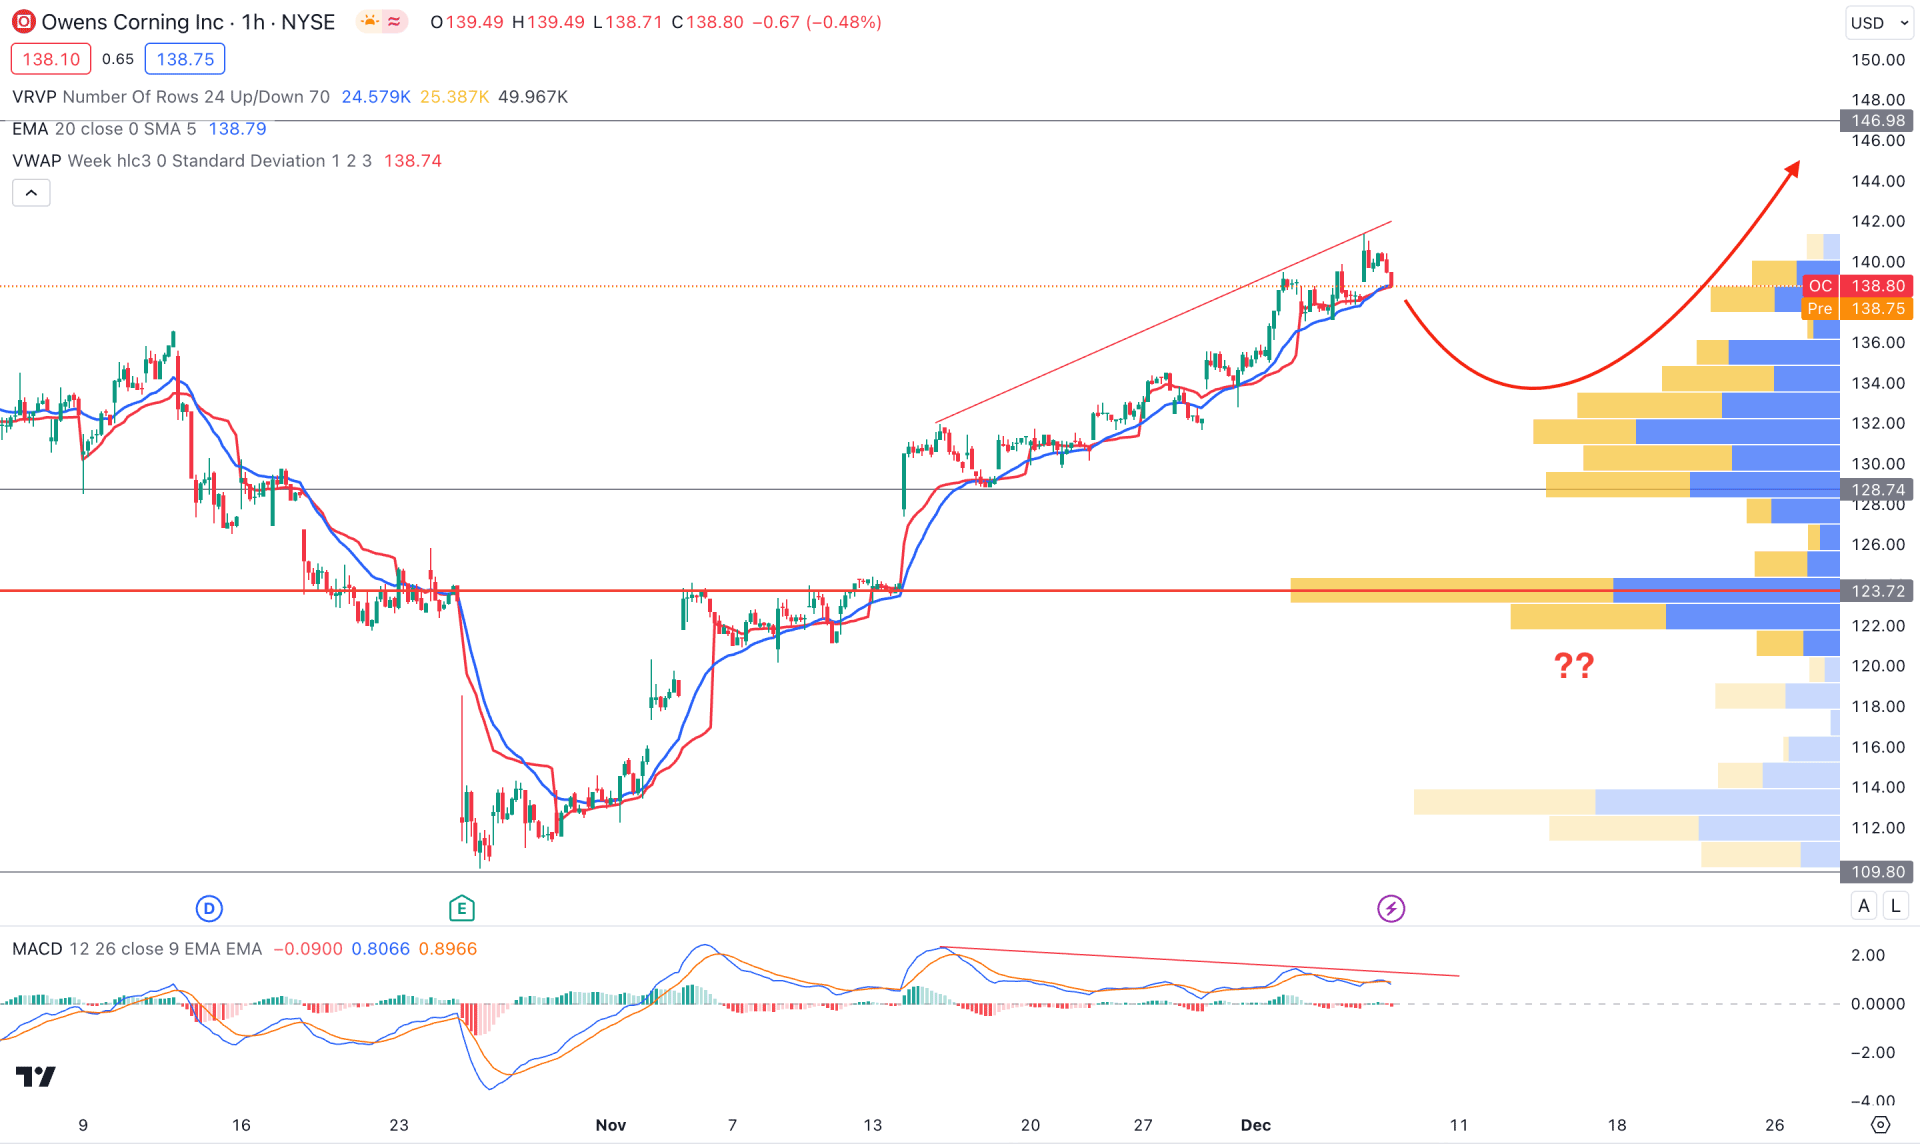
In the hourly chart, the overall market trend is bullish as the recent price trades are above the visible range's high volume level. However, a downside correction is pending as a mean reversion with the high volume level, where the 20 EMA is a primary barrier.
Based on this outlook, the ongoing divergence with a bearish H1 candle below the dynamic VWAP could be a short-term bearish opportunity in this stock. However, a bullish recovery is possible if the price shows a rebound from the 132.00 to 122.00 area with a candle close above the 20 EMA.
Based on the current market outlook, OC has a higher possibility of extending the bullish trend and reaching the crucial Fibonacci Extension level, as shown in the daily chart. However, an early bullish opportunity might come from the intraday chart, depending on the price action.


