
Published: December 9th, 2025
The price of Oracle's stock has decreased from its September peak of $345 to its current price. Its market capitalization has plummeted from $934 billion to the existing $620 billion as a result of this catastrophe.
Due to investors' continued concerns about OpenAI's dealmaking, which currently involves partnerships valued over $1.3 trillion, Oracle's share price has plummeted in recent months. The corporation won't turn a profit until 2030 and will need to raise more than $200 billion in assets, according to a recent estimate from HSBC.
Additionally, after taking out large loans to fund the expansion of its AI data center, Oracle's bond rates have increased. Recently, it borrowed more than $18 billion, increasing its overall debt to more than $100 billion. In fact, as worries about its operations persist, bond yields have increased.
Oracle's earnings, which are expected later this week, will be the next significant driver of the company's stock price. According to analysts, revenue increased by 15% to $16.20 billion in the most recent quarter, maintaining a long run of double-digit sales growth.
The corporation is anticipated to produce $16.87 billion in the upcoming quarter, a 20% yearly rise, according to the guidance.
Oracle's profits per share, which increased to $1.64 in the most recent period from $1.47 in the equivalent period previous year, are anticipated to continue growing. However, Oracle failed to make three of the previous four projections, suggesting that this quarter's pattern might continue.
The company's extreme overvaluation, as seen by its projected value-to-earnings ratio increasing to 44.43 from the median over the past five years of 30, is another significant obstacle to the price of Oracle's stock.
Can Oracle surprise investors with a strong earnings growth? Let’s see the full outlook from the ORCL technical outlook:
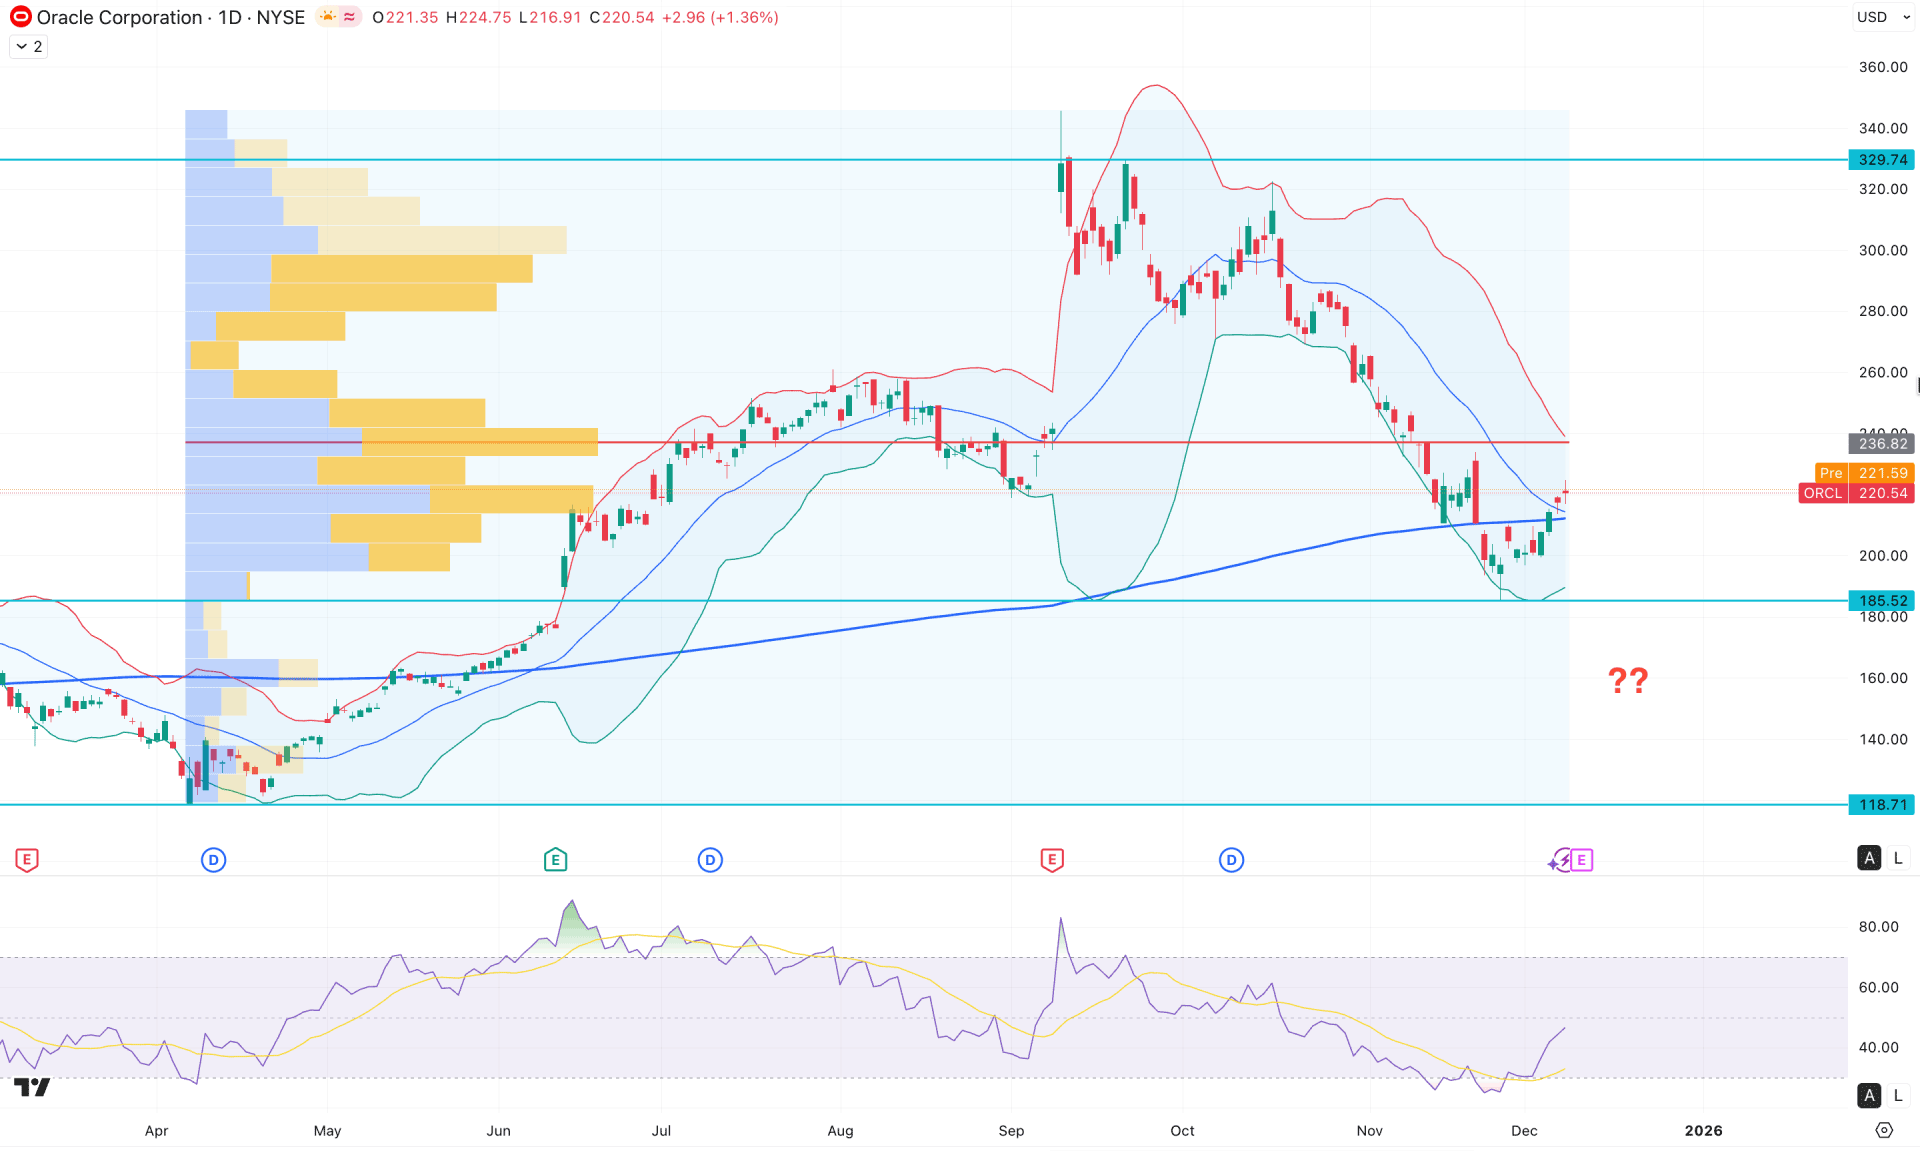
Oracle Stock (ORCL) is trading lower after finding a peak at the 329.74 level. As the most recent price is moving at a discount, investors should closely monitor how the price reacts in the current zone before anticipating a bullish continuation opportunity.
In the higher timeframe, the momentum is strongly bearish, as two consecutive strong bearish monthly candles are present. However, the most recent price is still trading above the 200.28 monthly flip zone, which signals a possible bullish rebound. On the weekly chart, two consecutive bullish candlesticks have formed near the current area, but more confirmation is needed before expecting a bullish scenario.
In terms of volume, the bearish momentum remains active, as the largest activity level since April 2025 is positioned above the current price. Since no significant buying pressure is visible above the high-volume line, investors may need additional clues before considering long positions.
On the main price chart, a strong bullish rebound is visible from the 165.52 key support level, along with a valid recovery above the 200-day simple moving average. The failure to sustain momentum below the 200-day SMA, followed by an immediate bullish rebound, signals a possible bottom formation from a higher level, increasing the probability of further upside continuation.
In the indicator window, the Relative Strength Index has moved out of the oversold area and approached the 50.00 neutral point. However, the trend strength remains unclear, as the Average Directional Index is losing slope, even though it remains above the 20.00 threshold.
Based on the overall market structure, Oracle stock needs further confirmation before offering a clear long opportunity. However, the recent rebound from the 200-day SMA with a daily close above the mid-Bollinger band signals the potential for continuation toward the 236.82 high-volume line. Moreover, a strong breakout and consolidation above this high-volume zone could open the path toward the 329.74 key resistance level.
On the other hand, failure to hold the price above the 200-day SMA, followed by an immediate bearish rebound below the 200.00 psychological level, may create a challenging environment for buyers. In that case, a downside continuation opportunity could emerge, with the ultimate target expected near the 118.71 support level.
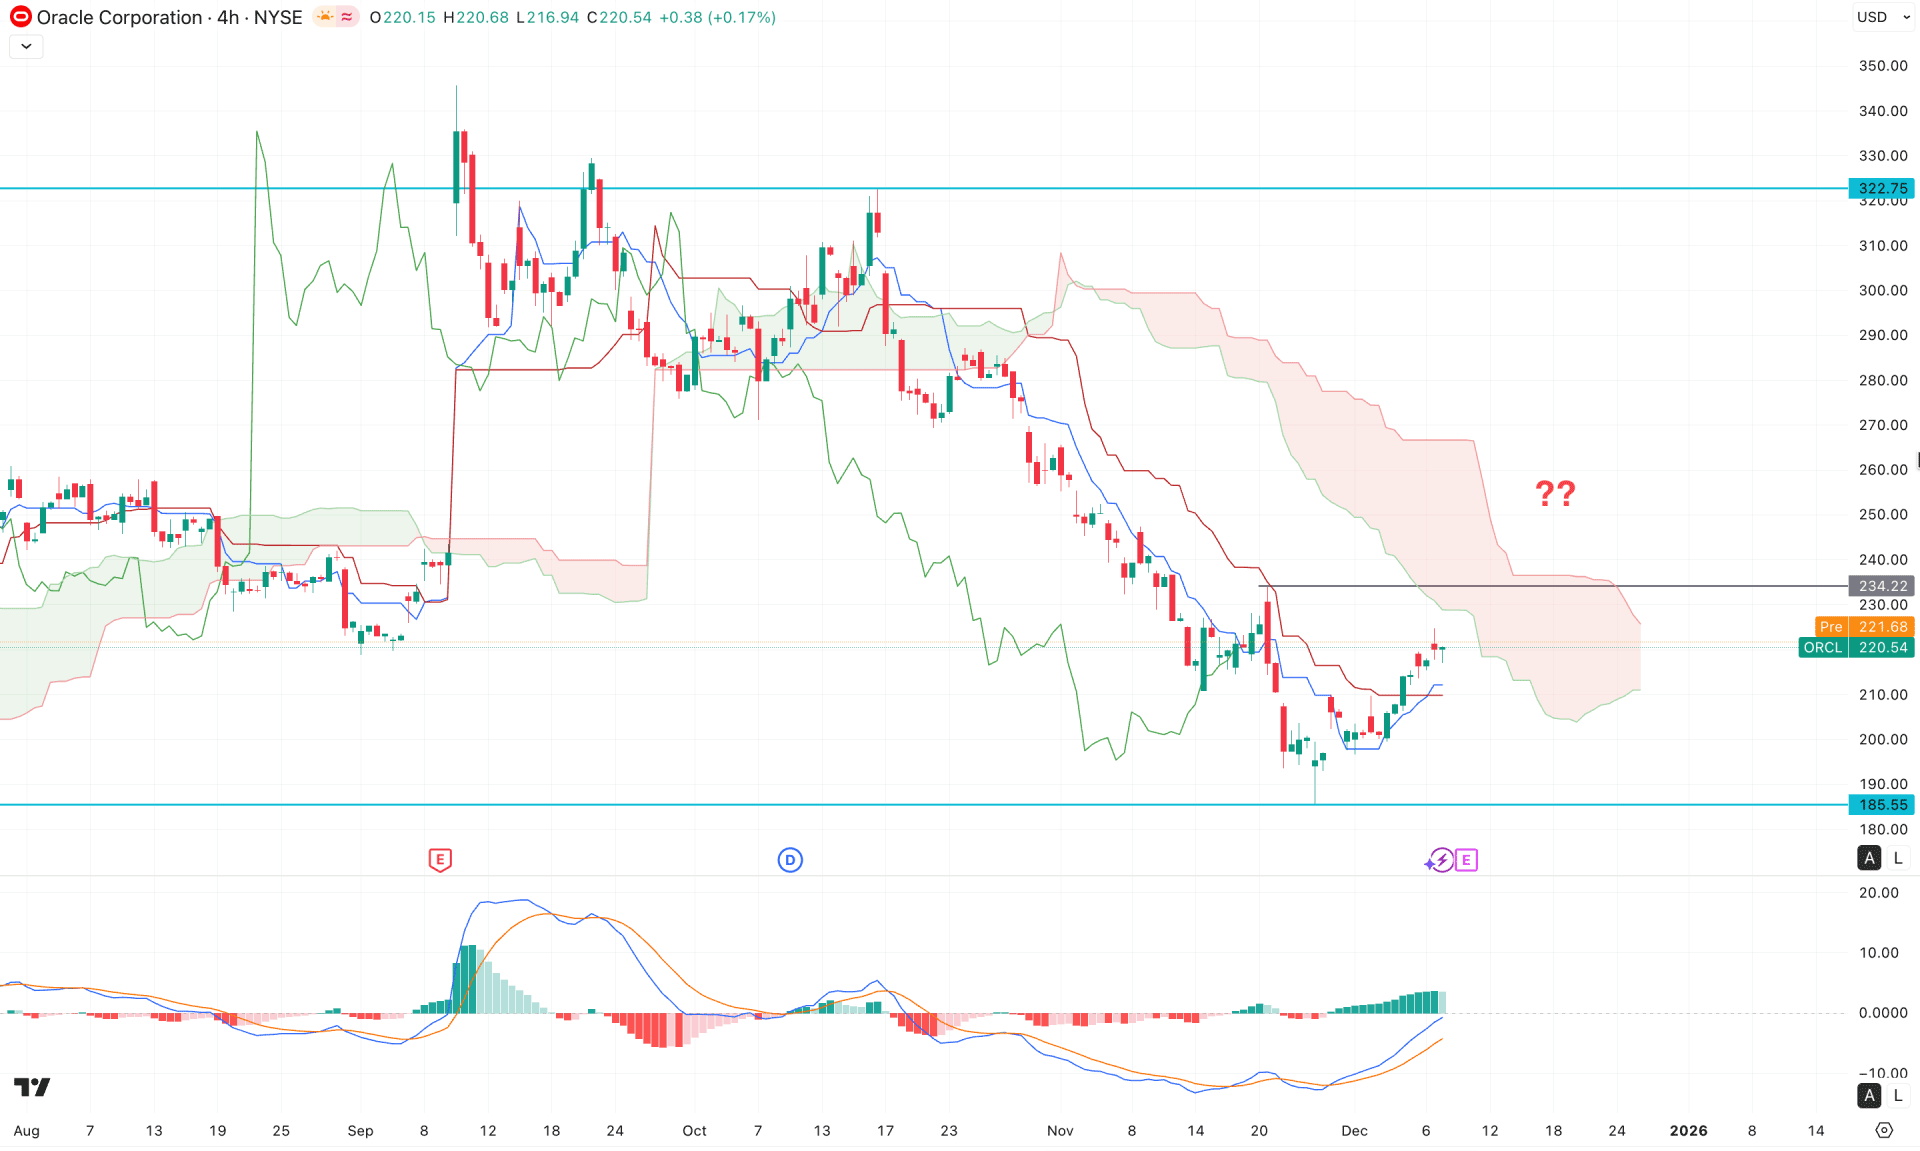
In the four-hour timeframe, an ongoing bearish trend is visible, as the most recent price is showing corrective bullish pressure below the cloud area. Although the thickness of the future cloud is not strong enough to confirm a bearish continuation, the price is still trading within bearish territory.
In the secondary indicator window, the MACD histogram has regained momentum by remaining in the positive zone for a considerable period. Moreover, the signal line has formed a bullish crossover, followed by a divergence at the bottom, which could act as a strong bullish reversal signal.
Based on the overall market structure, a bullish rebound above the 234.72 resistance level, followed by consolidation, could validate a cloud breakout. This scenario may increase the possibility of pushing the price beyond the 300.00 psychological line.
On the other hand, the ongoing corrective bullish pressure requires close attention, as an immediate bearish four-hour close below the key swing level could extend the downside pressure toward the 185.55 swing low.
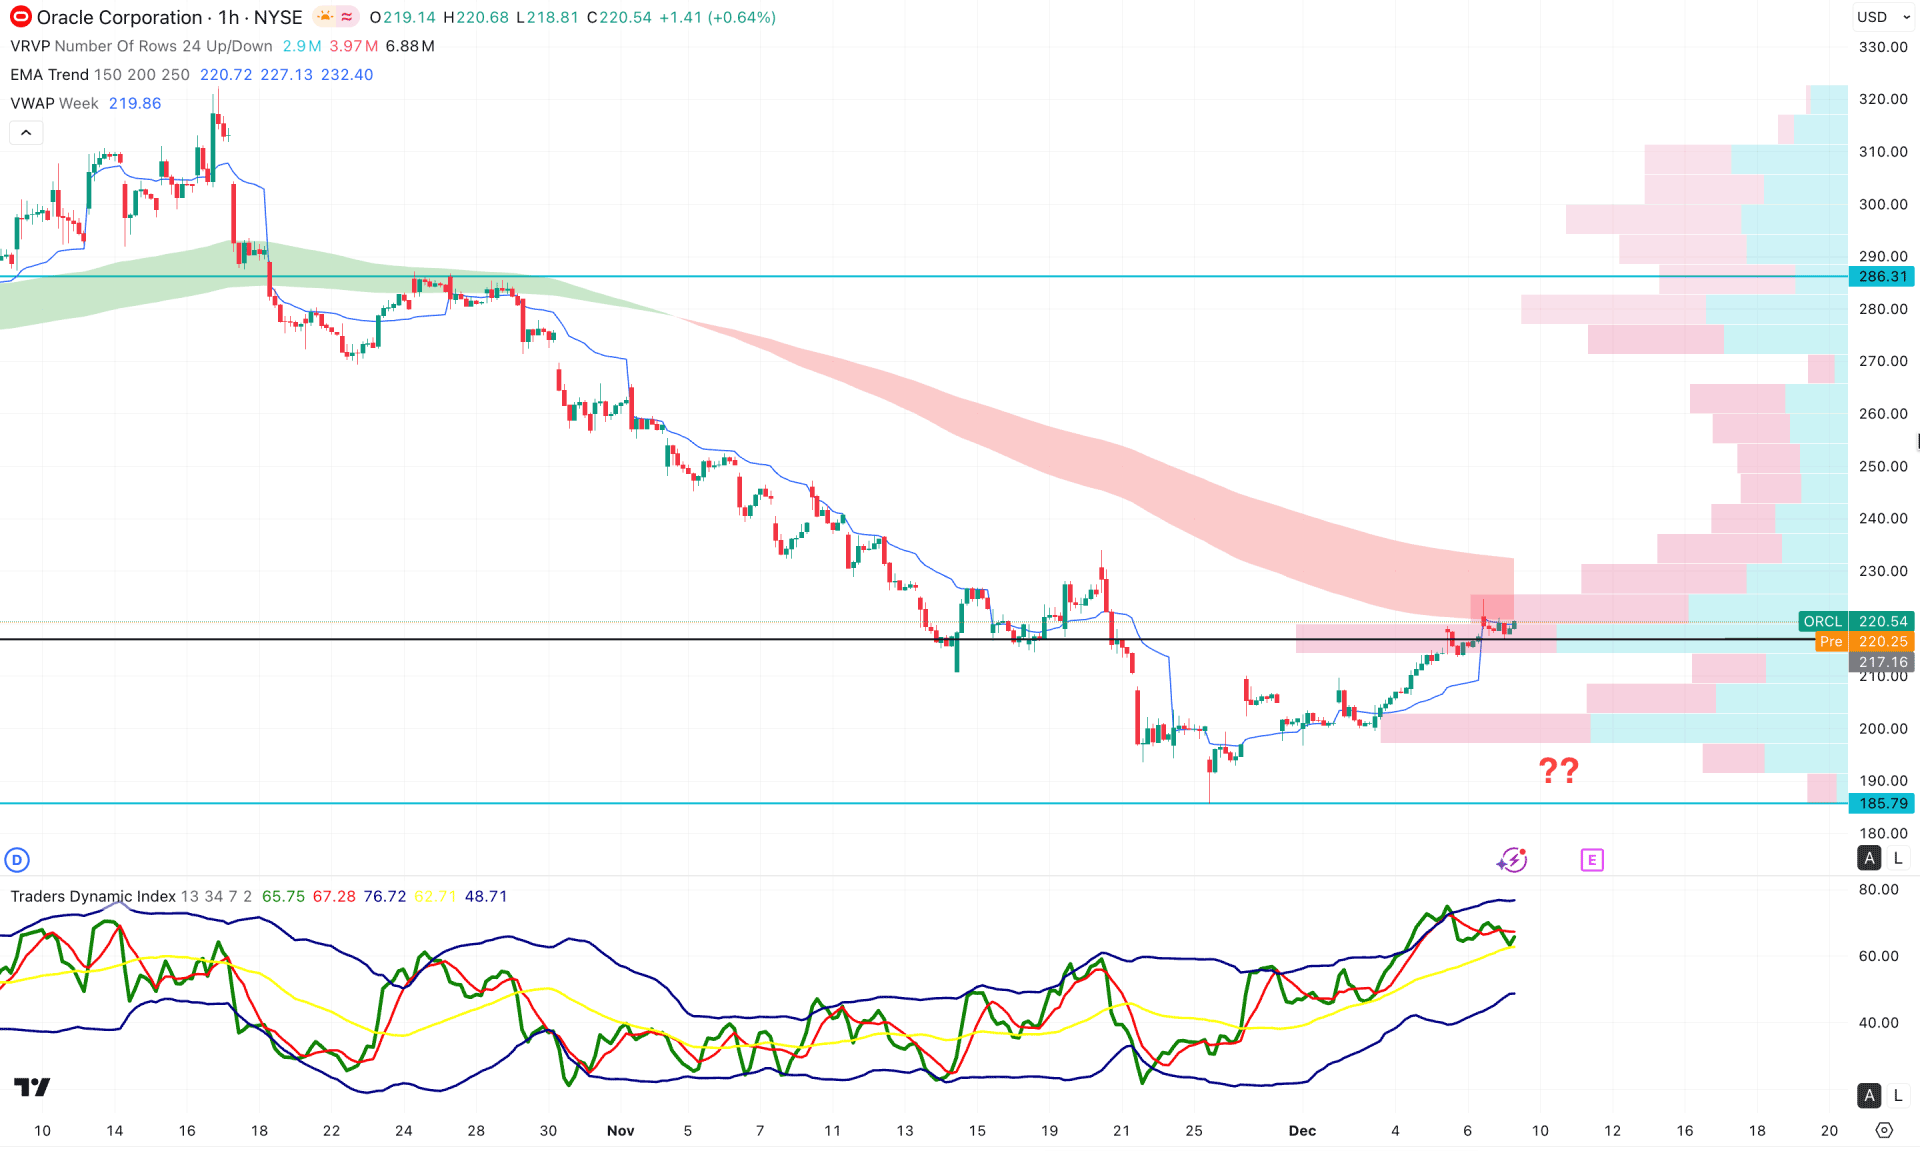
In the hourly timeframe, the recent price is trading within a sideways moment as the price found resistance from the high volume intraday line.
Moreover, the Exponential Moving Average wave is above the current price, working as a crucial resistance.
In the secondary indicator window, the Traders Dynamic Index (TDI) has reached the upper peak area, suggesting a strong bullish momentum.
Based on this outlook, the major market momentum is sideways, where bullish pressure needs a proper validation from the high-volume area. A bullish break with an hourly close above the EMA wave could validate the long opportunity, targeting the 286.31 resistance level.
On the other hand, the ongoing selling pressure is valid, and further downside momentum could come below the 200.00 psychological line.
Based on the major market outlook, ORCL is more likely to extend the buying pressure once a proper validation comes from the daily breakout. As the intraday price is still bearish, a solid recovery with a positive earnings report could be a decent investment opportunity.


