
Published: September 15th, 2022
Oracle stock traded from the $63.48 low to the $105.06 high in the last 12 months. The recent selling pressure near the bottom raised the question of whether the stock could make a new low or will rebound from here.
This week, the company released its quarterly earnings report showing a 4.17% decline in earnings per share to $1.03. However, the revenue comes higher than the expectation of $11.33 billion, coming at $11.44 billion.
The quarterly earnings report came with strong selling pressure in the Oracle stock, where a massive 4.87% loss was seen a day after the earnings report release.
On the other hand, the earnings growth for this stock remained steady over the last year, where a significant 19% operating loss was seen in the latest quarter. Moreover, the equity growth section in the statement of financial position is not supportive, where a massive -382.21% change was reported.
Should you try selling the Oracle stock? Let’s see the future price direction of Oracle stock from the Oracle stock (ORCL) technical analysis:
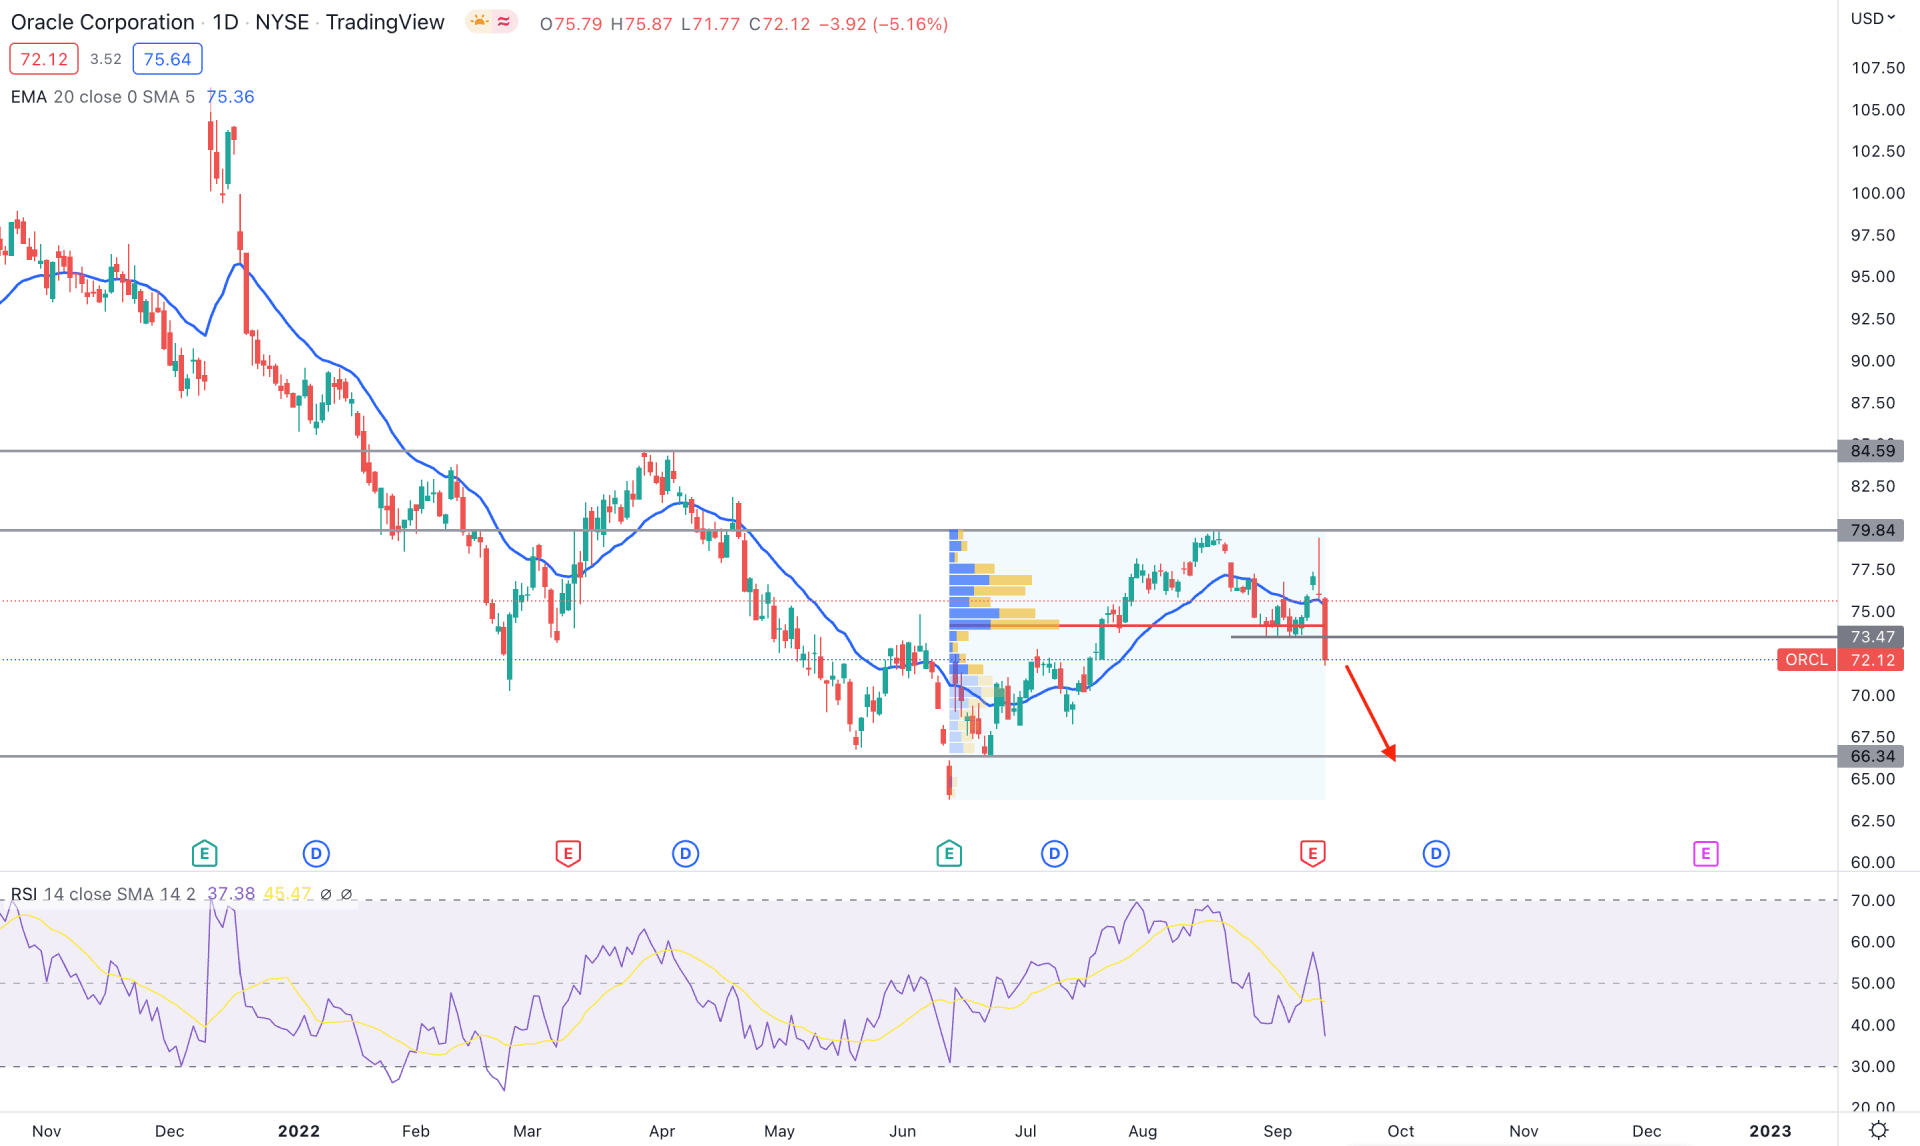
Oracle stock (ORCL) has traded in a bearish trend since the beginning of 2022, where the recent selling pressure after grabbing the buy-side liquidity came with a potential short opportunity.
According to the fixed range volume indicator, the highest trading volume from June 2022 low to September 2022 high is at 74.19 level, above the previous daily candle close. Moreover, the highest trading volume level indicates sellers' momentum on Wednesday's close, which is higher in volume in the last 3 months. It is a clear sign that bears are active in the market, and any selling opportunity is likely to provide a higher return than buys.
The price traded above the 73.47 swing low before the earnings report release and shot higher above the dynamic 20-day resistance level. However, bulls failed to hold the momentum and rebounded with bearish exhaustion. Now, the dynamic 20-day Exponential Moving Average has become the immediate resistance from where a bearish opportunity may come.
In the indicator window, the Relative Strength Index moved below the 50% level, where testing the 30.00 oversold level is pending. In this market context, the primary aim is to find a bearish opportunity in the intraday price, aiming toward the 60.00 level. On the other hand, a buying pressure above the dynamic 20 EMA with a bullish daily candle is needed to aim toward the 84.59 resistance level.
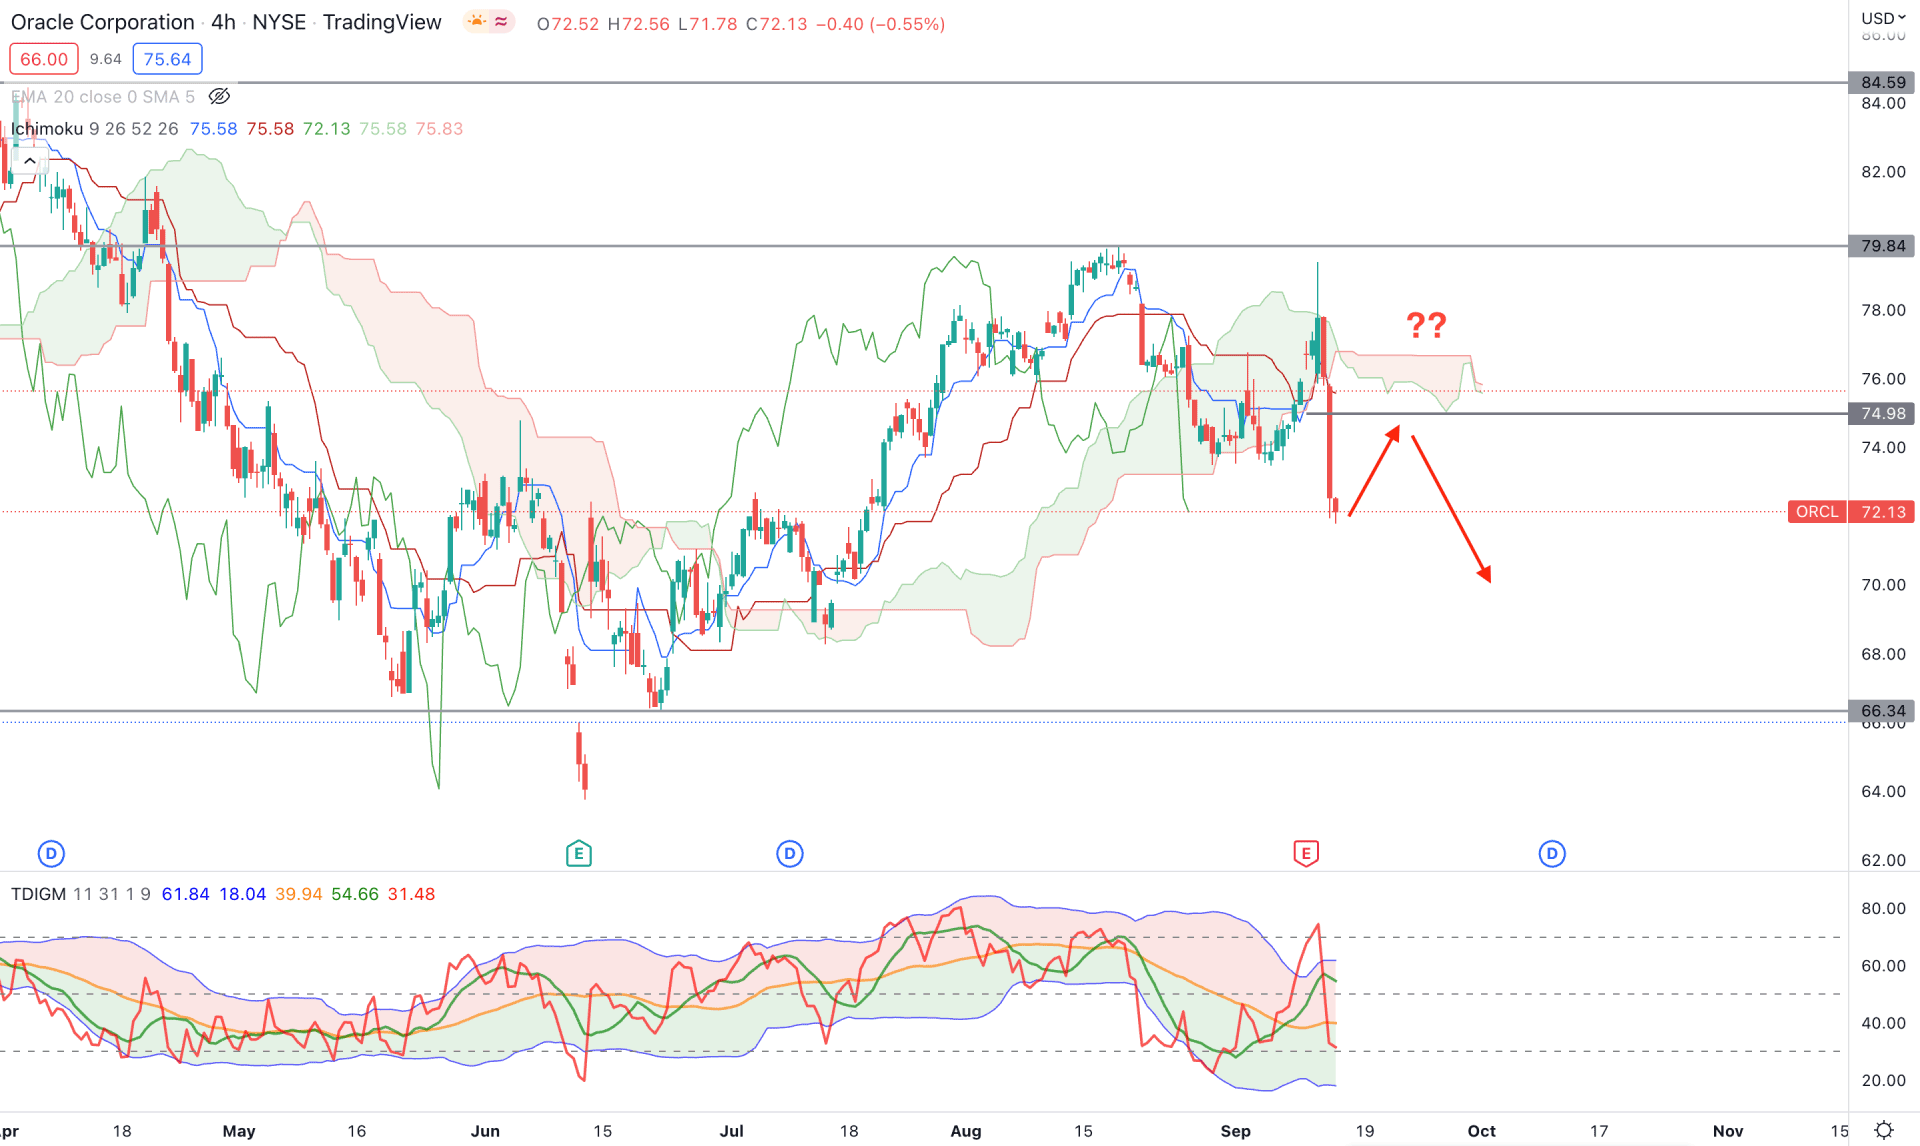
In the H4 timeframe, Oracle stock (ORCL) is trading bearish below the dynamic Kumo Cloud, from where massive bearish exhaustion appeared. As a result, a selling pressure with an impulsive momentum came below the 74.98 level, which may extend in the coming days.
In the future cloud, the Senkou Span A and B are closer together where the Lagging Span is below the Cloud area. The indicator window shows how the TDI line moved below the 50% level, indicating an increase in sellers' presence in the market. Moreover, the price moved below the dynamic Kijun Sen and formed a strong bearish H4 candle, another sign of possible selling pressure.
Based on the h4 price prediction, a minor bullish correction is pending, but the area of 73.00 to 75.00 should be monitored from where any bearish rejection could open a short opportunity. On the other hand, a bullish break above the 79.89 level would eliminate the current bearish opportunity, and increase the possibility of reaching the 90.00 level.
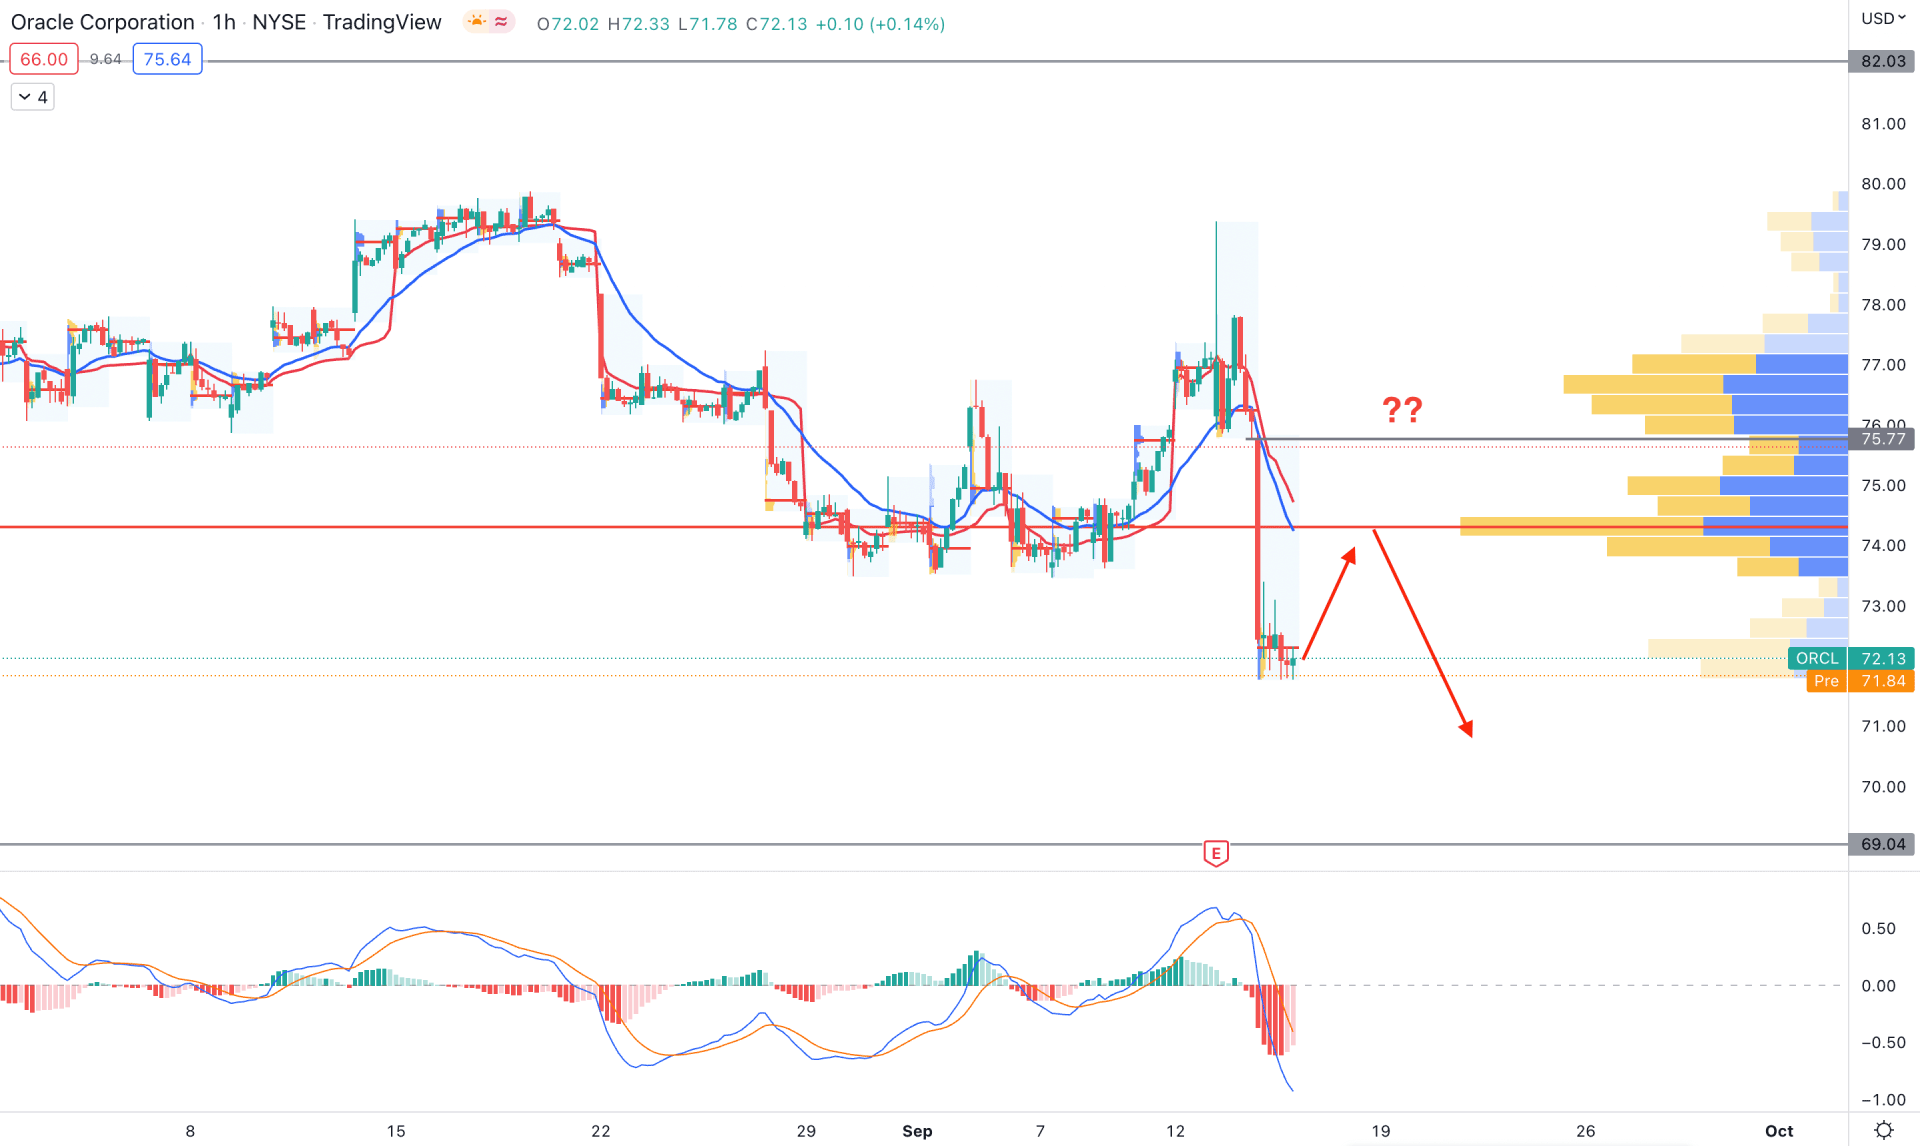
In the Oracle stock H1 chart, the current price is trading under a strong bearish pressure led by a strong seller momentum from the quarterly earnings report. As a result, the highest trading volume level appeared at 74.30 level, where any bearish opportunity below this is potential.
On the other hand, the dynamic 20 EMA and weekly VWAP are above the current price and working as immediate resistances. The MACD indicator shows an extreme selling pressure as the Histogram is below the neutral line while the MACD line reaches the oversold area.
Based on the H1 price structure, a minor bullish correction is pending in this instrument, where further selling pressure from dynamic levels could open a bearish opportunity. In that case, the main aim is to test the 69.00 support level from where bulls may regain momentum.
Based on the current multi-timeframe analysis, Oracle stock is likely to move lower in the coming days, where any bearish opportunity from the intraday resistance could provide a decent profit.


