Published: January 17th, 2024
To comprehend the genuine decision-makers at Oracle Corporation (NYSE: ORCL), it is vital to grasp the ownership structure. Institutions hold a significant 44% of the company's ownership, which means that the outcome of the company's success or failure is highly relevant to the fate of their investment.
Oracle maintains a significant institutional ownership base, signifying that analysts from these establishments have scrutinized the stock. As with any analysis, the possibility of error cannot be entirely ruled out. Rapid price fluctuations can occur when multiple institutions simultaneously alter their perspectives.
According to available data, the majority ownership stake is held by Lawrence Ellison, the Top Key Executive of the organization, with 42%. The substantial level of insider ownership is typically perceived favorably, as it signifies the insiders' dedication to the organization's long-term success. The Vanguard Group, Inc. and BlackRock, Inc., which hold 5.4% and 4.4% of outstanding shares, respectively, follow attentively.
Regarding insider ownership, in which board members are regarded as insiders, a significant consolidation of power exists within this faction. Oracle is a notable company wherein insiders possess a considerable US$120 billion stake in a venture valued at US$286 billion.
However, it might not be enough to consider the Oracle stock as a strong buy. Investors should know how the price trades in the technical chart before forming a valid signal.
Let’s see the upcoming price direction from the ORCL technical analysis:
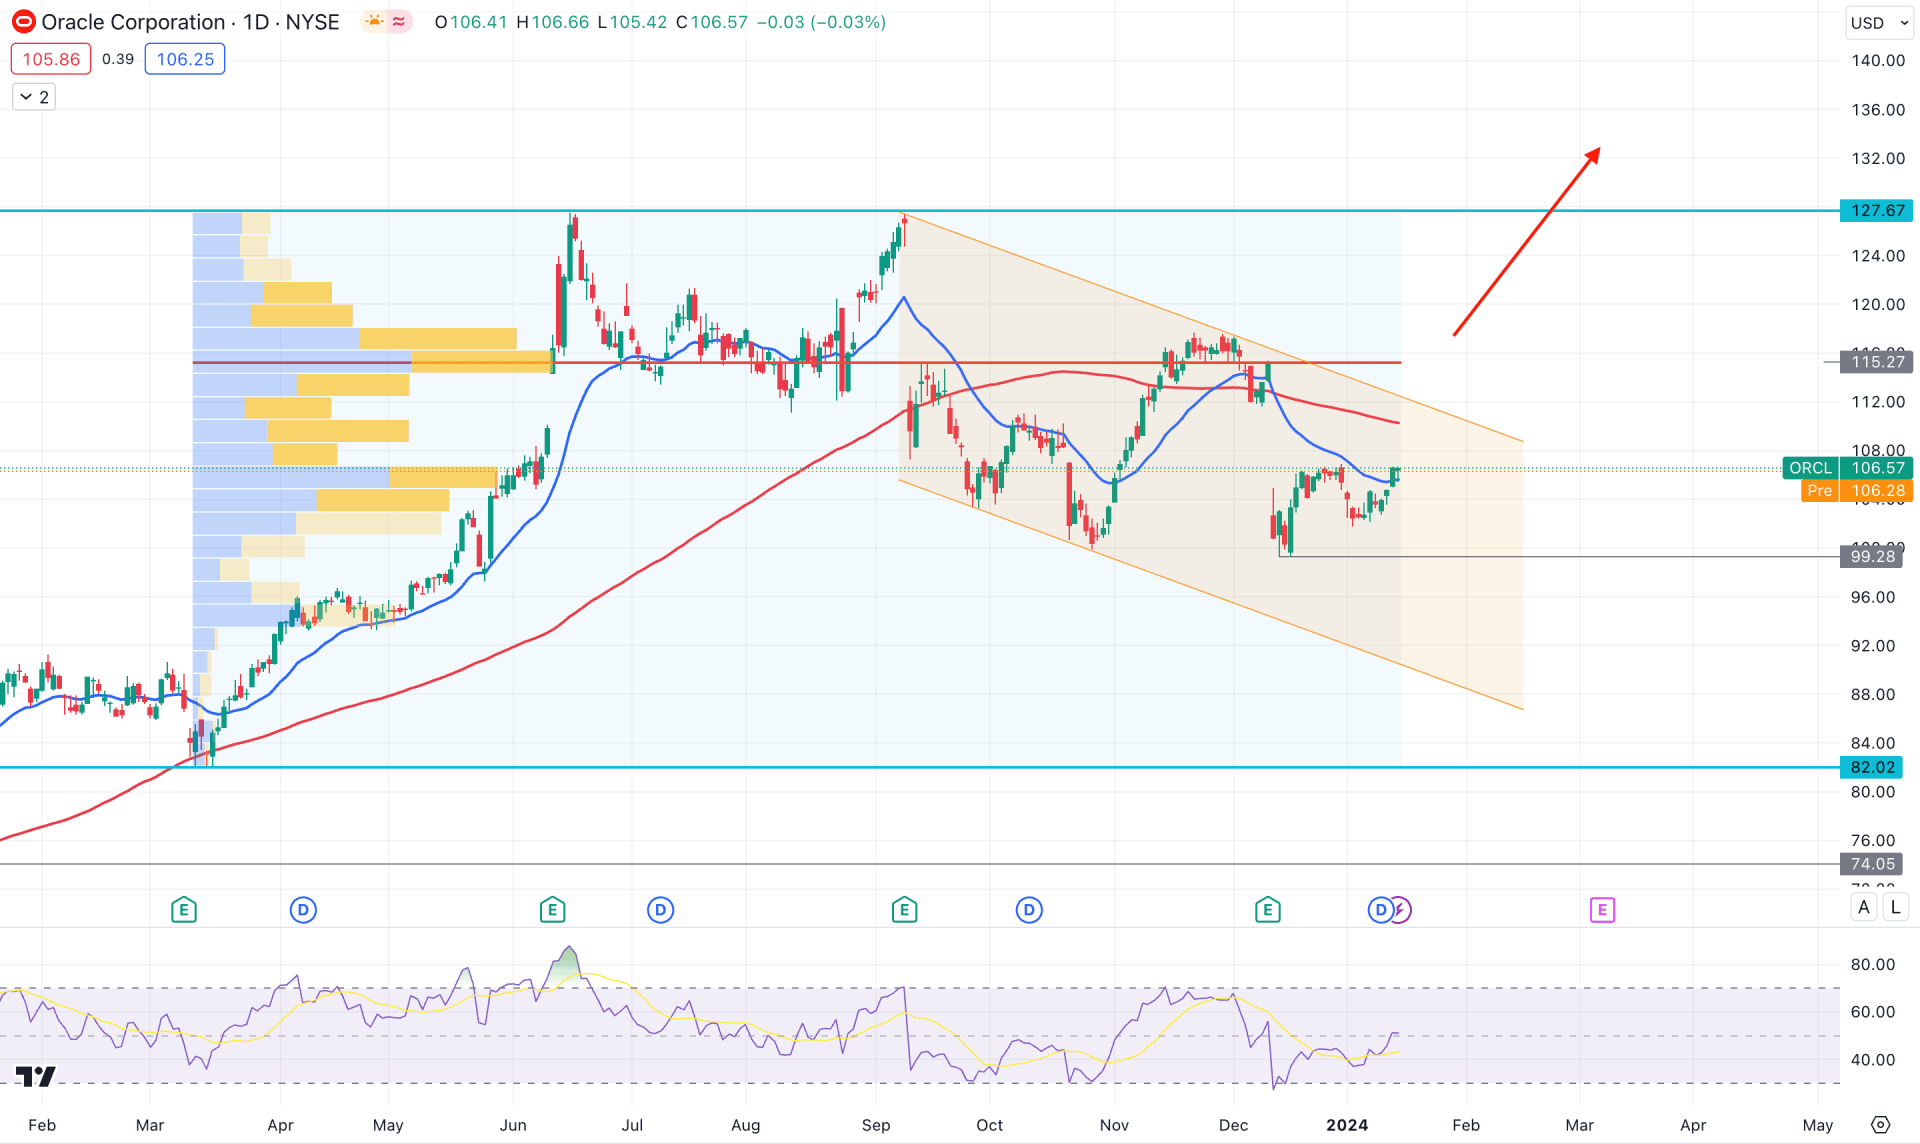
In the daily chart of ORCL, the long-term market trend remains bullish, while the most recent price trades under corrective bearish pressure. In that case, the ideal trading approach for this stock is to wait to eliminate the downside correction and follow the long-term bullish trend.
The current buying in the monthly candlestick pattern is questionable from the bearish two-bar reversal on the December close. Therefore, a new low below the 99.30 low could be a strong bearish signal for this stock. Moreover, the weekly chart shows corrective price action, where more downside correction is pending.
In the volume structure, the highest activity level since the March 2023 low is at 115.35 level, which could work as a major resistance level. Investors might expect downside pressure to continue as long as the price trades below this line.
Coming to the daily chart. The 100-day Simple Moving Average is above the current price, which is a strong resistance. Moreover, the bullish recovery is visible above the 20 DMA, which indicates a short-term buyers’ presence in the market. Moreover, the Relative Strength Index (RSI) moved to the 50.00 line after tapping into the oversold zone, which is an additional signal to the short-term buying possibility.
Based on the daily outlook, investors might expect a bullish continuation after forming a descending channel breakout. In that case, the conservating long approach might come after having a daily candle above the 115.35 high volume level. The primary target of the bull run would be the 127.67 level before reaching the 150.00 level.
On the bearish side, the monthly two-bar reversal could form a short signal after having a daily candle below the December low, extending the selling pressure toward the 74.00 area. Oracle Stock (ORCL) H4 Chart
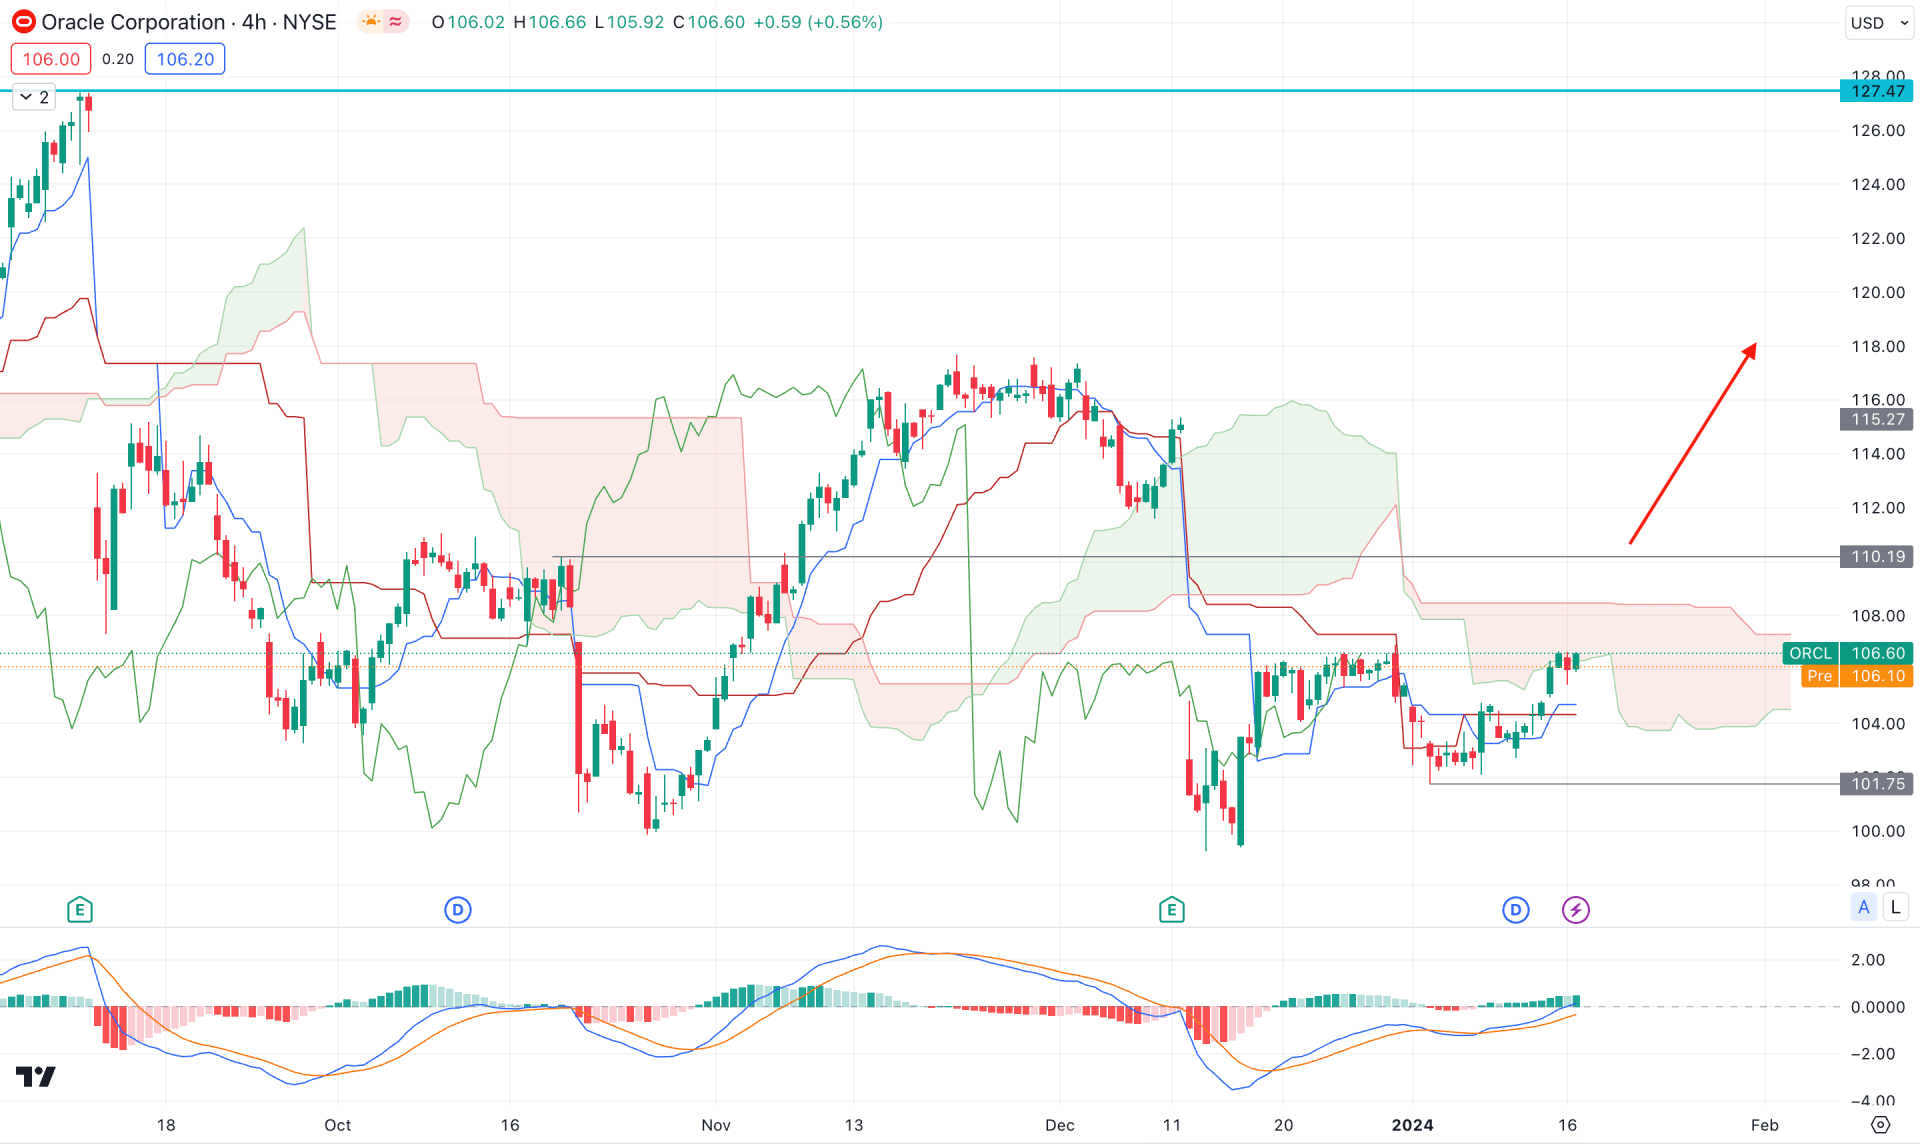
In the H4 chart, a sideways market is visible, where the recent price trades below the Ichimoku Cloud zone after the recent crash from the earnings report. However, no significant selling pressure is visible below the cloud resistance, as the price failed to breach below the 100.00 psychological level.
In the future cloud, both lines show a neutral momentum by remaining sideways, while a bullish crossover is visible among dynamic levels. Moreover, the MACD Histogram is bullish, while the signal line reached the neutral level.
Based on this outlook, a bullish pressure above the cloud area with a daily close above the 110.19 level could be a strong long signal for this stock, which could take the price above the 127.37 resistance level.
On the other hand, investors should monitor how the price holds the 100.00 level as a bearish pressure below this line could lower the price towards the 70.00 level.
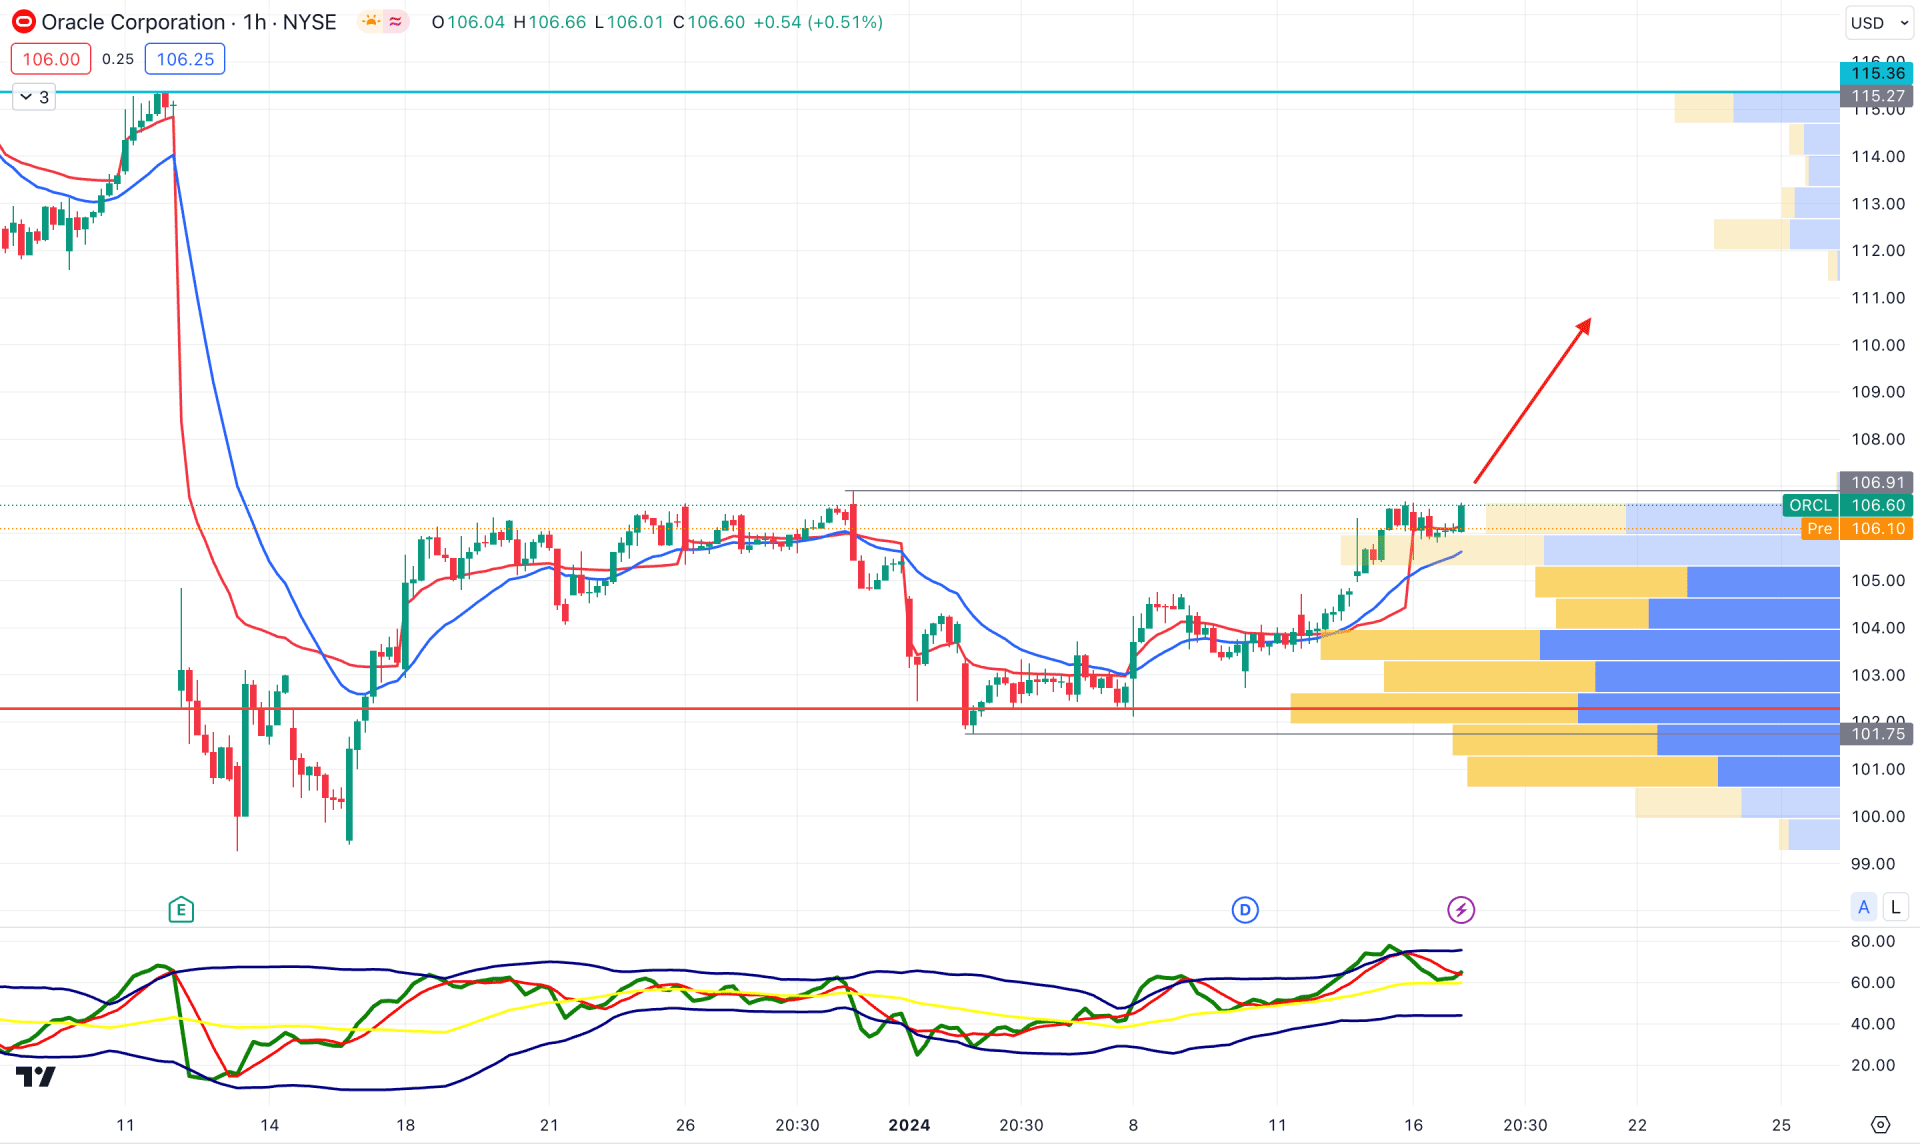
The recent buying pressure is valid in the hourly timeframe as the visible range high volume level supports it. Moreover, the dynamic 20 EMA and weekly VWAP are below the price, working as a confluence buying factor.
In the secondary window, the Traders Dynamic Index (TDI) indicates buyers’ presence in the market as the current reading remains stable above the neutral 50.00 line.
Based on this outlook, a bullish daily candle above the 106.91 swing high could open a long opportunity, targeting the 115.27 level. However, a bearish continuation might come after having a stable market below the visible range high volume level.
Based on the current market outlook of ORCL, a bullish continuation is potent, and investors might expect a strong long opportunity after having a solid signal from the H4 chart.


