
Published: June 10th, 2026
Important updates regarding the status of Oracle's data center construction and the financial effects of its AI pivot will be provided during its fourth-quarter earnings call. Since the company's last earnings release in March, Oracle's stock has increased by 42%.
Analysts predict that this depends on Oracle's (ORCL) AI advancements, capital expenditure levels, and profitability. Hilary Maxson, the new CFO hired in April, will also make her first appearance on Wednesday's results call.
Key fourth-quarter figures for Oracle are expected to be 90% growth in the Oracle Cloud Infrastructure, a 43% margin of operation, and about $36 billion in additional net remaining performance commitments.
For the May quarter, analysts predict $19.1 billion in revenue and $1.96 in profits per share. It is anticipated that there will be $601.1 billion in remaining performance commitments, or inked contracts that have not yet been turned into revenue.
Wall Street predicts that as Oracle's business mix moves toward OCI, an increasingly capital-intensive segment of the company. However, Thill noted that because of cost savings and labor cutbacks, the impact might not be as bad as the consensus predictions.
There were rumors that Oracle was making widespread layoffs in March. TD Cowen researcher Derrick Wood said that 10,000 to 15,000 workers, or 6% to 9% of the staff, were impacted, while the firm declined to comment on the issue.
Let's see the complete price projection from the ORCL technical outlook:
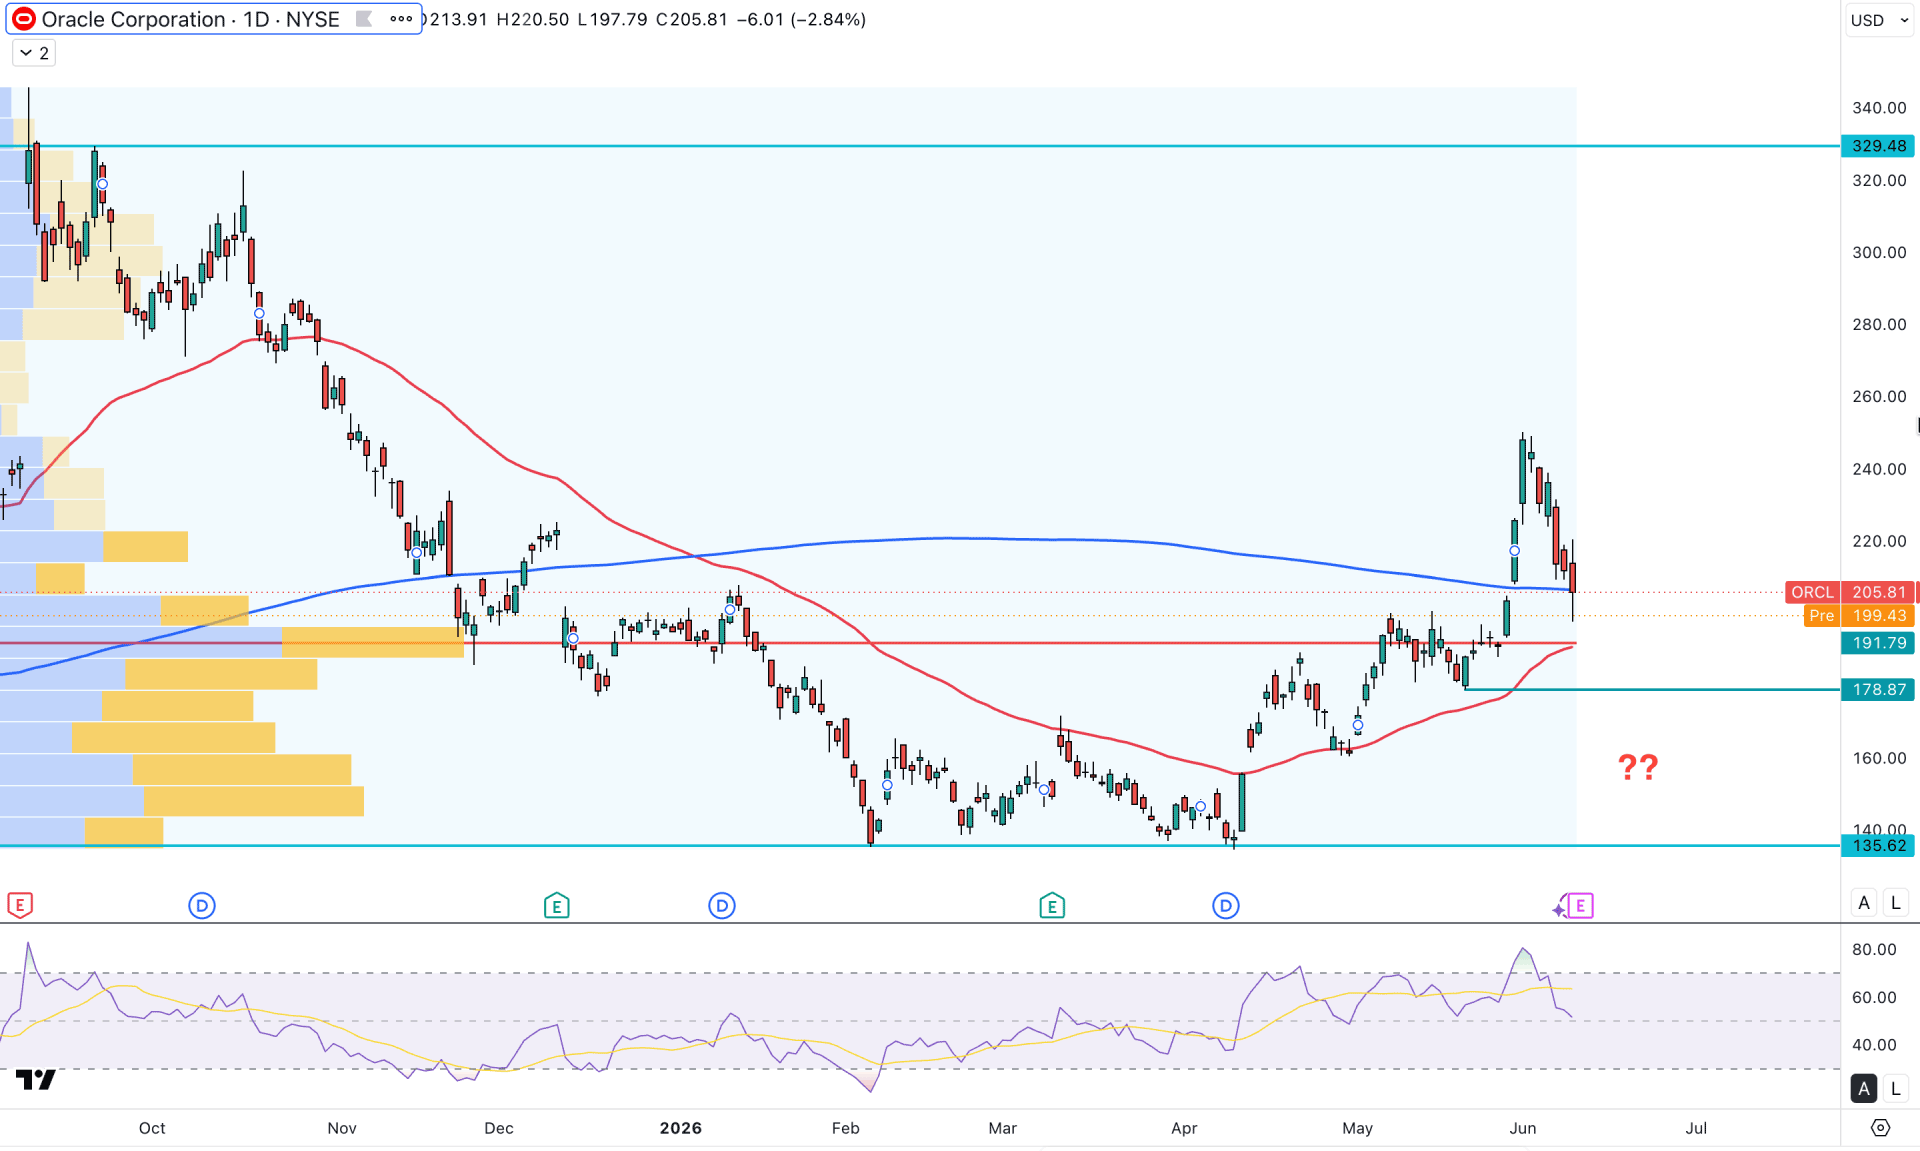
In the daily timeframe, ORCL is trading within buying pressure after having a valid U-shape recovery from the 135.62 bottom. Moreover, a bullish rebound is feasible from a double bottom breakout, which signals a decent long possibility.
In the higher timeframe, the price is trading with a bullish structure as the existing market momentum has been bullish for three consecutive months. As the current price is having a correction after a decent recovery in May 2026, a bottom formation is needed before validating the bullish rebound. The weekly timeframe is bearish after setting a top at the 249.86 level, which is near a reversal zone.
As per the volume structure, the largest activity level since September 2025 is just below the current price, signaling crucial support. As the current buying pressure is questionable with an immediate counter-bearish recovery, the support level could be tested before forming a rebound.
In the main price chart, buying pressure is visible above the 200-day SMA, but an immediate rejection from the 250.00 psychological resistance signals a challenge for buyers. Although the 50-day EMA is below the high-volume support level with a bullish recovery, the market needs to react at the near-term support area before anticipating a bullish movement.
In the indicator window, the Relative Strength Index has rebounded from the overbought area and is hovering at the 50.00 neutral line. The Average Directional Index also rebounded from the 34.80 level, but the internal structure still remains above the 20.00 neutral point.
Based on the overall market structure, the price has a higher possibility of extending downside momentum and testing the 191.79 high-volume support level. An extended downside move could find support at the 178.87 level, from where a bullish recovery is possible. In that case, any bullish rebound from the 191.79–216.00 area could offer a decent long opportunity targeting the 329.48 resistance level.
On the other hand, counter bearish pressure with a daily close below the 178.87 support level could validate an ascending trendline break. In that case, the price might extend the downside pressure and test the 135.62 support level before offering another long opportunity.
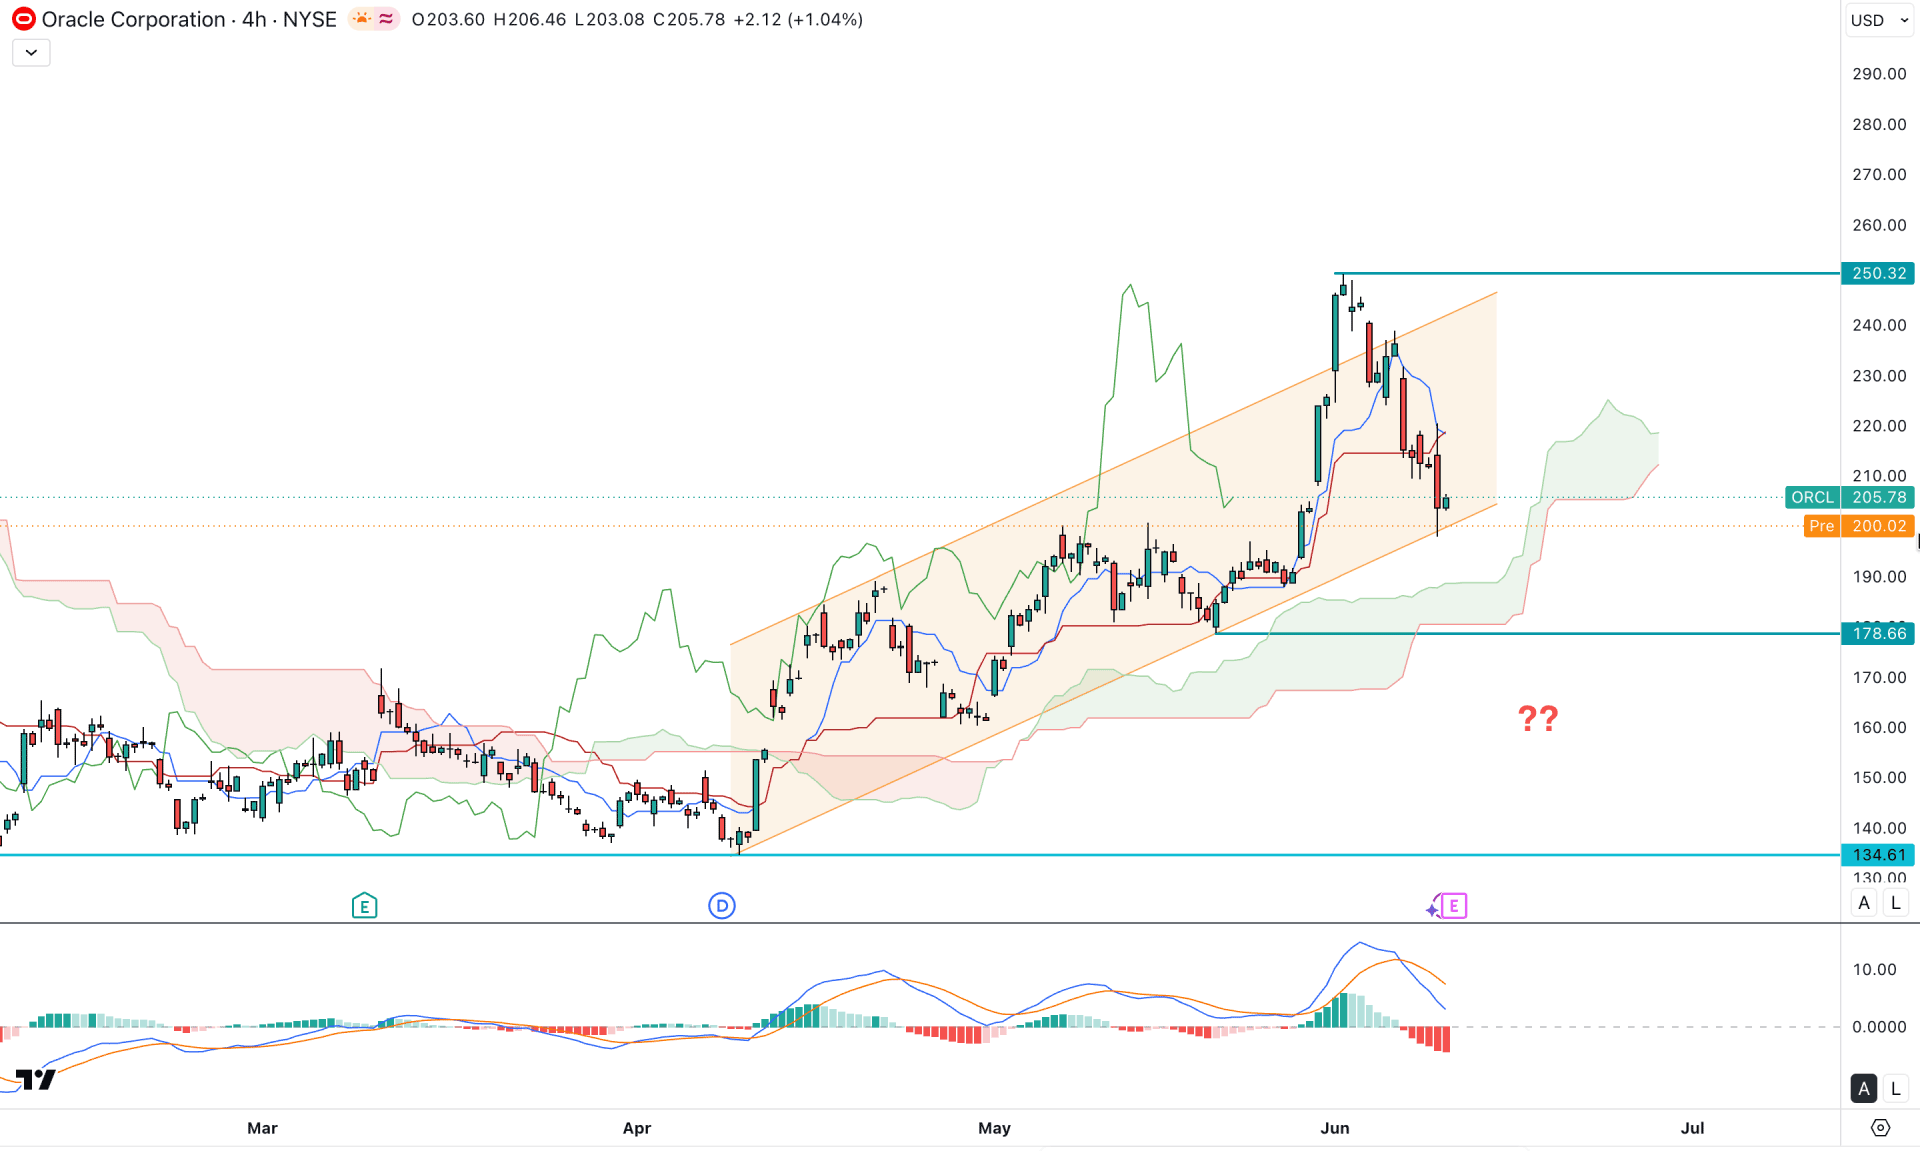
In the four-hour timeframe, a bullish trend is visible in the ORCL price as the existing market momentum is rising above the Kumo cloud area. Moreover, the future cloud is positive for medium-term buyers, and short-term bullish momentum is visible.
The indicator window shows a different story, where a potential top is formed with a bearish signal. The dynamic lines support the ongoing selling pressure as the current price action is below the Kijun Sen line.
In this context, the price is trading within an ascending channel, and the channel support is in play. However, a liquidity grab is visible from the channel resistance as it moved beyond the trendline and formed a top at the 250.32 level. In this context, investors should closely monitor how the price holds buying pressure above the Kumo cloud area.
An immediate bearish rebound with a four-hour close below the 178.66 support level could encourage sellers to test the 134.61 key support level.
On the other hand, moving below the Kumo cloud area could signal a potential long opportunity after rebounding above the dynamic resistance level. On the bullish side, the immediate resistance is at the 250.32 level before heading toward the 300.00 psychological point.
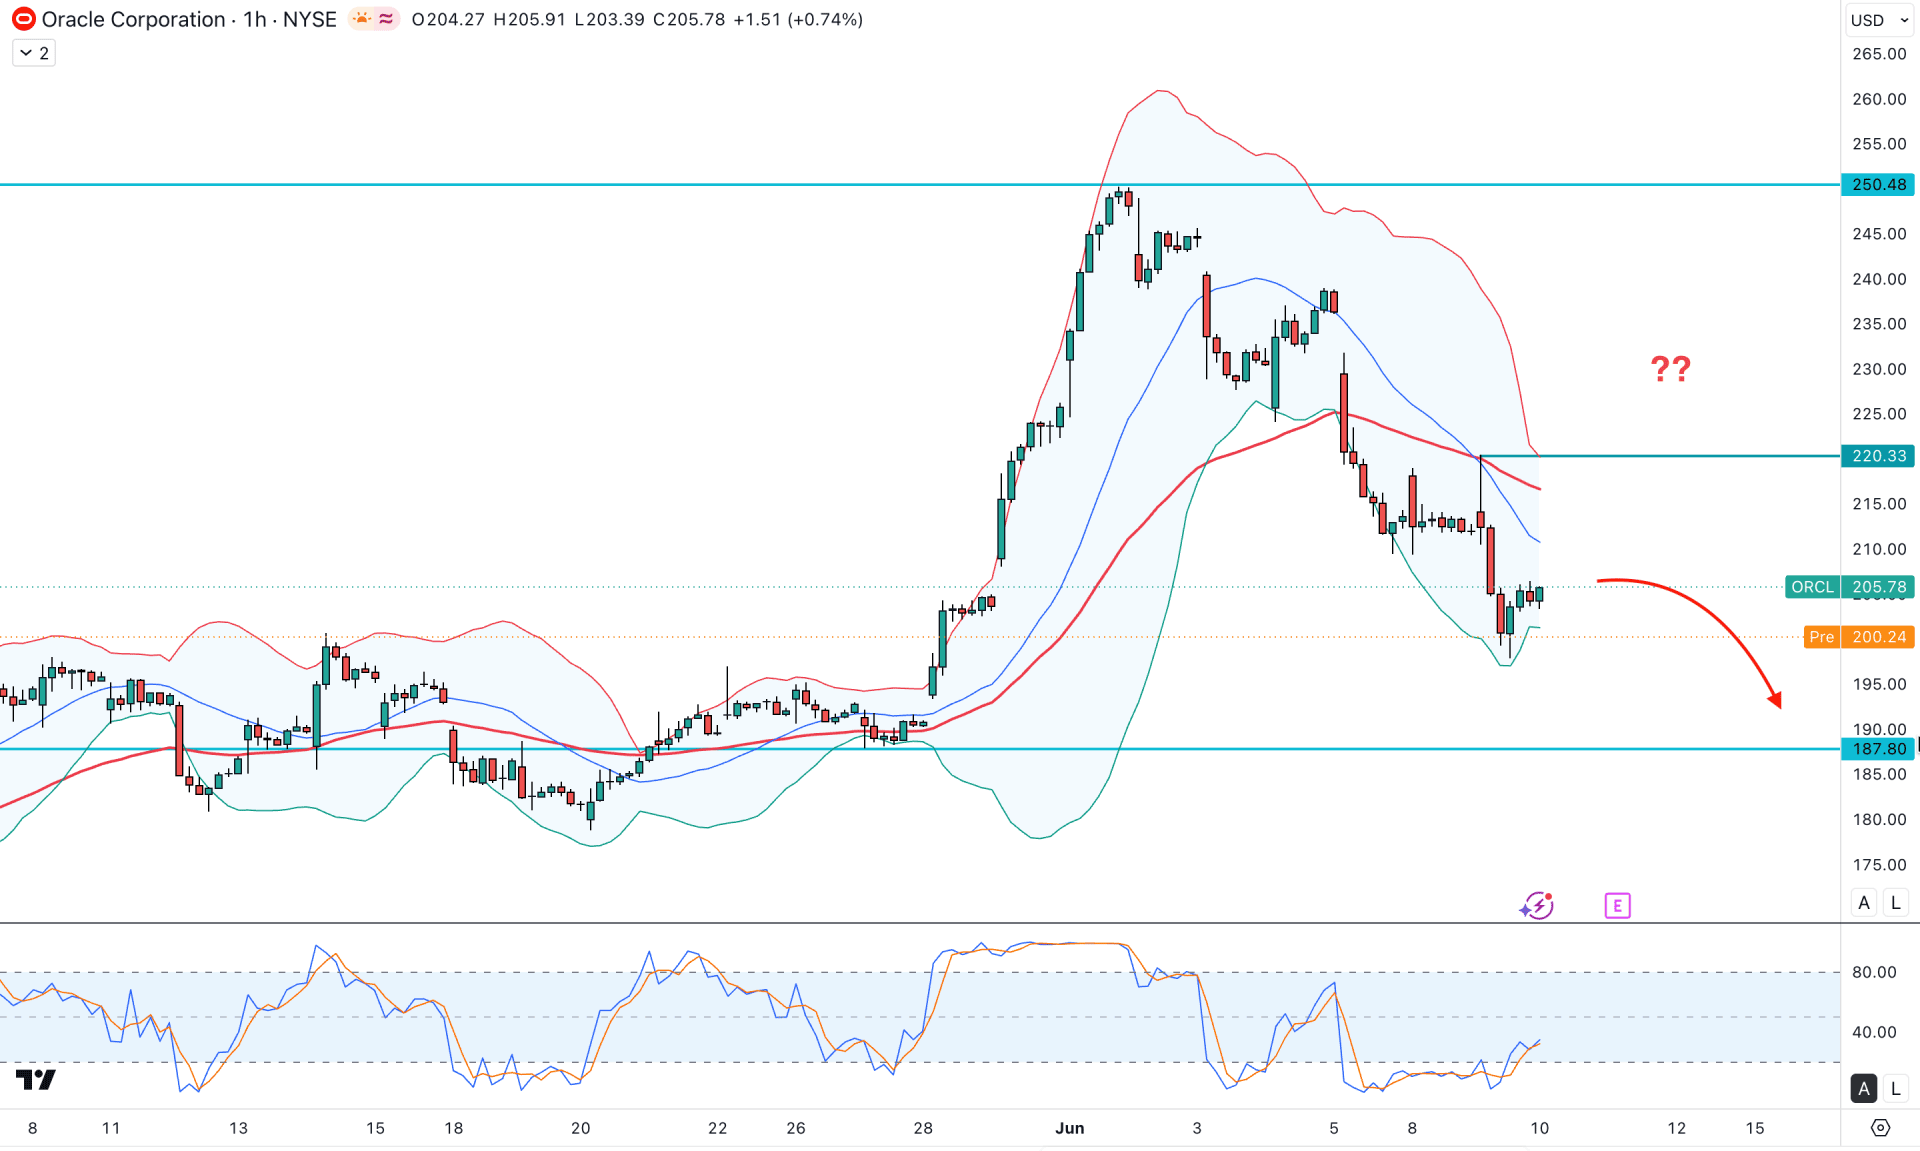
In the hourly timeframe, the current price is trading within a bearish trend after forming a solid top. Therefore, a downside continuation is highly possible until a valid bullish rebound is present.
In the main chart, a rebound is formed below the mid Bollinger Bands line, and the most recent price tested the dynamic 50 EMA before creating a new swing low below the 200.00 level. As long as the price remains below the 50 EMA line, the primary anticipation would be to take short trades only.
The stochastic oscillator remains below the 20.00 line for a considerable time and has formed a rebound. It is a valid sign of divergence with the main price chart, signaling minor buying pressure.
Based on the overall market structure, a bullish rebound with a close above the 220.33 resistance level could be a potential long opportunity targeting the 250.50 area. However, the price remains bearish below the mid Bollinger Bands line, which might extend the downside pressure toward the 187.80 support area.
Based on the overall market structure, ORCL is showing a potential pump and dump after reaching the 250.00 level. As the earnings call is approaching, investors should closely monitor how the company sustains bullish expectations regarding AI adoption. As the most recent price is trading at a discounted area, a valid rebound is highly possible, creating a bullish continuation opportunity.


