Published: February 5th, 2021
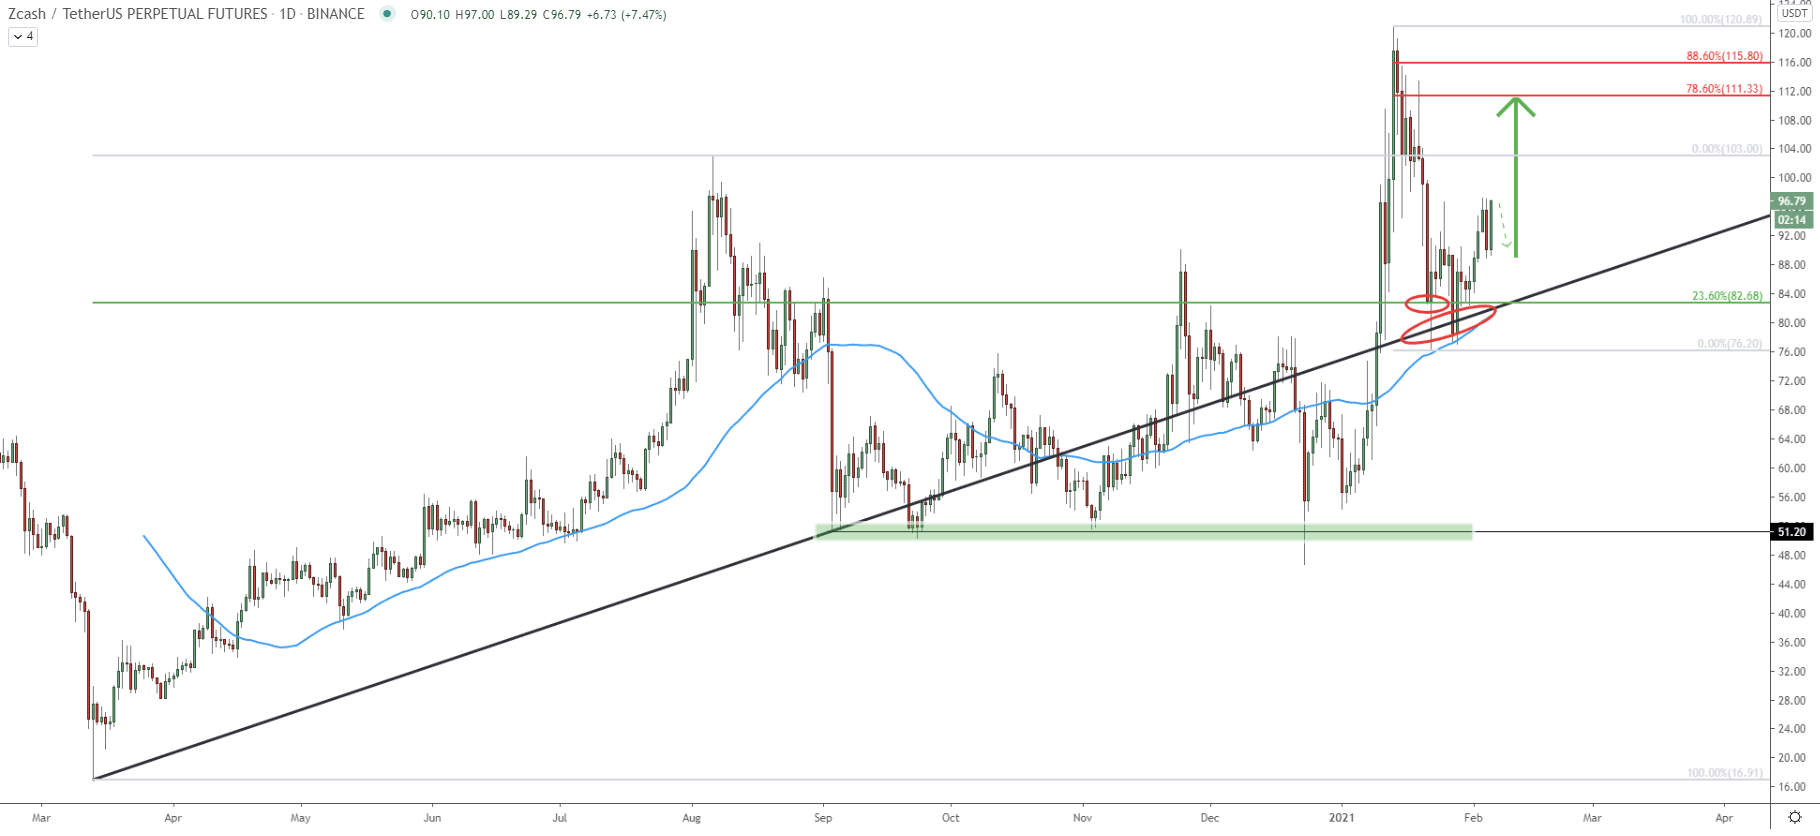
On the daily chart, the trend remains bullish as ZEC/USDT price continues to print higher highs and higher lows. Between September and December 2020, Zcash has formed extremely strong support near the 51.20 area. This support was rejected 4 consecutive times. Then it went up and produced a new higher high, hitting the 120.89 mark.
After hitting the top near 120, the price has corrected down sharply but the freefall was stopped by 23.6% Fibonacci retracement level as can be seen on the chart. Along with the Fibonacci support at 82.68, price rejected the uptrend trendline and the 50 Exponential Moving Average, and all this occurred almost simultaneously.
Such price action implies that the bulls remain in control, and as long as 79.20 support holds, the price is likely to continue rising. It is a big question whether a new higher high will be printed because prior to that there is another major obstacle. This is the 78.6% Fibs at 111.13 and 88.6% Fibs at 115.80. It is highly likely that this will be an area for the battle between bulls and bears. Obviously, it’ll be important to see a break above all these resistances as well as a new higher high, for a long-term uptrend to continue.
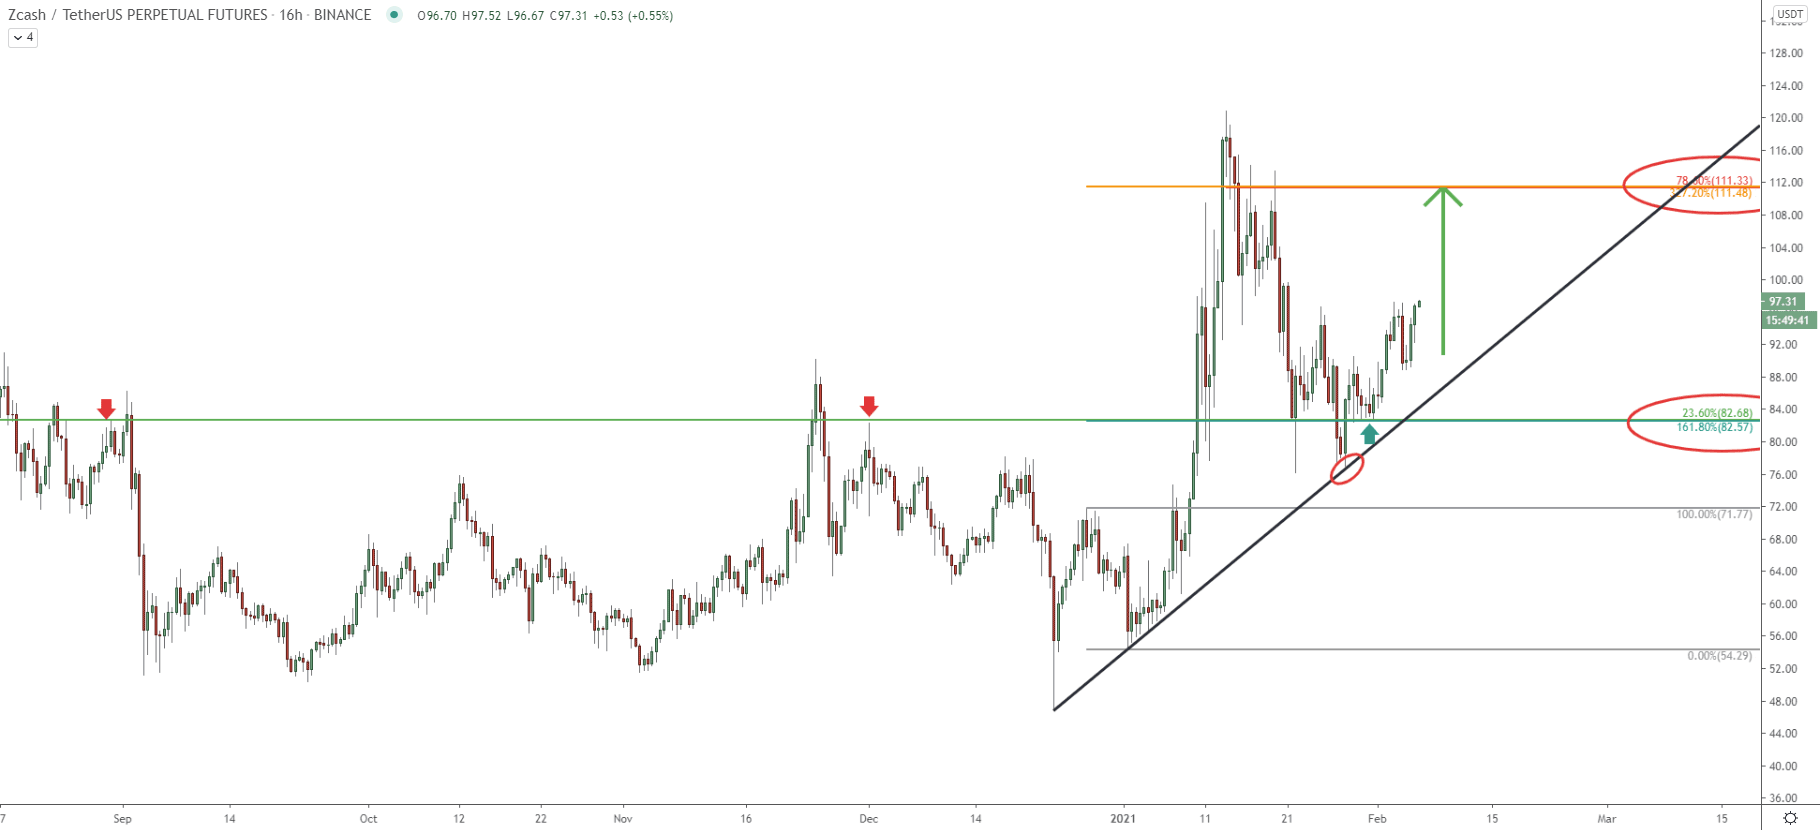
On this chart, we can observe a critical supply/demand zone, located near 82.60. This is the level where two Fibonacci retracement levels meet. The first is 23.6% as per the daily chart, and the second is 161.8% Fibs applied to the first corrective wave down after the price bottomed out in December 2020. It can be seen how the price has been dancing around this level for nearly 4 months. But then, after it finally got broken, it became the support, which was clearly rejected. Yes, there were spiked below, yet, no closing price below the spike. This makes this support a valid demand zone, where buyers took action. Perhaps the confirmation of the bullish trend was also a clean bounce off the simple uptrend trendline and higher highs pattern on the lower timeframe.
In regards to key resistance and the potential upside target, on this chart it is confirmed by two Fibs, first is 78.6% retracement level as per the daily chart, as well as 327.2% Fibs as can be seen on the chart. This makes an upside potential or over 15%, which might be achieved in a relatively short period of time.
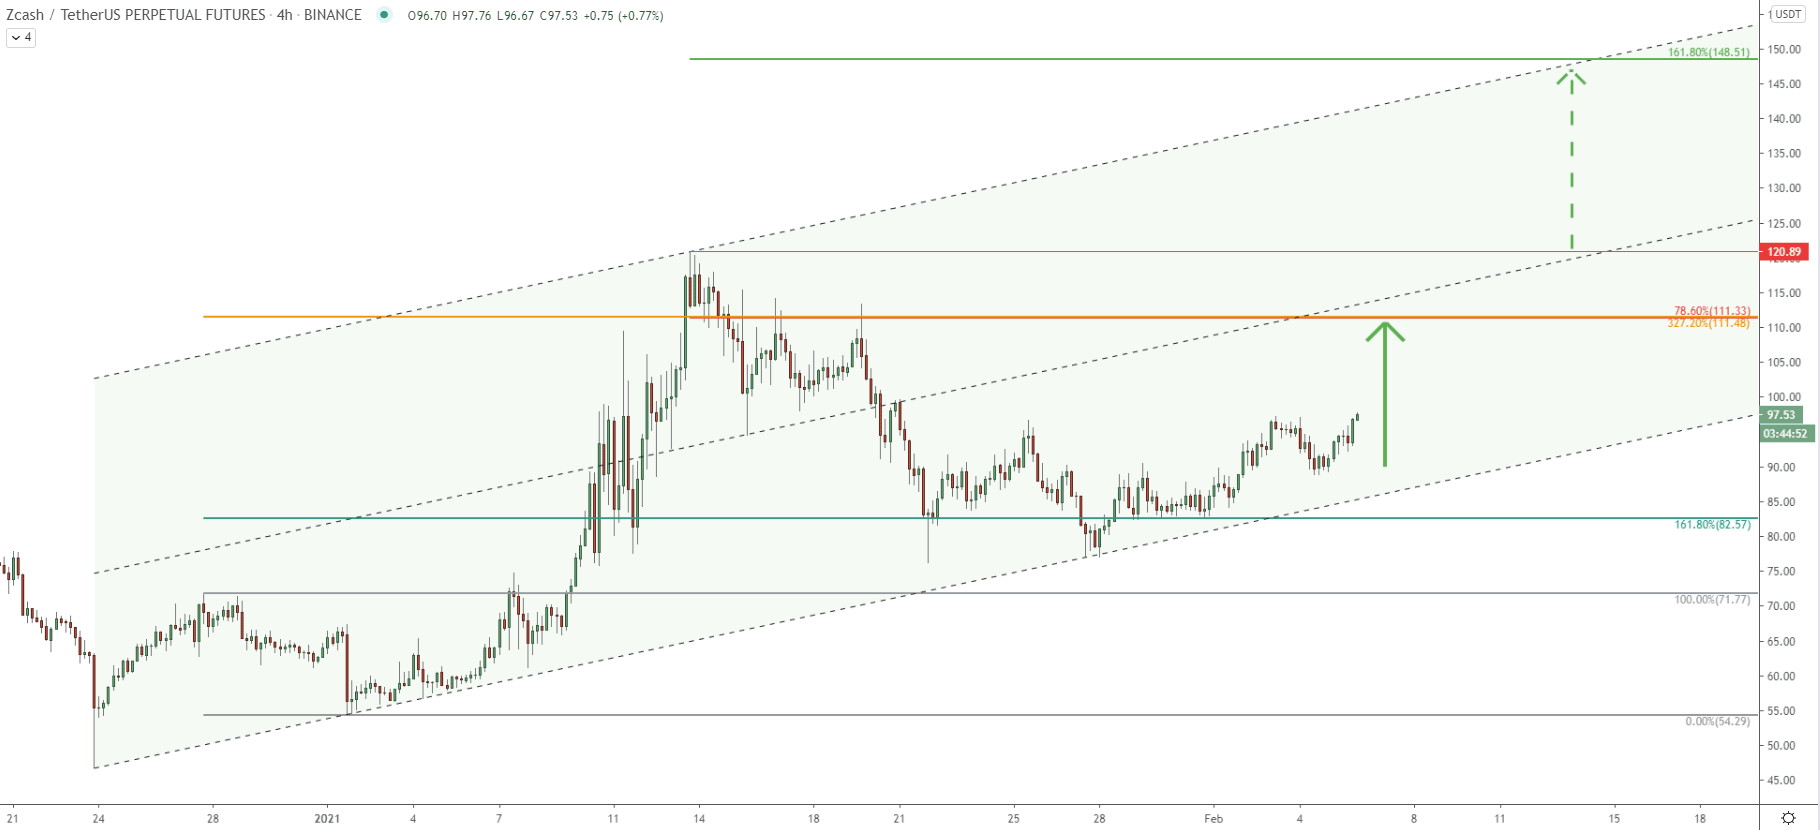
Since December 24, Zcash has been moving above the trendline, while forming an ascending channel. Price has also been bouncing off the middle trendline of the channel, which clearly acting as the resistance. It is possible that it will be considered as the resistance once again, which actually confirmed that 111.00 is a strong supply area. This is because this price zone corresponds to two Fibonacci retracement levels as well as the middle trendline of the channel. Besides, in case the uptrend will continue, the price can rise towards the 161.8% Fibs at 148.51, and this level corresponds to the top of the channel.
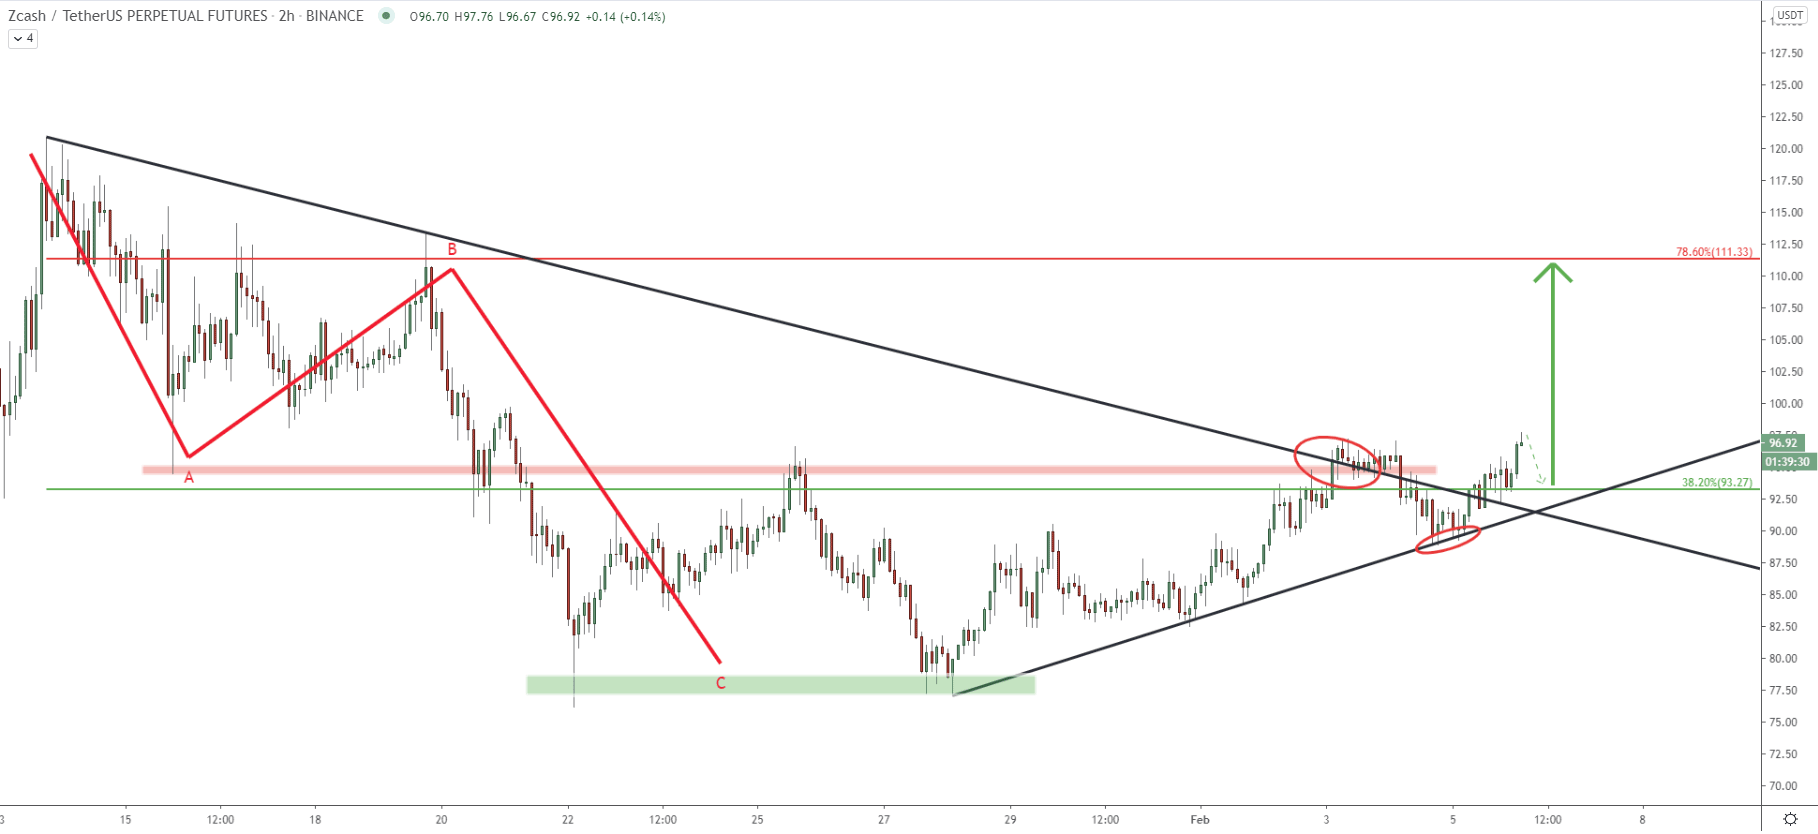
On this chart, it can be seen that between Jan 14 - 22, ZEC/USD has formed a correctional ABC pattern based on the Elliot Wave theory. Price has reached the 77.00 support area and formed a double bottom. After this, ZEC broke above the downtrend trendline, as well as the supply/demand zone near 95.00, confirming a strong bullish pressure. The most recent pullback resulting in the rejection of the uptrend trendline, which could have been yet another and maybe even the final confirmation of the uptrend continuation. Perhaps during the next 24 hours, there can be minor pullbacks, which certainly will be of interest to buyers.
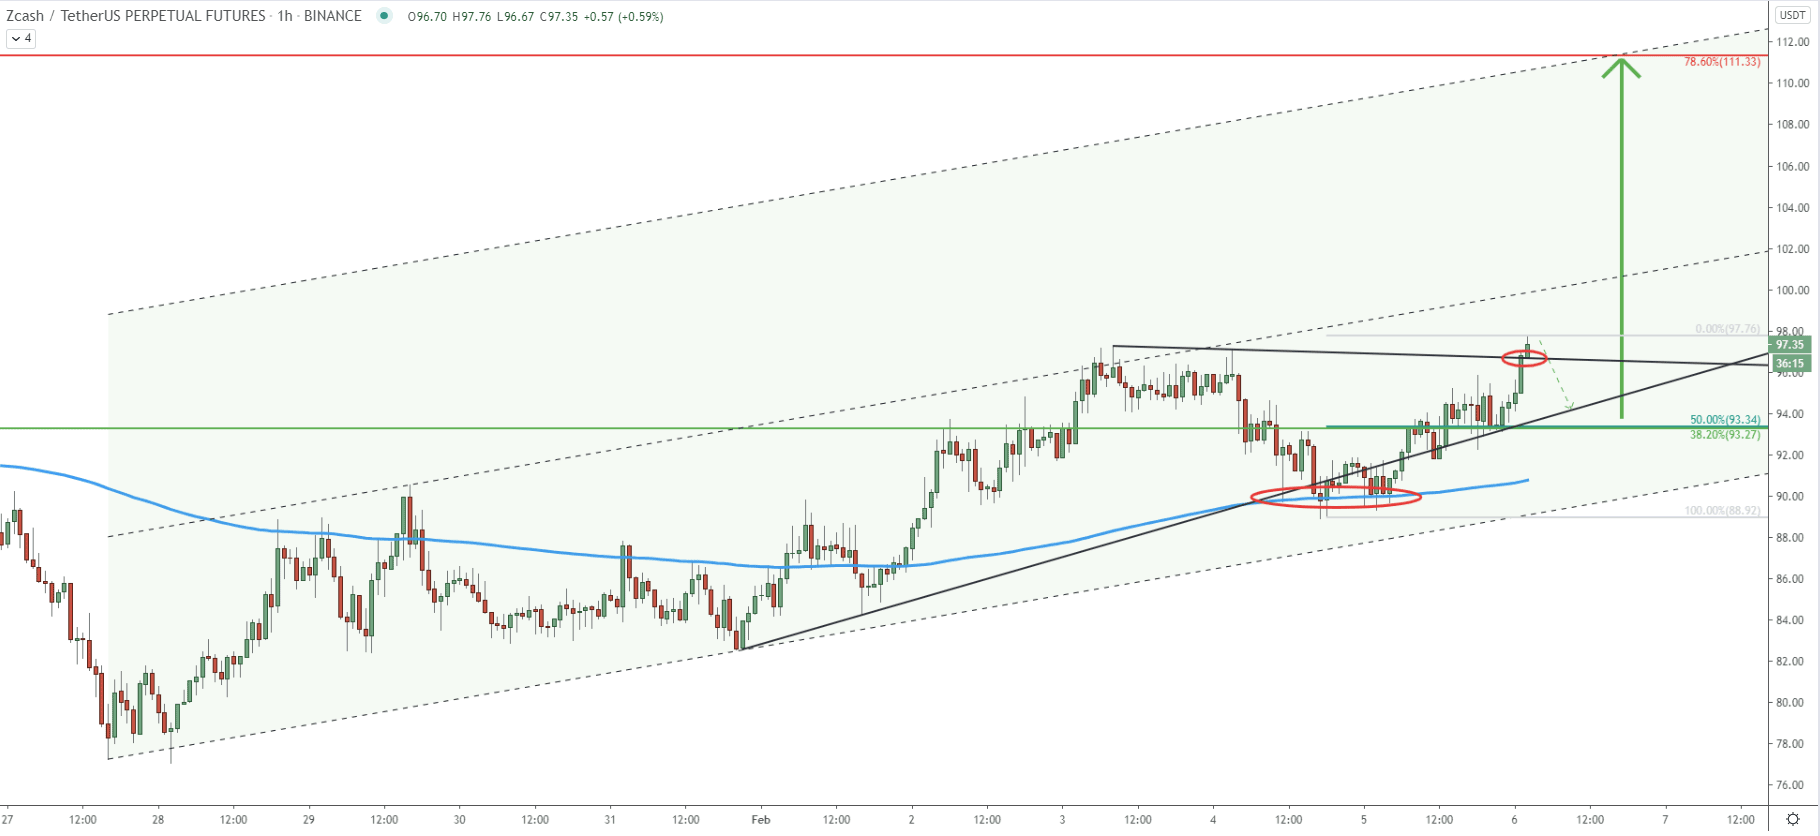
On the hourly chart, the price is still moving within the ascending channel. Yesterday, ZEC rejected the 200 Exponential Moving Average along with yet another uptrend trendline. Today price broke above the previously established high as well as the resistance downtrend trendline. This implies the beginning or continuation of a long term uptrend, which should send the price at least towards the 111.00 resistance area.
The Zcash is showing multiple bullish signatures on different timeframes. Such price action usually is resulting in fast and strong growth, considering the volatility of the cryptocurrency market. Therefore, price could start rising during the weekends and might increase by $10,$20, or even $30 dollars in a matter of days.
As per the daily and 16-hour chart, the nearest key resistance is located near 111.00 level, which is confirmed by two Fibonacci retracement indicators.
At this stage, considering all the facts of a valid uptrend presented in this analysis, the probability of a downtrend is extremely high. Nevertheless, a break below the most recent low at 88.00 will invalidate the bullish outlook. In such a scenario, the trend will not necessarily reverse down, although the consolidation phase could be extended further.
Support: 88.88, 82.68 76.20
Resistance: 103.00, 11.33, 115.80


