

Published: July 8th, 2026
With Ondo Preps, Ondo (ONDO) declared its participation in the on-chain perpetuals competition. In addition to centralised exchanges like Coinbase (COIN), it will face competition from ApeX Protocol (APEX), Hyperliquid (HYPE), Aster (ASTER), and Lighter (LIT).
According to Ondo, tokenised equities will allow traders to open everlasting positions with up to 20x leverage. The wider range includes index products that track the US 100 and US 500, gold, silver, oil, and other large-cap stocks.
Tokenised stocks can be placed as collateral, allowing traders to return a stretched investment without having to convert to stablecoins, according to the company's primary differentiator. It said that Ondo Perps would be accessible to traders worldwide outside of the United States, Panama, and other restricted territories, as well as to pre-alpha users today.
A limited array of 16 equities and three commodities was available for early access on March 27 after Ondo originally hinted at the item at its Ondo Summit in February. The rollout also comes after a change in the company's leadership.
Ondo has previously stated that its timing for moving forward with equities perpetuals was influenced by changing U.S. regulations, such as the CFTC's authorisation of the nation's first authorised Bitcoin perpetual future in May.
Let's see the upcoming price direction from the Ondo technical analysis:
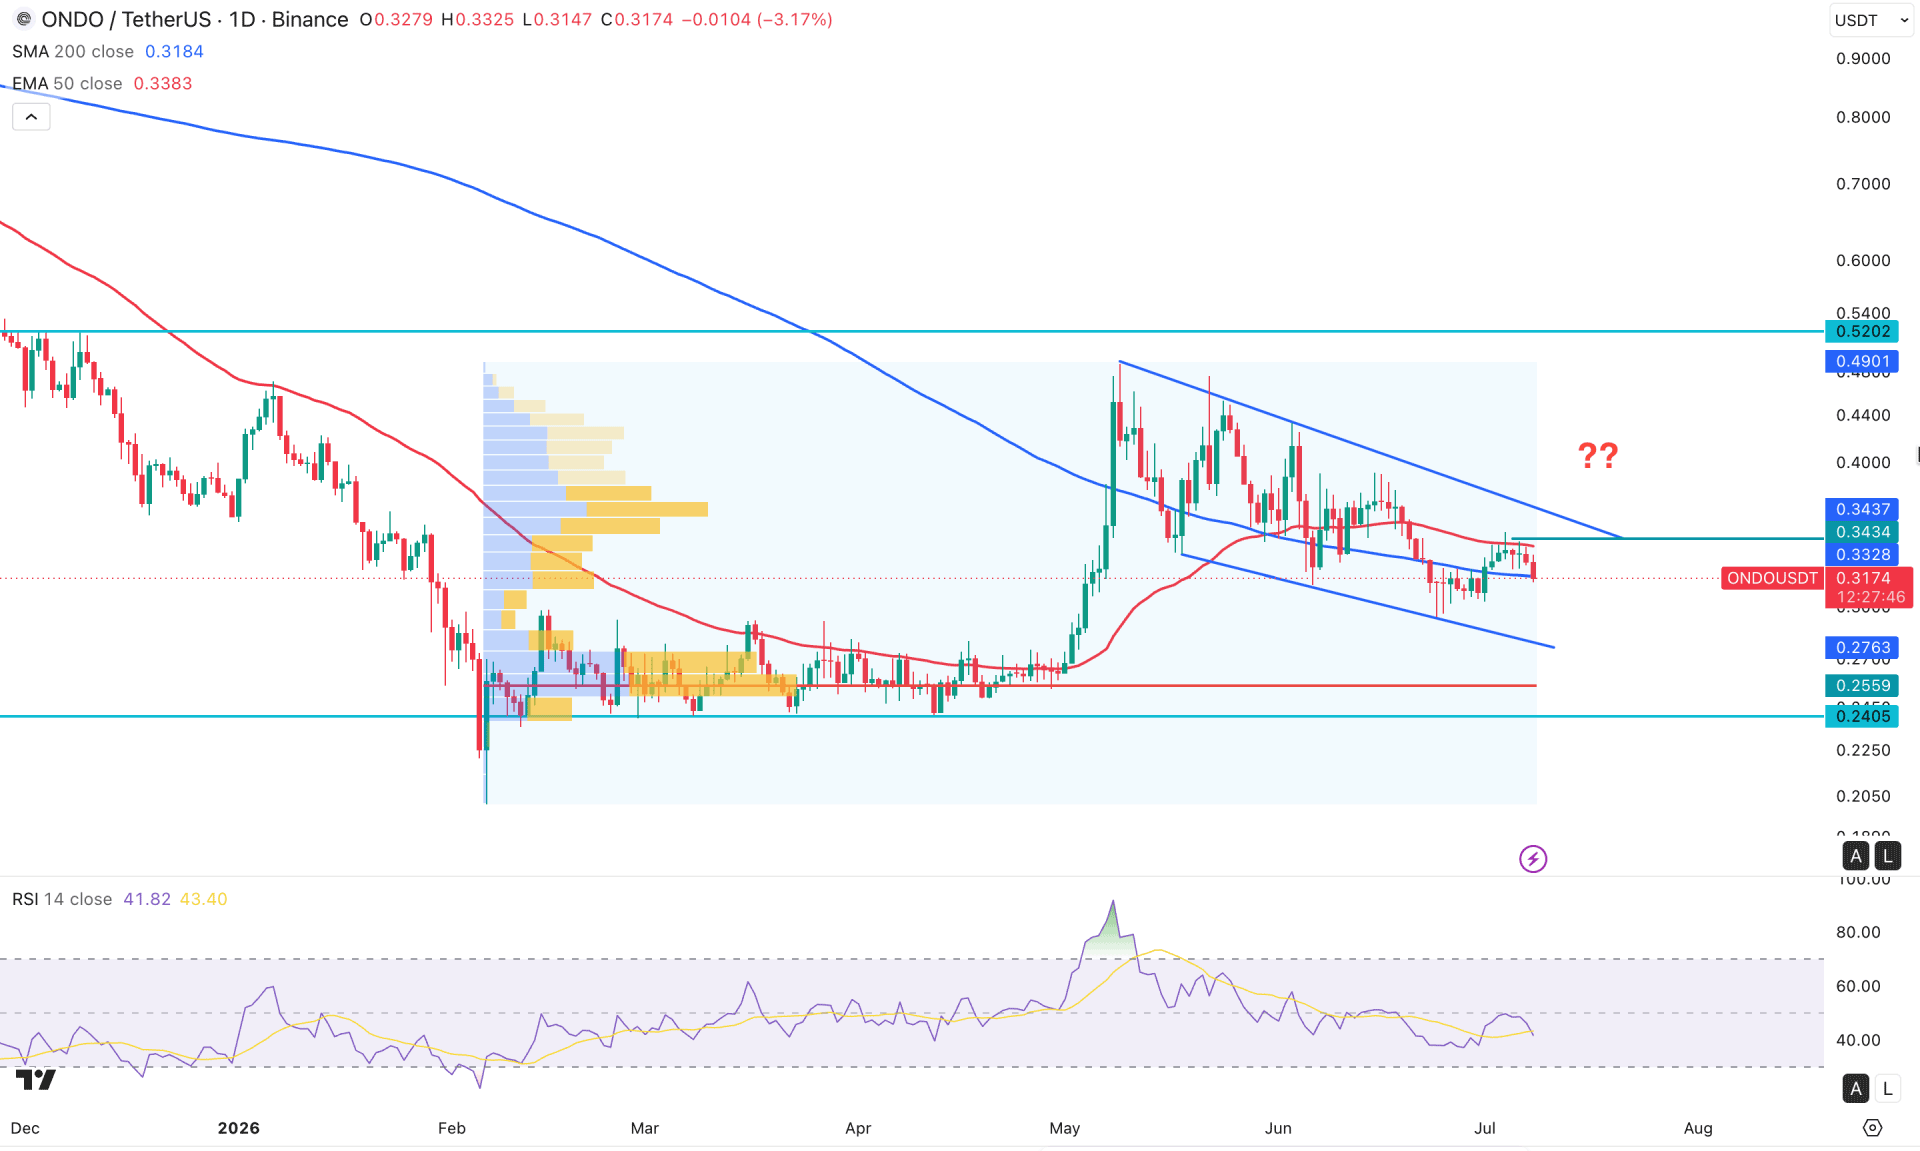
In the daily chart of ONDO/USDT, the recent price shows a corrective bearish pressure within a bullish wave, signalling a potential bullish continuation opportunity. However, the market momentum still needs more clarification about the trend, as no clear sign of bullish momentum is visible now. Investors should closely monitor how the price breaks out from the corrective bearish price pattern, as a further trend formation is possible.
Looking at the higher timeframe, the current price is trading sideways in the monthly chart, where minor buying pressure is seen with an inside bar pattern. As the price is still within the inside bar body, more confirmation is needed before forming a market trend. The weekly timeframe shows corrective pressure with a bearish wave, and further downside continuation is still pending.
In terms of volume, the price is trading in the buyers' zone, as a massive range breakout came with high-volume orders at 0.2559. Primarily, as long as the price remains above this line, we may expect the buying pressure to extend.
In the main price chart, a bullish recovery is seen above the 200-day SMA. However, multiple indecision candlesticks have formed above this line, with a rejection from the 50-day EMA. It is a sign of mixed market momentum; however, the medium-term pressure is coming from the seller side.
Moreover, the price is running within a pennant pattern, where the immediate bearish rebound is coming from a premium area.
In the secondary indicator, the Relative Strength Index is signalling selling pressure, as the current line is below the 50.00 neutral level with a valid rebound.
Based on this market structure, the trend line resistance is a crucial area to look at, as it could push the price lower below the 0.2950 level. The immediate support level to look at is 0.2559 before testing the 0.2405 level.
On the other hand, a bullish rebound is possible after overcoming the 0.3328 level, which might face another resistance from the descending trend line. Overcoming these two levels could open room for testing the 0.5202 key resistance level.
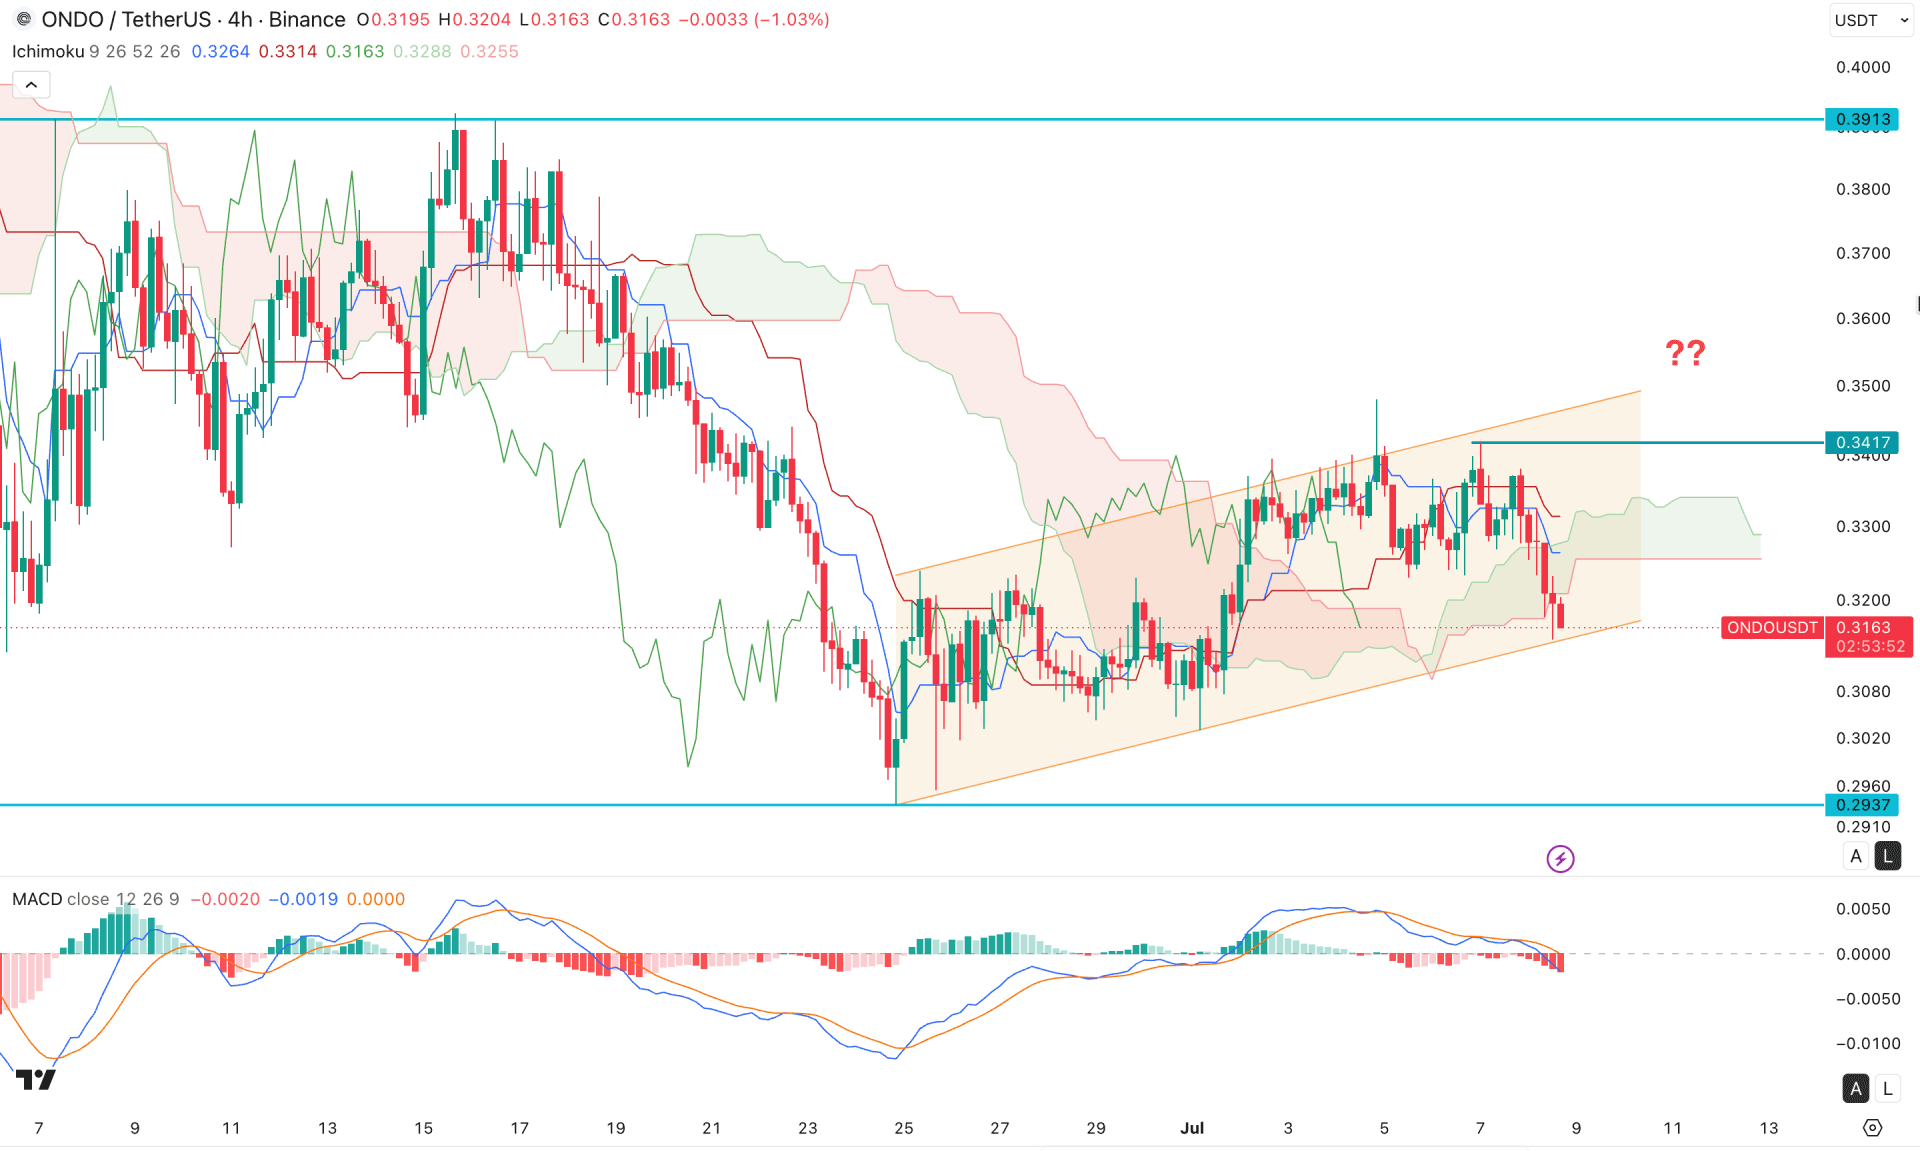
In the four-hour timeframe, the recent price shows a recovery below the key area after failing to hold momentum above it. Moreover, the pressure came with a buy-side liquidity grab, signalling a decent short opportunity.
Multiple bearish candles are present below the dynamic resistance, where the Ichimoku cloud has started to flip position.
In the indicator window, the MACD signal line formed a bearish crossover with multiple histogram bars below the neutral level.
Based on this structure, the price is still trading within an ascending channel, from where a breakdown could be a decent short opportunity. On the bearish side, the primary target to look at is the 0.2937 level for making a new swing low.
On the other hand, a bullish breakout above the cloud area is mandatory before eliminating the downside pressure. In that case, the price might move higher and test the 0.4000 psychological level.
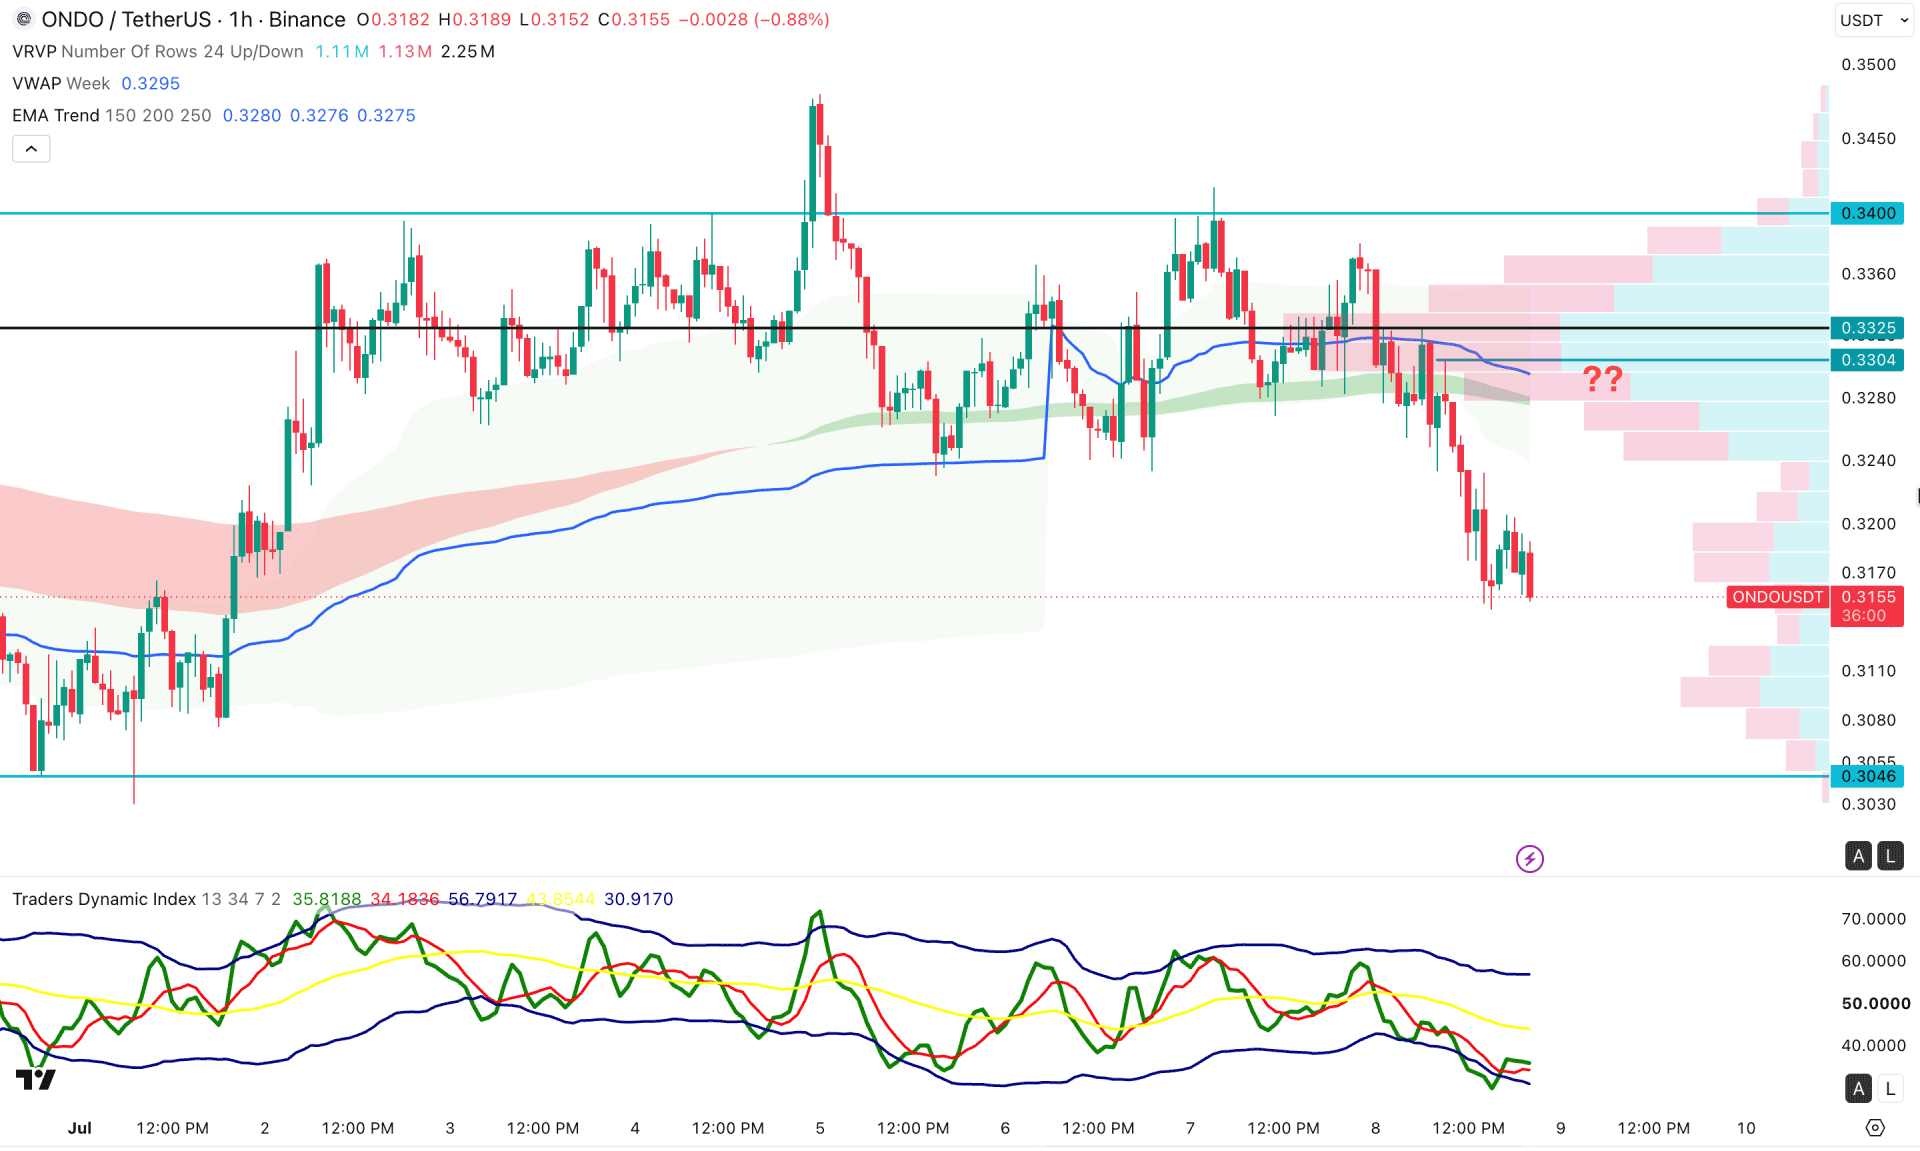
In the hourly timeframe, ONDO/USDT is trading under active bearish pressure, but the current price is overextended from the exponential moving average. Moreover, the weekly VWAP line is also above the current price and shows a bearish slope from the 0.3204 resistance level.
In the secondary indicator window, the Traders Dynamic Index has reached the bottom and found a minor rebound at the 40.00 area. Although the TDI line reached the lower band area, the recovery is not sufficient to validate a bullish reversal.
Based on this market outlook, the ongoing market momentum is bearish, and it can move lower towards the 0.3046 level. On the bullish side, the immediate resistance to look at is the 0.3304 level. Overcoming this line could face a major barrier at the 0.3400 area before moving beyond the 0.3900 level.
Based on the market structure, ONDO/USDT is trading under corrective pressure, with further downside continuation pending to validate the pennant pattern. Investors should closely monitor how the price moves lower and forms a bottom, as a valid rebound from the lower timeframe could offer an early breakout opportunity.


