
Published: January 25th, 2021
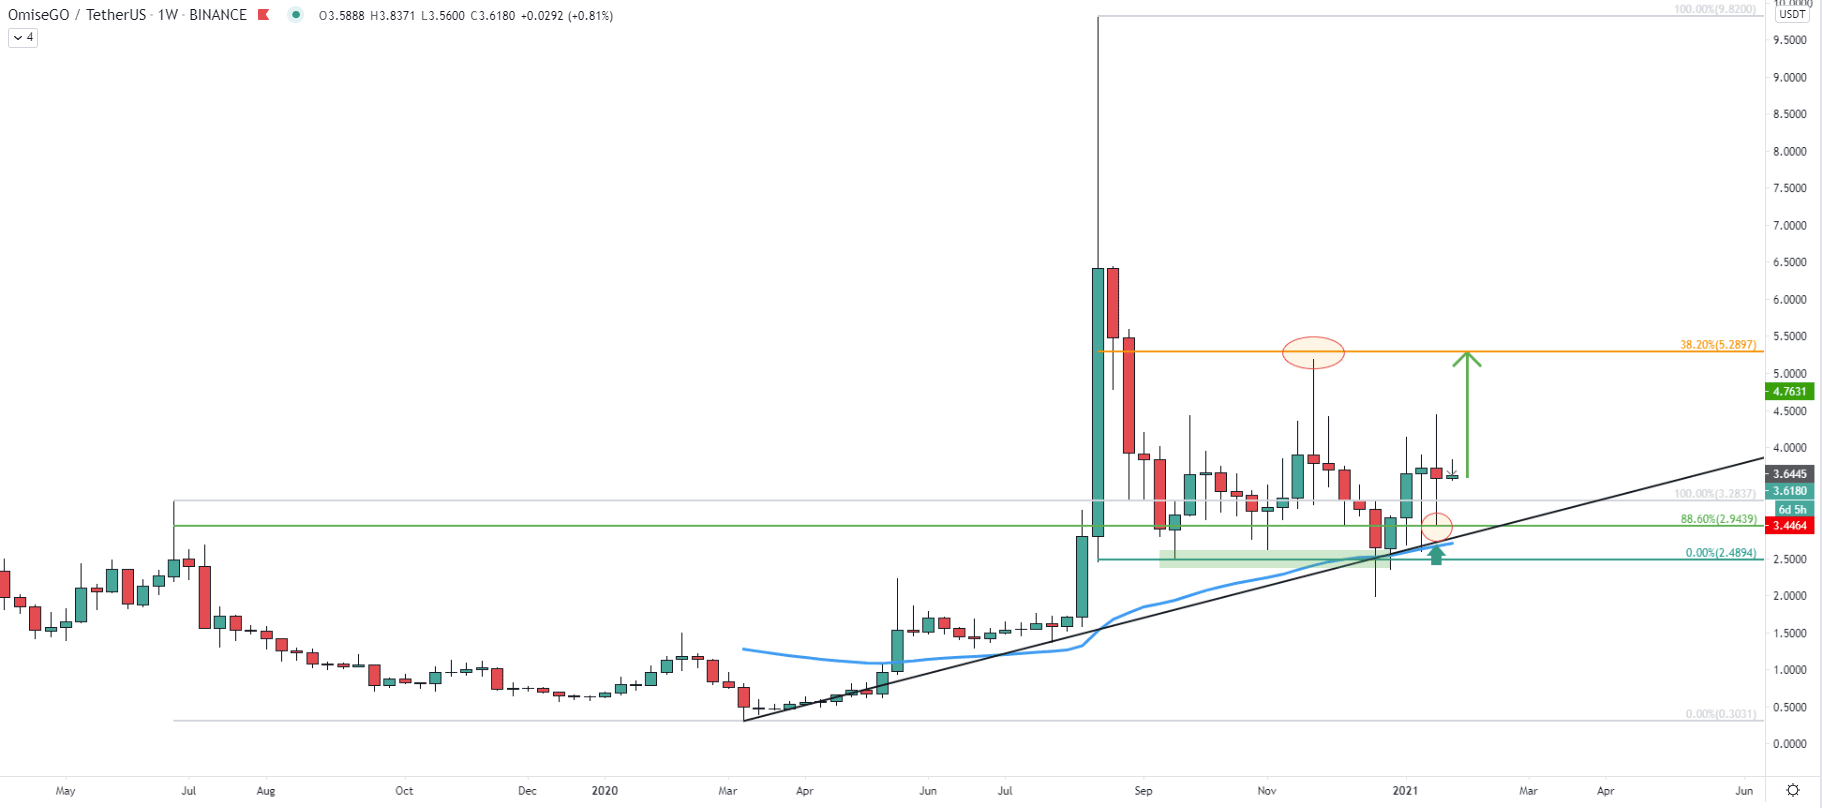
Back in March 2020, OMG/USDT price has bottomed out while hitting 0.30 psychological support. After the rejection trend has become and still remains bullish in the long run. In August 2020 there was a substantial price increase where OMG jumped from 1.50 up until nearly a 10.00 level. Nonetheless, as it usually happens after such rallies, the price has corrected down strongly, testing the 2.50 support area. This support has been rejected twice during the past 5 months, with the most recent bounce occurring on December 24. At that time OmiseGo not only produced a double bottom but also rejected the uptrend trenldine as well as 200 Exponential Moving Average.
Such price action implies the validity of an uptrend, especially considering the clean rejection of 2.94 level, which is 88.6% Fibonacci retracement level as can be seen on the chart. While the OMG could be targeting a new all-time high, the nearest resistance is located at 5.28 resistance area, confirmed by 38.2% Fibs. Perhaps this is one of the strong supply areas, which is likely to be monitored by the buyers as well as the sellers.
At the beginning of December, OmiseGo attempted to break below the 50 Simple Moving Average, while testing the 3.08 low. Then, there was another attempt to break lower, although the price failed to close below 3.08 support. Since then, the price has produced a new higher high and the corrected down, rejecting cleanly the 88.6% Fibonacci support. It certainly seems like the trend is starting to turn bullish once again after 5 months of consolidation.
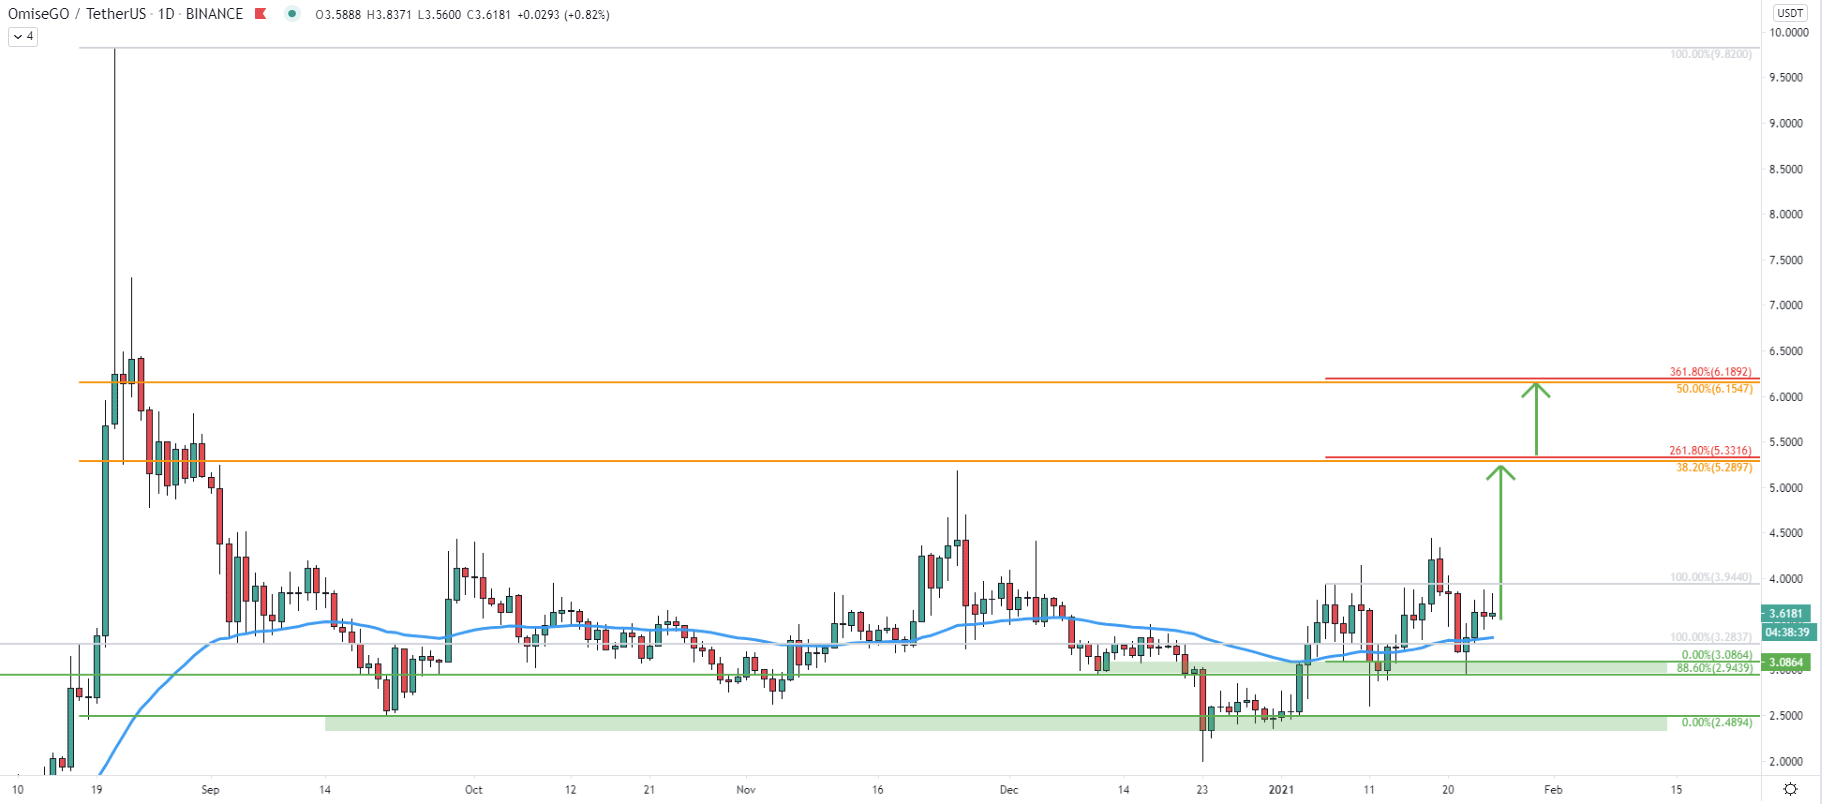
On this chart, there are two resistance areas, each of which is confirmed by two Fibonacci retracement levels. First, is the one that we already mentioned, located near the 5.30 area. If it will get broken, there will be further growth potential, which might result in the price increase towards the second resistance near 6.156.
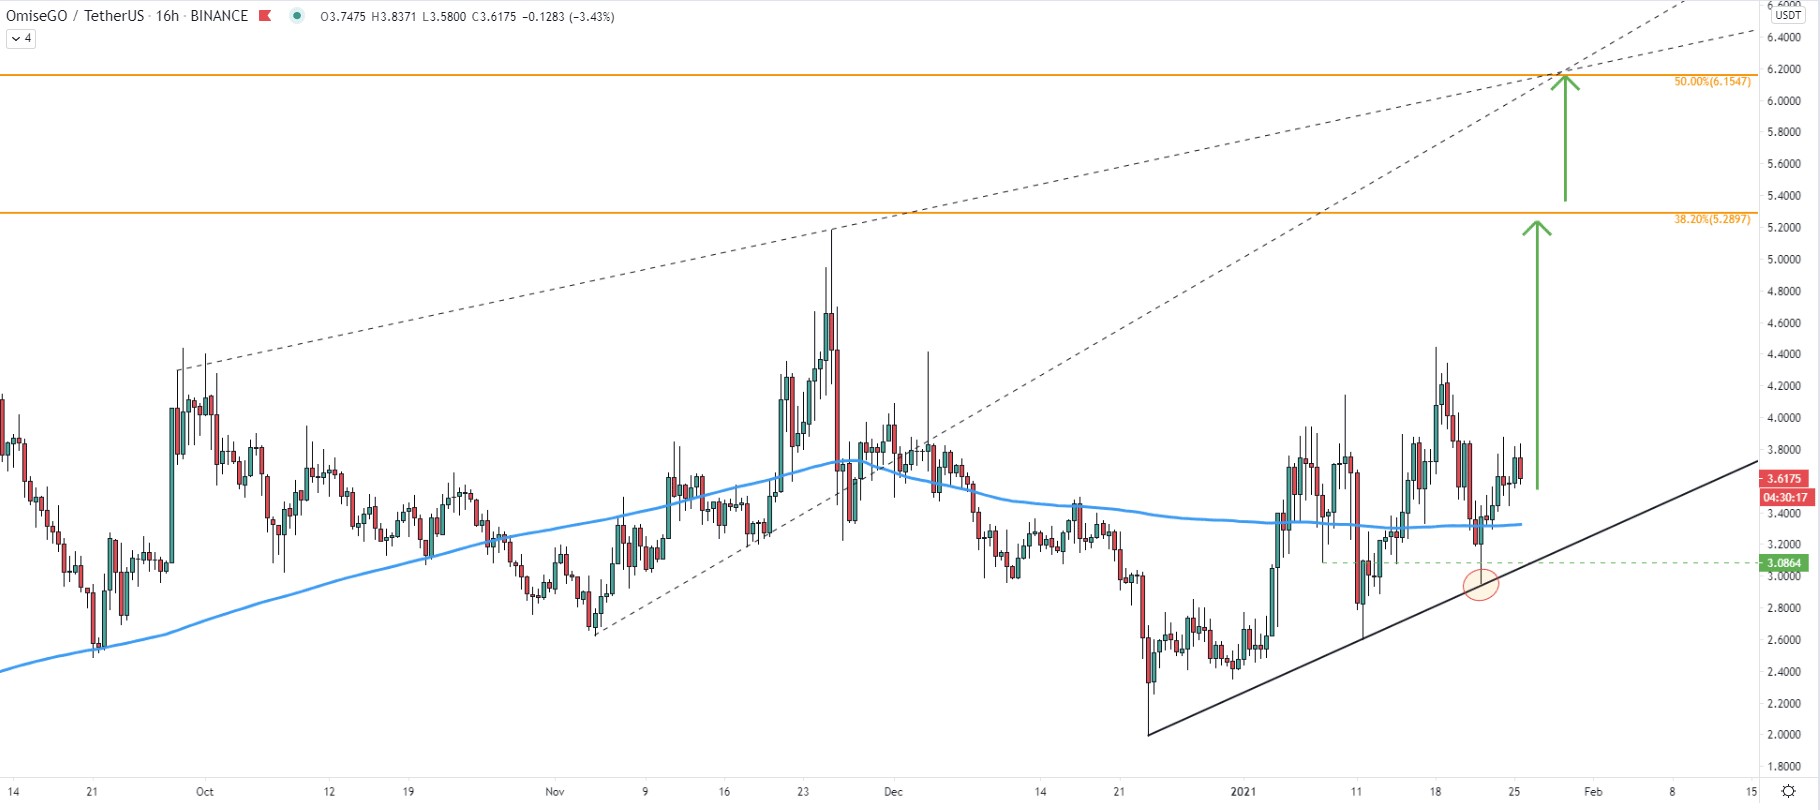
As can be seen, the price has rejected the simple uptrend trendline, which was a very clean bounce. Higher highs and higher lows are being printed, validating the uptrend. But what is most important is that there are two trendlines, one is the resistance trendline and another is the uptrend trendline, which got broken previously. Both of these trendlines are crossing with the 6.15 resistance at the same spot, suggesting a very fast price increase if the trend will take place.
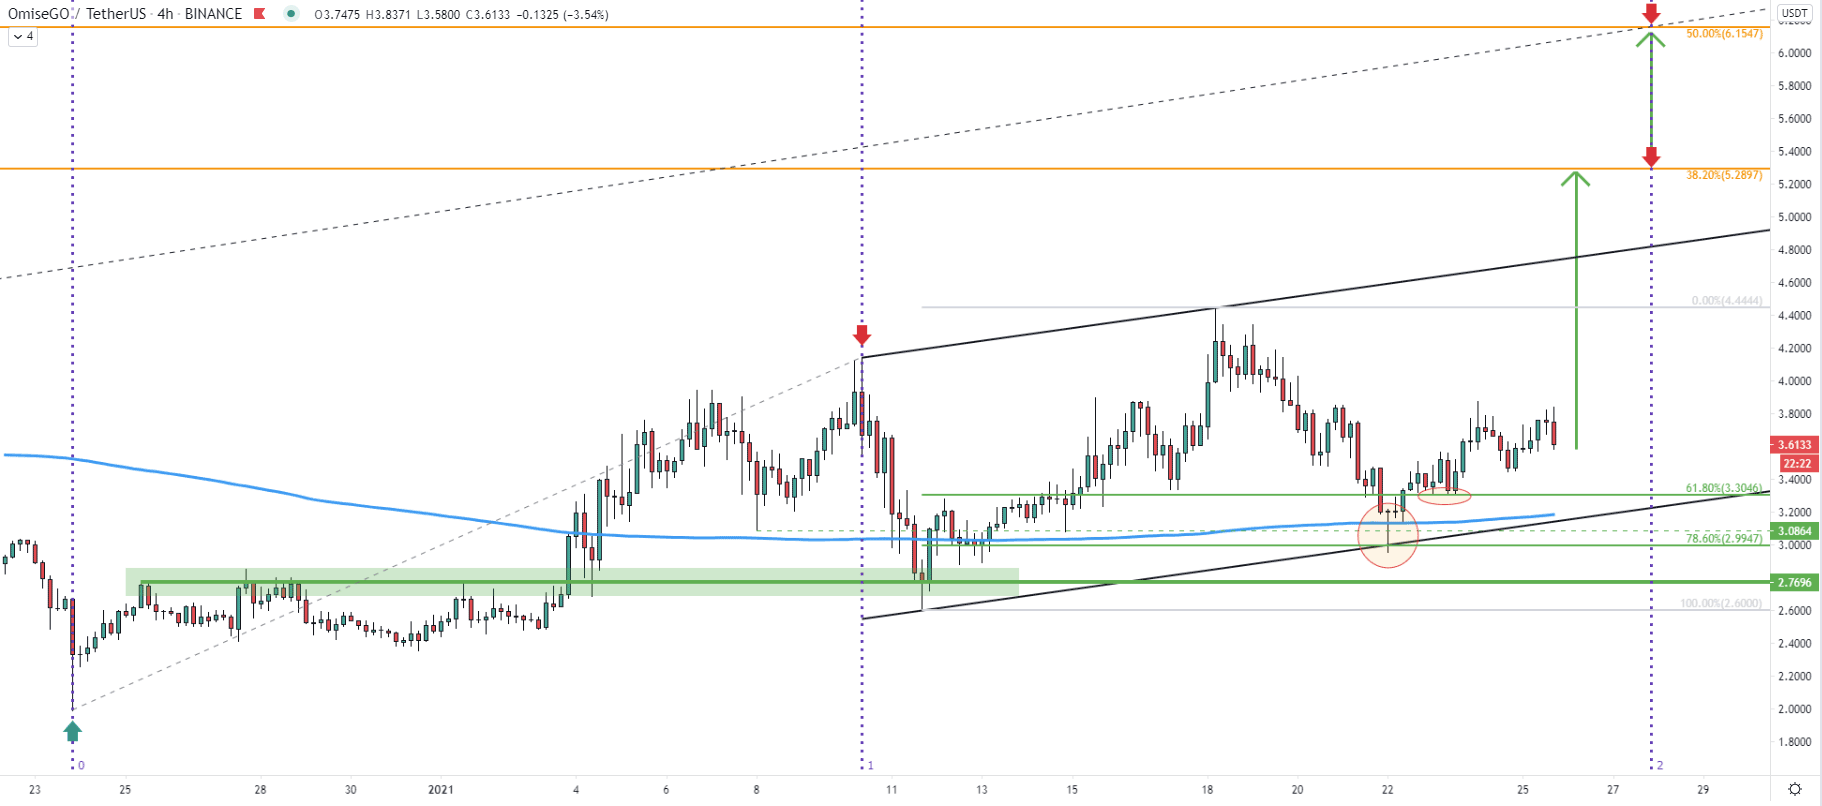
On the 4-hour chart, the price is moving within the ascending channel. Recently price rejected the 200 SMA as well as 61.8% Fibonacci retracement level at 3.30. This could have been the key long-term demand area that might potentially be re-tested, along with the EMA, before the uptrend will continue. Based on the Fibonacci cycles indicator, the next cycle will start in just 2 days. Therefore, if the uptrend will take place, it can be a relatively rapid price increase.
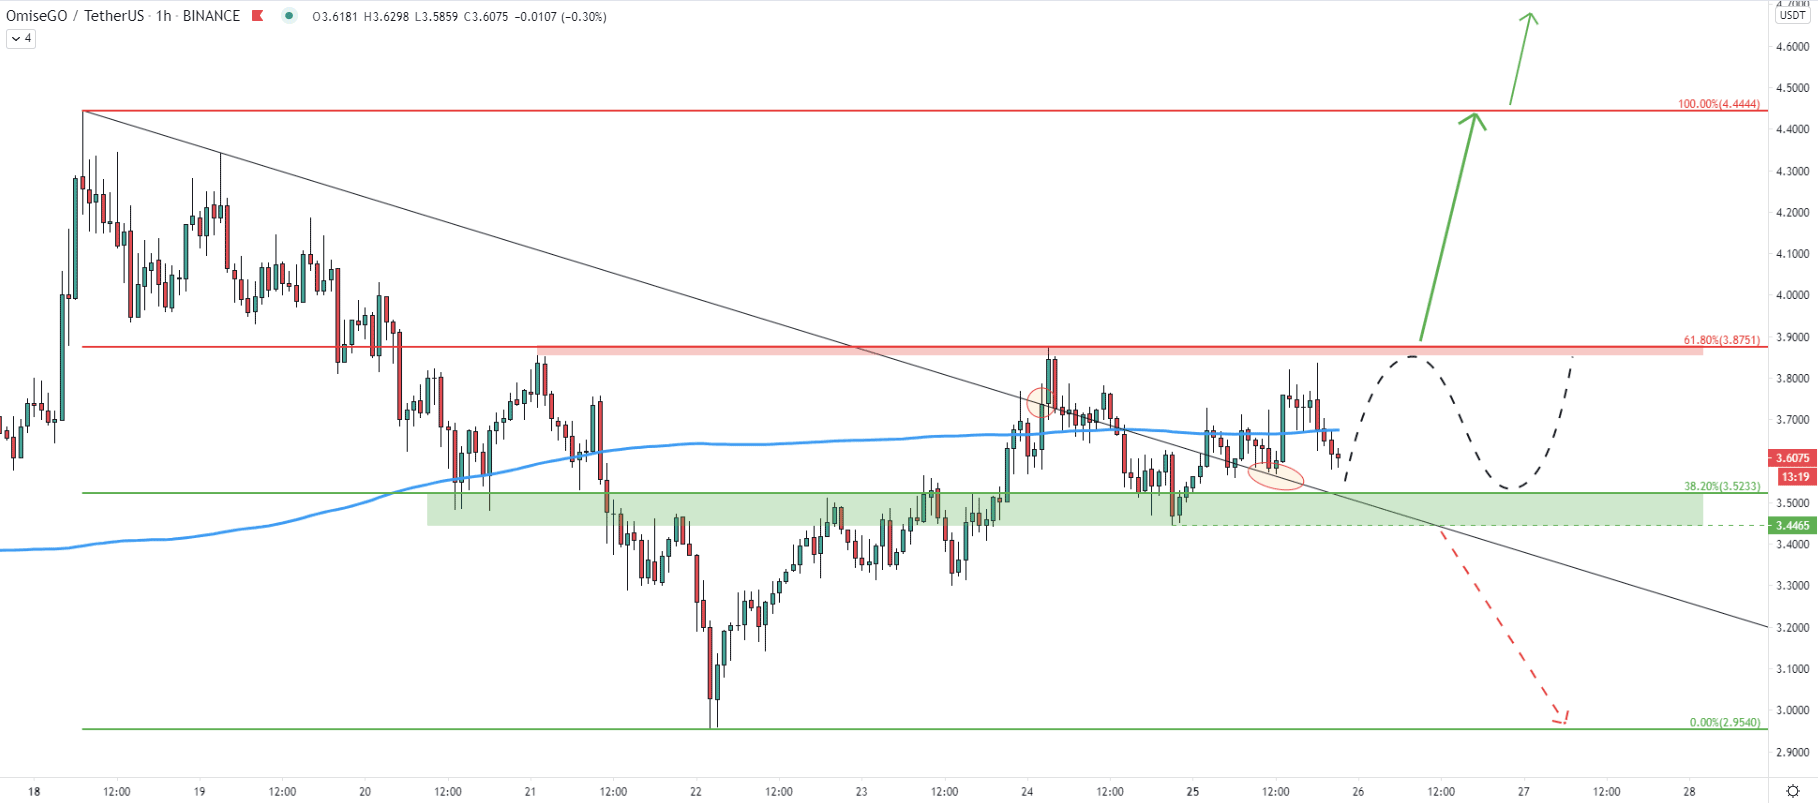
Speaking about the uptrend potential, it could be too early for wales to get in. This is because the price is currently ranging between the 3.44 support and 3.87 resistance area. At the same time, OMG is dancing around the 200 EMA, which shows that there is some indecision. It is highly likely that buyers will be waiting for a clear break above the 3.87 resistance, which s confirmed by 61.8% Fibonacci retracement level. Before that happens, the price is likely to continue range trading and/or re-testing the 3.50 support area.
OmiseGo long term trend remains bullish, and the continuation can take place relatively soon. Nonetheless, the price is currently stuck between the support and resistance, and it is very important that the resistance is broken for the uptrend to start.
As per the daily chart, there are two key resistance levels, each of which is confirmed by two Fibonacci retracement levels. These are 5.30 and 6.15 price areas.
As per the hourly chart, the price is currently consolidating. Break below the 3.44 support will immediately invalidate the bullish outlook. Such price action is likely to result in a fast price decline, potentially to re-test the 3.00 psychological support area.
Support: 3.52, 3.44, 3.00
Resistance: 3.87, 4.44, 5.30, 6.15


