
Published: November 10th, 2022
Maltese crypto exchange OKEx and the OK Blockchain Foundation released the crypto OKB, which investors can use as a native token to buy, sell and exchange cryptocurrencies through the OKEx platform.
The exchange enables wide trading pairs selection, fourth in trading volume and third in liquidity. OKEx shares many similarities with Binance, the crypto exchange giant, with some key differences. The OKEx platform focuses on enabling options trading for users and has its mining service. Binance fights to offer worldwide crypto services.
The utility token of OKEx is OKB, which enables users to access special features of the crypto exchange. The coin is used for platform governance, granting users access to voting, paying, and calculating trading fees, alongside rewarding users who hold OKB.
Investors' sentiment on the crypto market is not positive, as there was a 27% decrease in the crypto market cap in the last seven trading days. Moreover, the news regarding the bankruptcy of the FTX platform encouraged bears to join the market, where investing in this field has become challenging.
However, the crypto market has potential for future growth, where a lower price is a good option for long-term trade. Moreover, the OKB price shows a buyers’ interest from the near-term support level, which could provide a decent gain once the bull run starts.
Let’s see the future price direction of OKB from the OKB/USDT technical analysis:
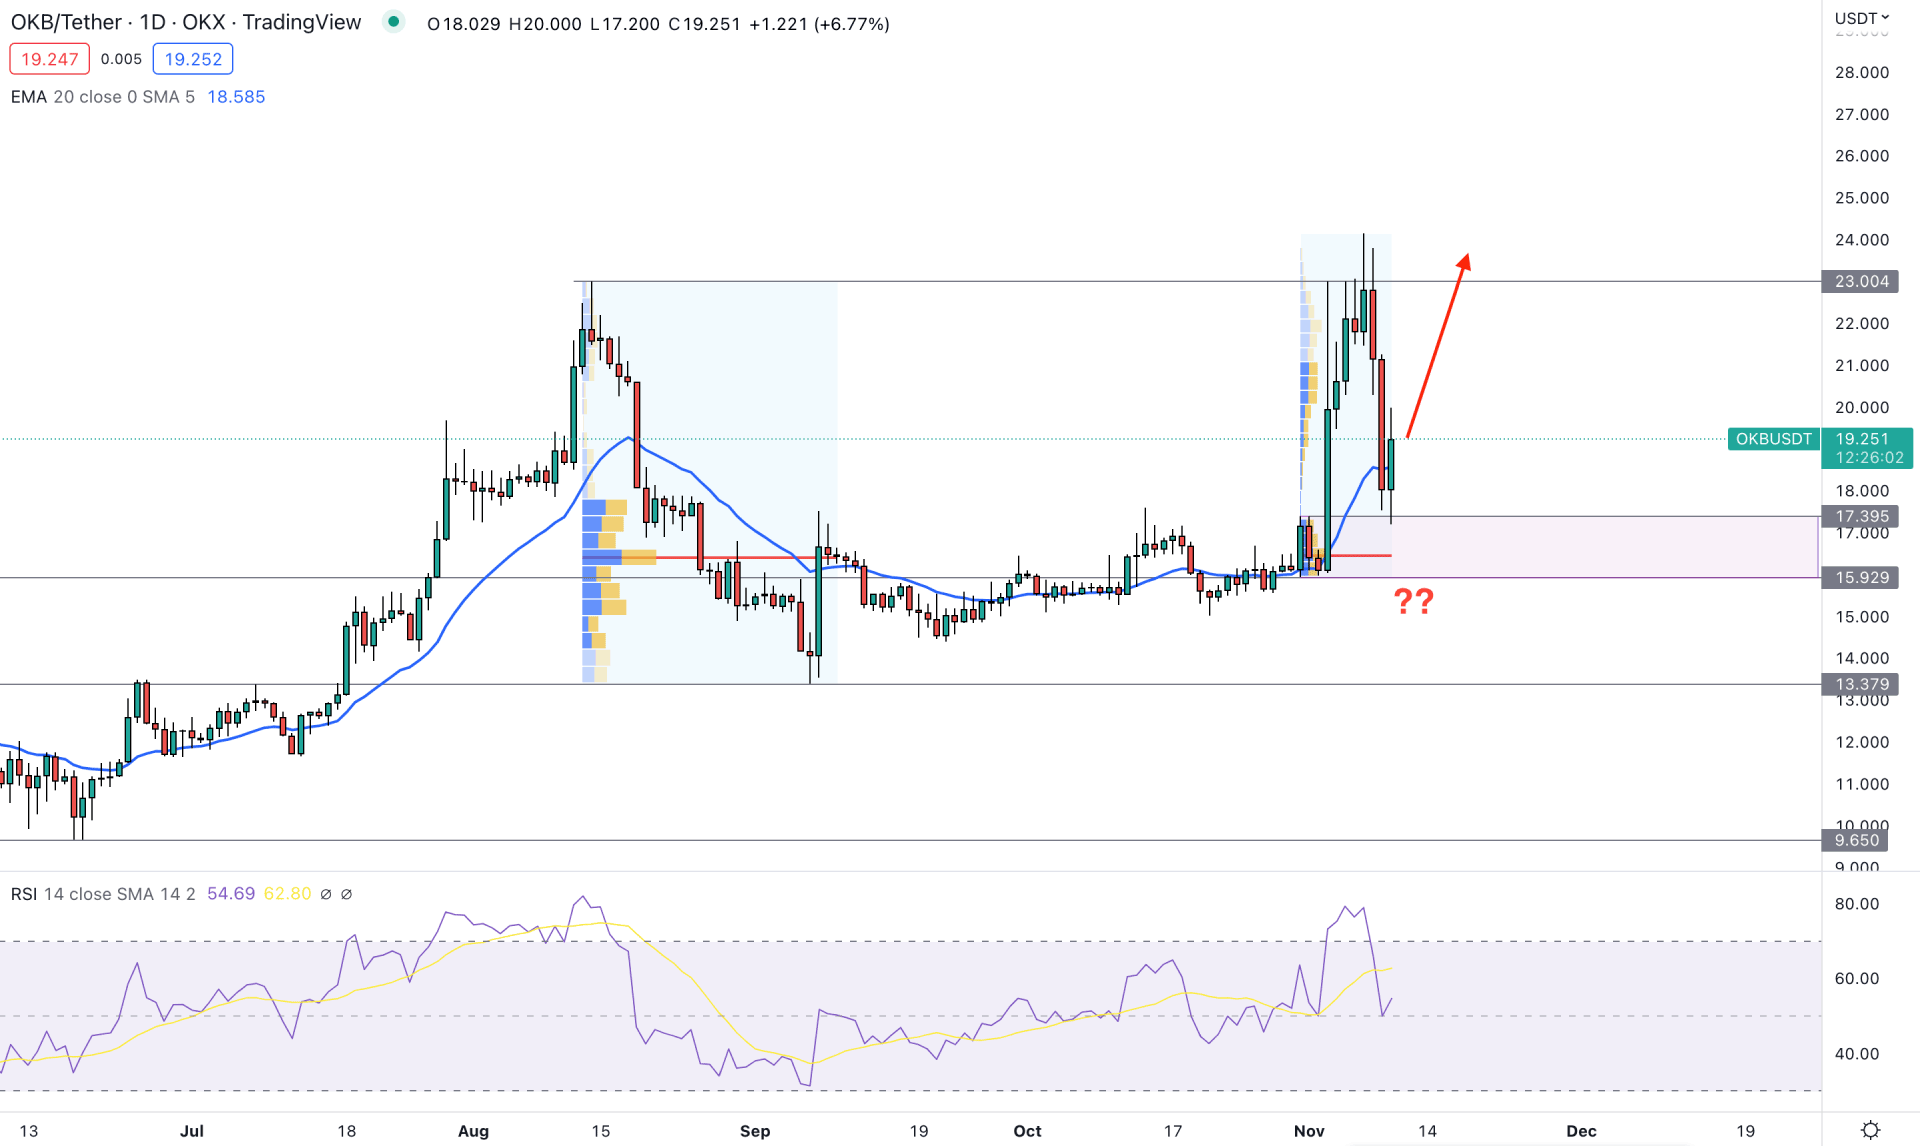
According to the daily price structure of OKB, the broader outlook for this token is still bullish. The price kept pushing higher since July 2022, when multiple higher highs formed during that time.
After making a new high in August, bears took control of the price, but instead of pushing down, they ended up with corrective price action from September to October.
In the most recent chart, the price showed a huge buying pressure from the dynamic 20 EMA support, which made a new higher high above the 23.00 level. However, the broader crypto crash last week influenced bears in the market, it is still trading within a buying area.
In this price structure, the 17.39 to 15.32 zone is the near-term demand zone, from where the price already showed buying pressure. The dynamic 20 EMA is below the price, working as a support level, while the RSI is above the 50% neutral level.
Based on the current price structure, the buying possibility in the OKB is valid as long as bulls hold the price above the 15.32 key support level. In that case, any intraday bullish pressure could send the price towards the 23.00 psychological level.
On the other hand, breaking below the 15.90 level with a bearish daily candle could offer a short opportunity, targeting the 9.65 support level.
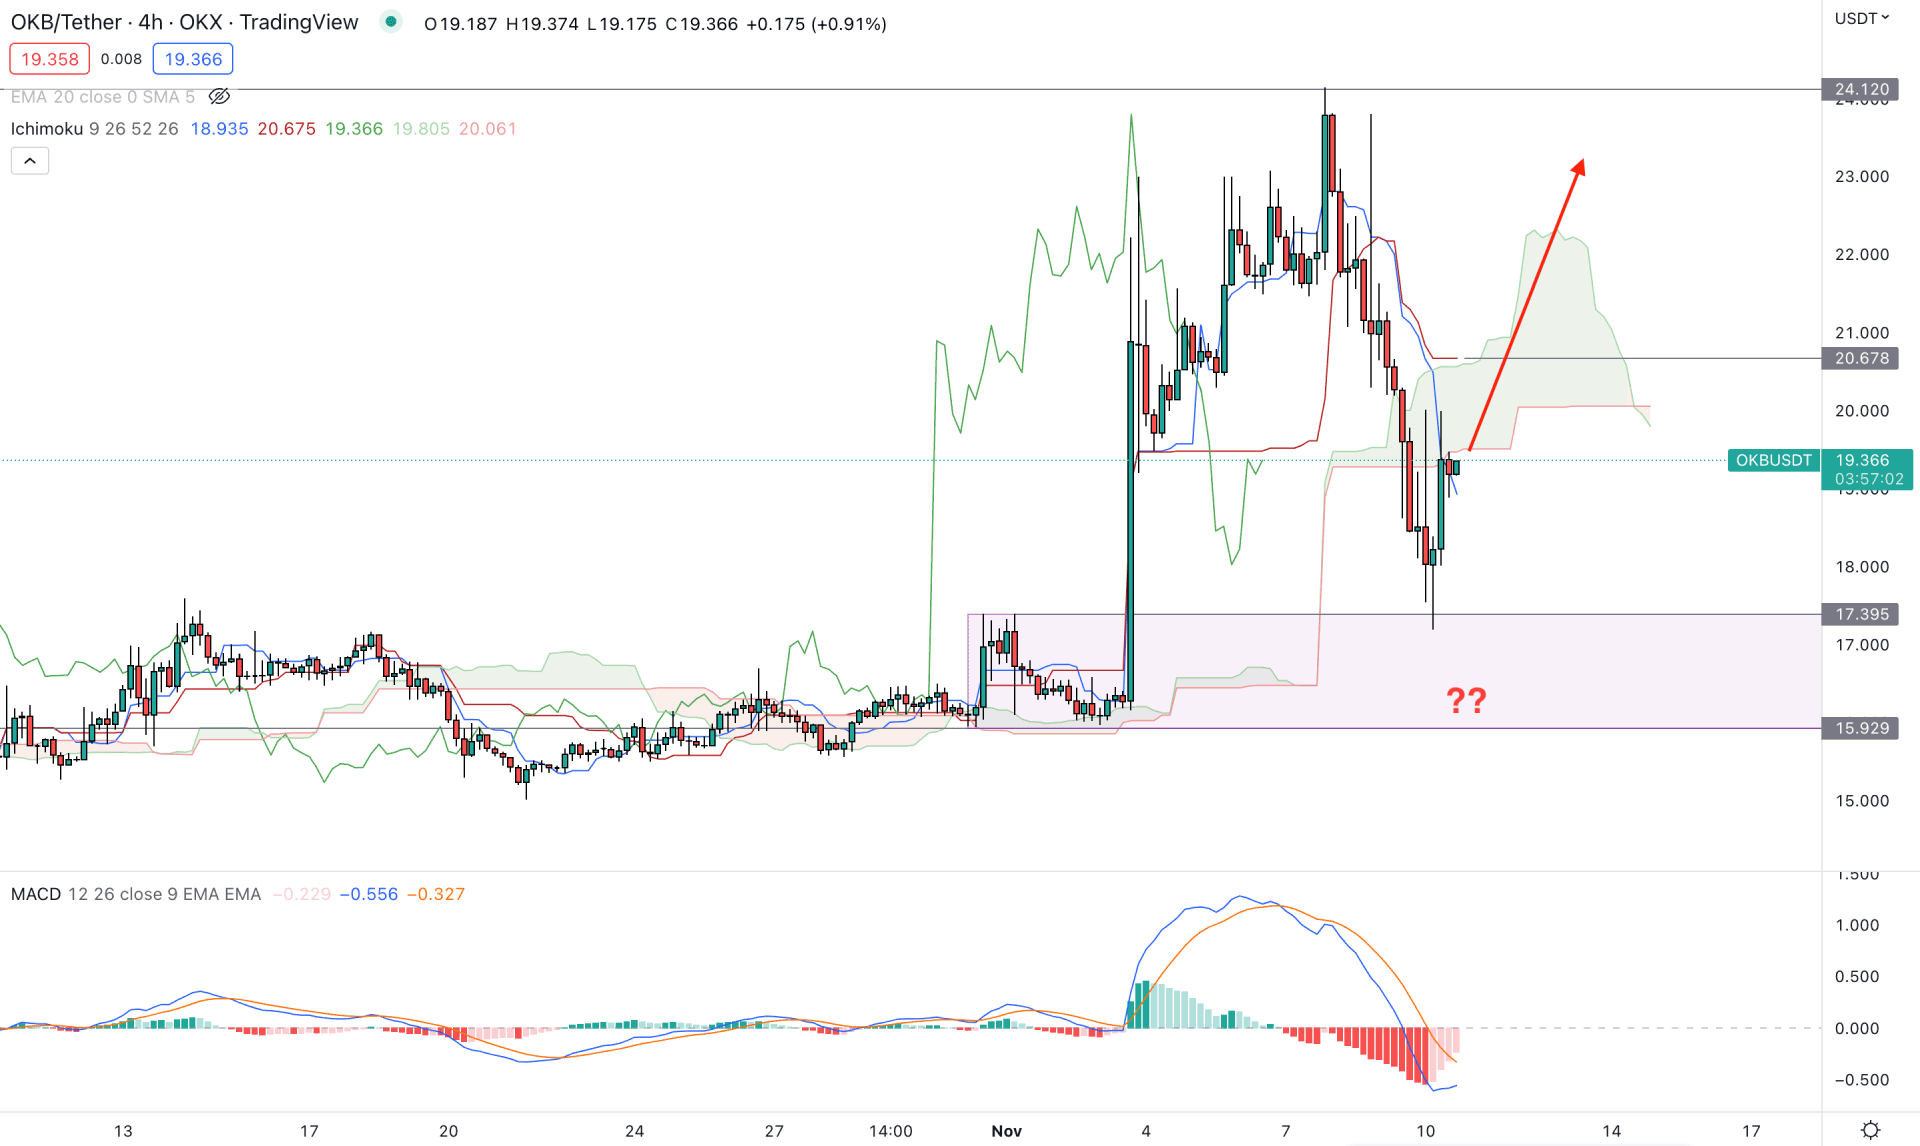
In the H4 chart, the buying pressure is also solid, whereas the recent bearish momentum is just a correction of the broader market outlook.
Although bears pushed the price below the cloud support, it still trades above the 15.92 key support level. In that case, the bullish trend continuation opportunity needs a recovery above the Kumo Cloud with a bullish H4 candle close.
The indicator window shows how the MACD Histogram is losing its momentum below the neutral line while the MACD line is yet for a bullish crossover.
Based on the current outlook, the bullish trading opportunity needs a recovery above the dynamic Kijun Sen with a bullish crossover in MACD lines. In that case, the upside pressure could extend towards the 24.12 swing high. However, breaking below the 15.92 level would eliminate the current outlook and lower the price towards the 10.00 area.
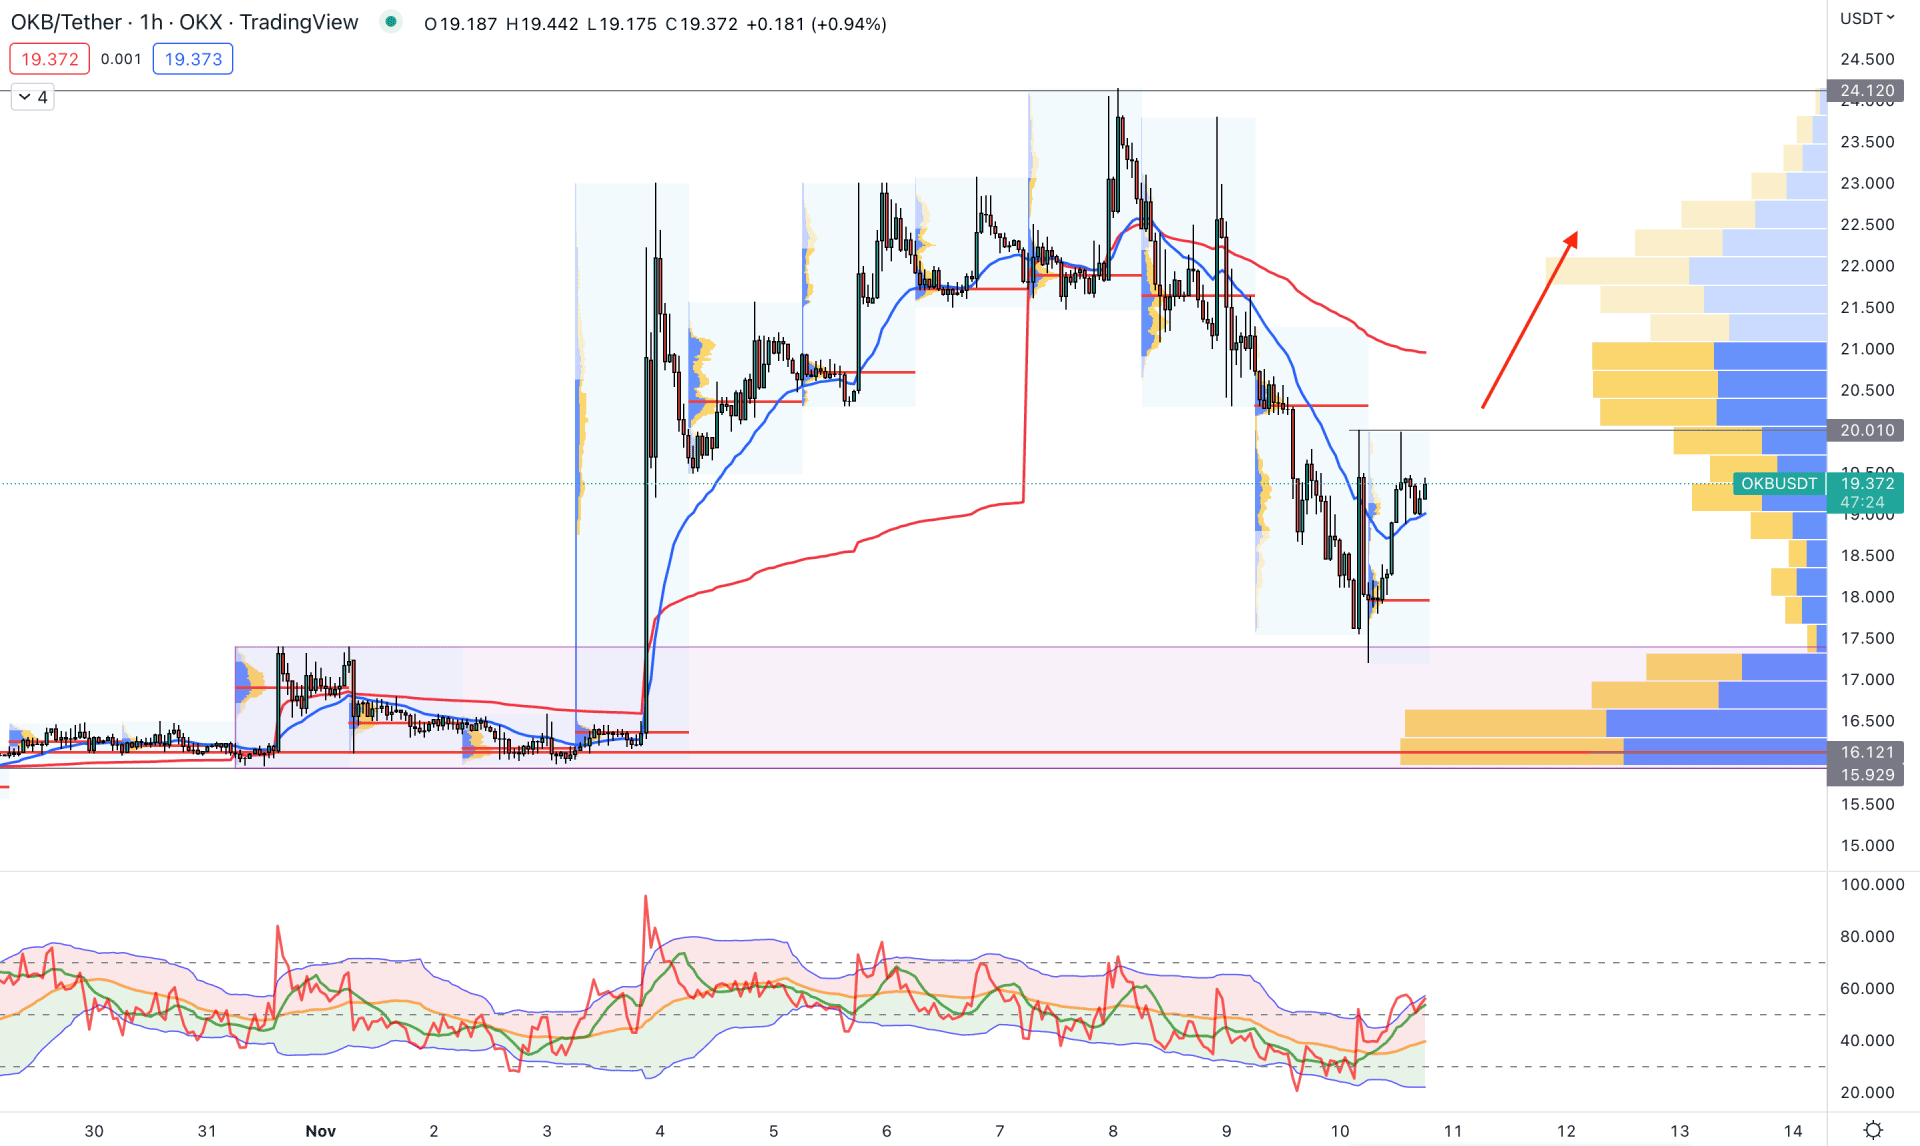
In the intraday chart, the price tapped into the demand zone and formed a double-top pattern, which indicates liquidity above the 20.00 level. Moreover, the visible range high volume indicator shows that the price is above the 16.21 high volume level, which is a buyers zone.
The corrective momentum is visible from the dynamic 20 EMA and weekly VWAP position, where a bullish recovery above the VWAP resistance is needed to form a buying signal. The traders' dynamic indicator is also within the buyers' zone, indicating a possible upside pressure.
Based on this momentum, a bullish H1 candle above the VWAP level would offer a long opportunity, targeting the 24.12 level. However, breaking below the 15.90 level with an H1 close might alter the current market outlook and lower the price towards the 10.00 area.
Based on the current market outlook, OKB price is within a bearish correction, where investors wait for the momentum to end. In that case, any intraday higher high formation could offer a long opportunity, targeting 24.12 as a primary target level.


