Published: April 19th, 2023
The value of the OKB reached $56.47 on April 15th, a level not seen in two months. This represents a 26% increase over the past week. OKB is trading at $54.27, an increase of 2.85% in the last 24 hours.
Despite a Fear & Greed Index score of 36.20, the most recent price forecast for OKB indicates a bullish sentiment, with an 11.67% increase in value over the past 30 days. However, current market conditions indicate that OKB is trading below the 200-day and 50-day simple moving averages, indicating a buy signal.
OKB's performance is driven by OKX's recent alliance with Blur.io, an Ethereum-based NFT marketplace. This partnership facilitates the complete integration of the OKX Wallet onto the Blur.io platform, allowing OKX users to connect their wallets and transact directly. OKX is also streamlining its Earn offering by separating it into three categories: Simple Earn, On-chain Earn, and Structured Products.
Overall, these updates demonstrate OKX's dedication to providing its users with a seamless experience while providing various products and services. However, investors should closely monitor the situation given the ambiguous outlook for OKB's market.
Let’s see the upcoming price direction from the OKB/USDT technical analysis:

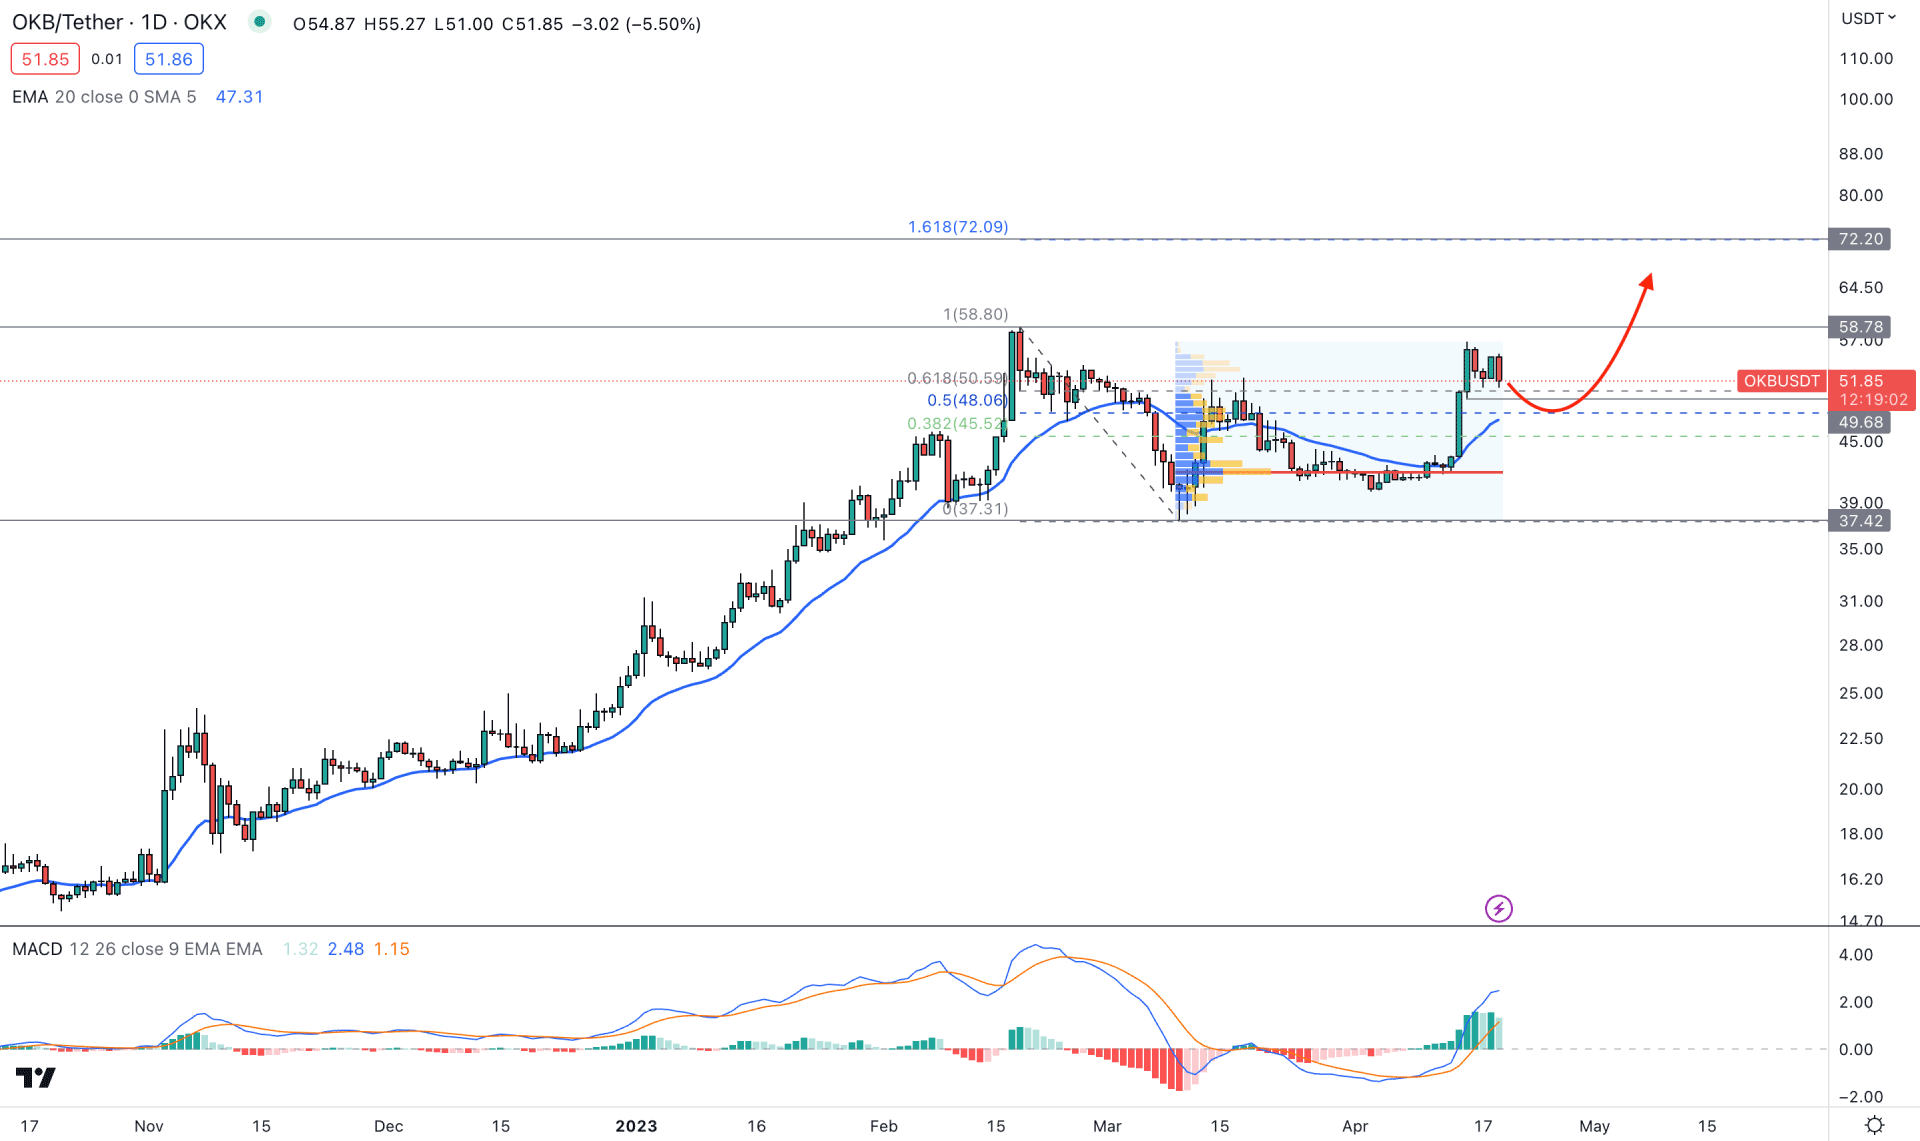
In the OKXUSDT daily chart, the outlook is bullish as the price aims higher from left to right. Therefore, the primary intention for investors is to look for long opportunities after a confirmation from the lower timeframe price action.
After making a valid top at the 58.78 level, the price went sideways with a corrective momentum. As the existing trend is bullish and no significant volatility is seen during the correction, the price will likely extend the bullish momentum in the coming days.
According to the Fixed Range High Volume indicator, the highest activity level since 10 March 2023 is seen at 41.83 level, which is below the current price. It is a sign that bulls are in control over bears, where a minor downside correction is pending as a mean reversion.
The dynamic 20-day Exponential Moving Average in the main price chart is below the price and aimed higher. Moreover, the 50-day EMA and 100-day EMA also support bulls, while the MACD Histogram is strong above the neutral line.
Based on the daily price outlook, the broader bullish trend is still active, and bulls can regain the momentum at any time. However, a minor downside correction is pending as the price made a gap with the dynamic 20 EMA level.
Therefore, the bullish approach is looking for long opportunities once the correction ends. Any bullish rejection from the 49.68 to the 45.00 area could offer a bullish opportunity, targeting the 60.00 level.
On the other hand, breaking below the 40.00 line could eliminate the bullish structure and lower the price toward the 37.00 level.

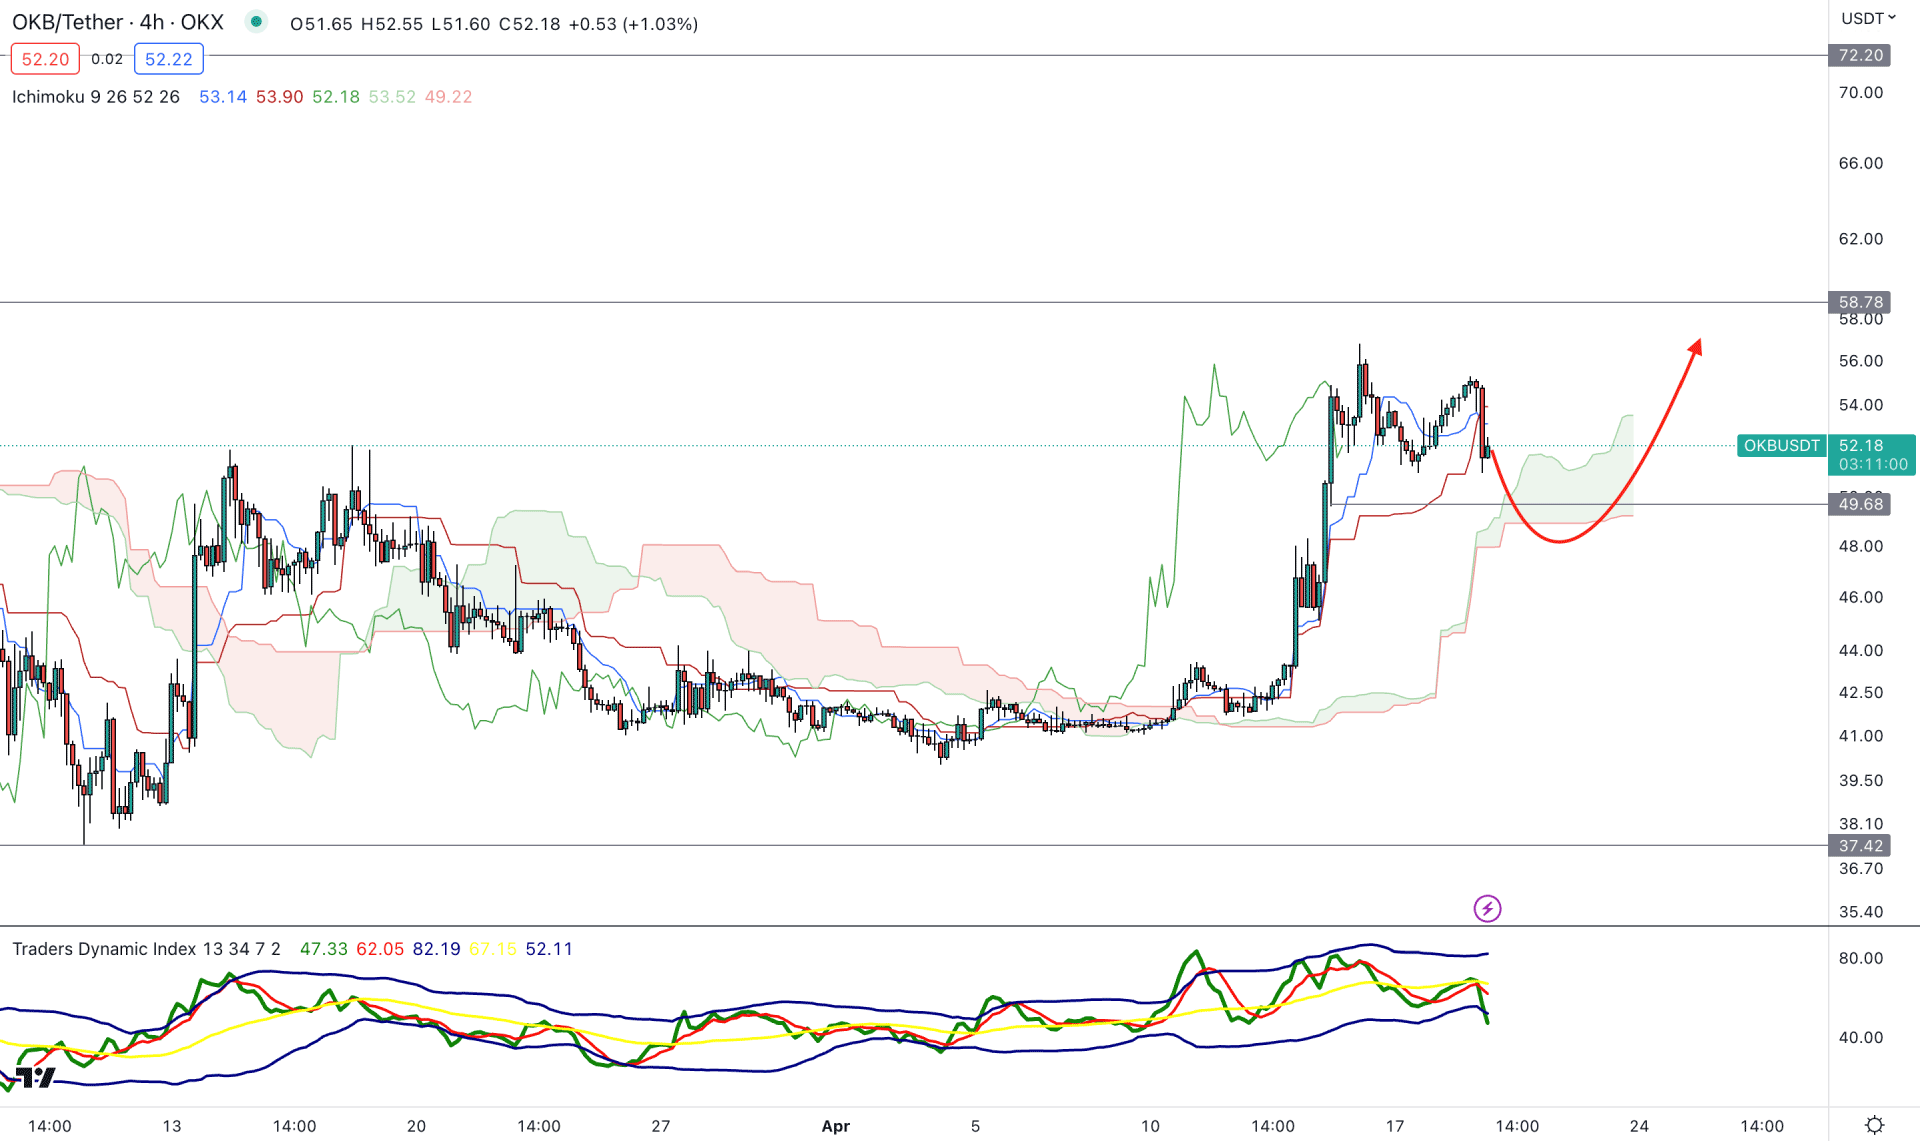
In the H4 chart, the current market outlook is bullish as there is a strong breakout above the Ichimoku Kumo Cloud support level. Moreover, the thickness of the future cloud is solid to consider the long-term direction bullish.
In the indicator window, the Traders Dynamic Index shows the market dominance of bulls/bears, whereas the current reading shows a strong seller's presence in the market. The TDI level reached the lower band, from where a bullish recovery may come.
Based on the current price outlook, a break below the 49.68 near-term level could fill the imbalance at the 48.28 level. However, an immediate recovery with a bullish H4 candle above the dynamic Kijun Sen could offer a long opportunity, targeting the 72.00 level.
On the other hand, breaking below the 48.00 level with a bearish H4 close could lower the price to the 37.42 support level.

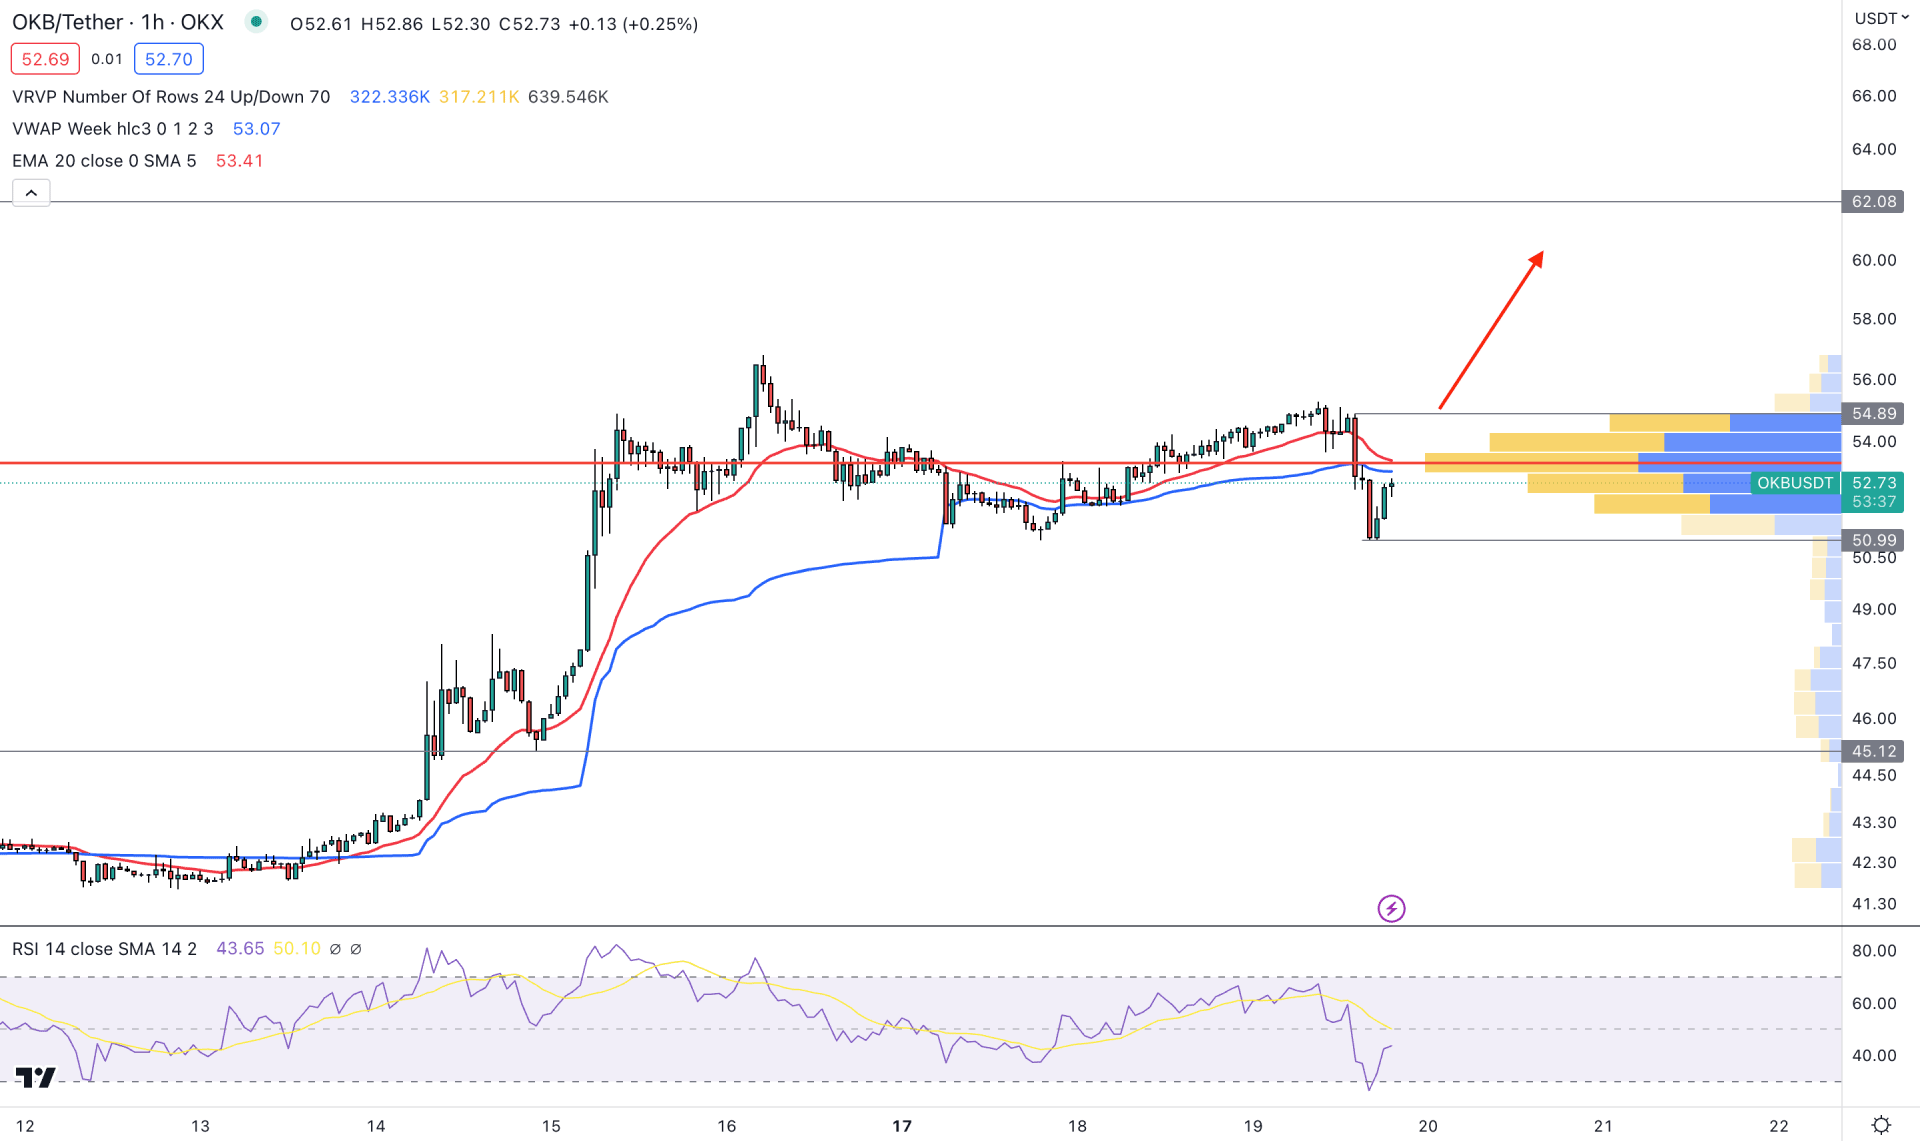
In the hourly chart, the current market outlook is bullish, but a strong trading volume is seen at the 53.34 level. Therefore, a bullish break above the high volume level is needed before looking for long trading opportunities.
In the main chart, the price moves below the dynamic 20 EMA and weekly VWAP, which is a sign of a sellers’ presence in the market. Moreover, the current RSI is at an oversold zone from where a V-shape recovery is seen.
Based on the current outlook, a bullish break above the 54.89 level would invalidate the bearish possibility and open a long opportunity, targeting the 62.00 level. On the other hand, a new H1 candle below the 50.00 level would lower the price toward the 45.00 level.
Based on the current market outlook, OKB/USDT will likely increase in the coming days. However, a minor downside pressure may come due to the strong US Dollar. Investors should closely monitor the price to find the best area to join from the H4 chart.