
Published: March 10th, 2026
The introduction of Orbit, an in-app social network that combines trading with social interaction, saw OKX's native token, OKB, surge more than 25% in a single day.
A notable increase in trading activity coincided with the abrupt shift, indicating that traders were swiftly positioning themselves surrounding the news. Without ever departing the OKX exchange interface, the functionality enables traders to organise livestream chats, share market feedback, and build communities.
Additionally, Orbit offers validated performance data that shows traders' actual performance. Data such as earnings and losses, win rates, and past success across several time periods can be displayed by participants who opt to disclose their statistics.
The corporation that operates the New York Stock Exchange (NYSE), Intercontinental Exchange (ICE), has made a strategic investment in OKX in addition to the Orbit launch.
One of the projects being discussed is listing authorised cryptocurrency futures contracts using current price data from OKX, which could expose institutional investors to digital investments without needing them to own the tokens directly.
Let's see the further development of this coin from the OKB/USDT technical analysis:
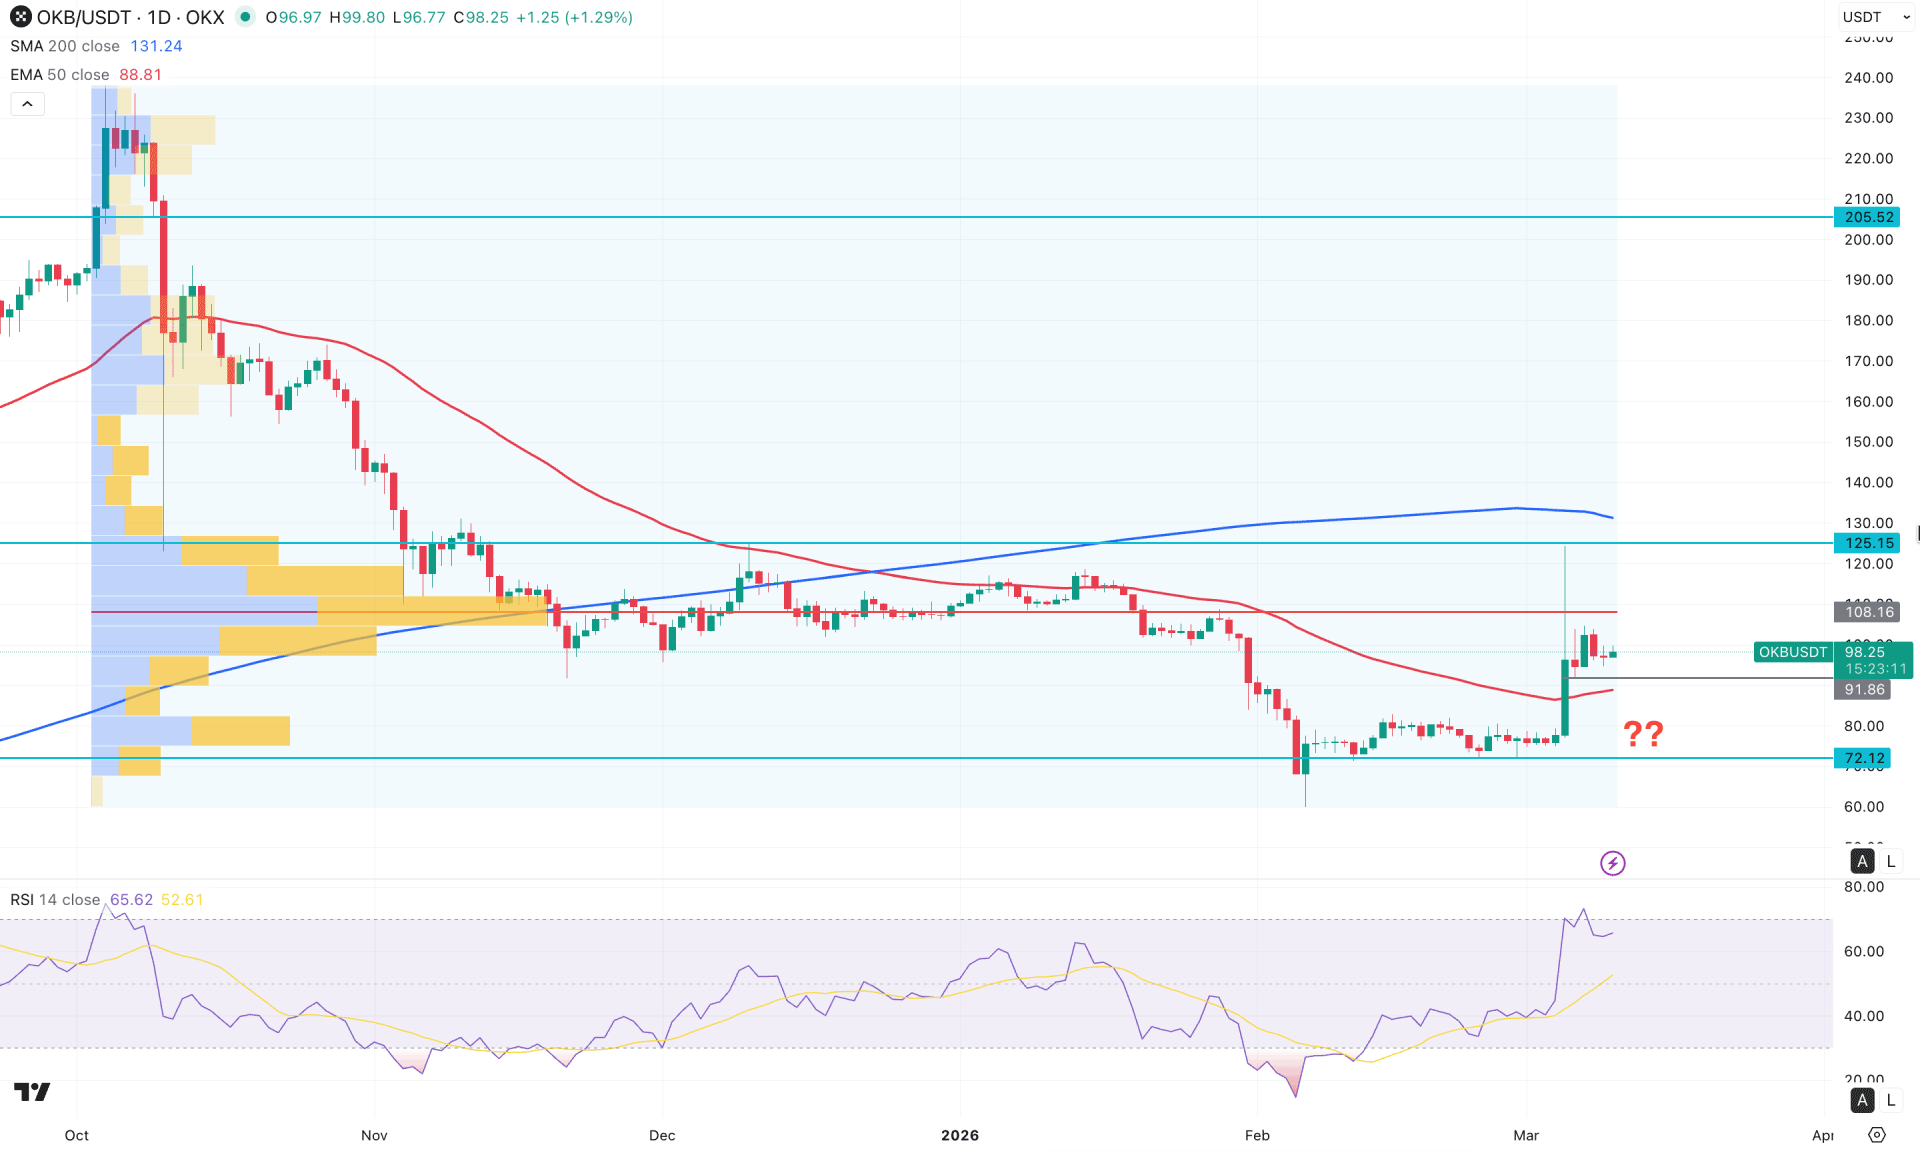
In the daily chart of OKB/USDT, the major market momentum is bullish as the price formed a bullish rebound from the 72.12 level with a counter-impulsive momentum. Moreover, the buying pressure is supported by strong fundamentals, suggesting a strong price stability.
In the higher timeframe, the price is trading above the existing monthly high, suggesting bullish pressure after a long bearish rally. The weekly timeframe shows the same outlook, where the recent weekly chart shows a buying pressure but failed to form a new swing high.
In the volume structure, the largest activity level since October 2025 is just above the current price and is working as a crucial resistance. A failure to break that level is already visible in the daily chart, where a valid bullish recovery could be a potential long opportunity.
In the main price chart, the price is trading bullish above the 50-day Exponential Moving Average with multiple bullish candles above it. It is a sign of a decent bullish recovery, which could be a crucial achievement by bulls.
On the other hand, the 200 Day SMA is still above the current price, where the wider gap suggests a pending bullish correction as a mean reversion.
In the indicator window, the Relative Strength Index (RSI) has rebounded from the oversold position and recovered above the 50.00 level. As the current line hovers near the 70.00 overbought area, we may consider the market momentum as bullish.
Based on the overall market structure, the OKB/USDT is more likely to extend the buying pressure, where the immediate resistance is located at the 125.15 level. Moreover, overcoming the 108.16 high volume line with a bullish daily close could increase the buying pressure by taking the price above the 150.00 level.
The alternative trading approach is to look for bearish price action at the current price area. A daily close below the 91.86 level could increase the bearish opportunity. In that case, the price might visit the imbalance by testing the 75.00 level before offering another long opportunity.
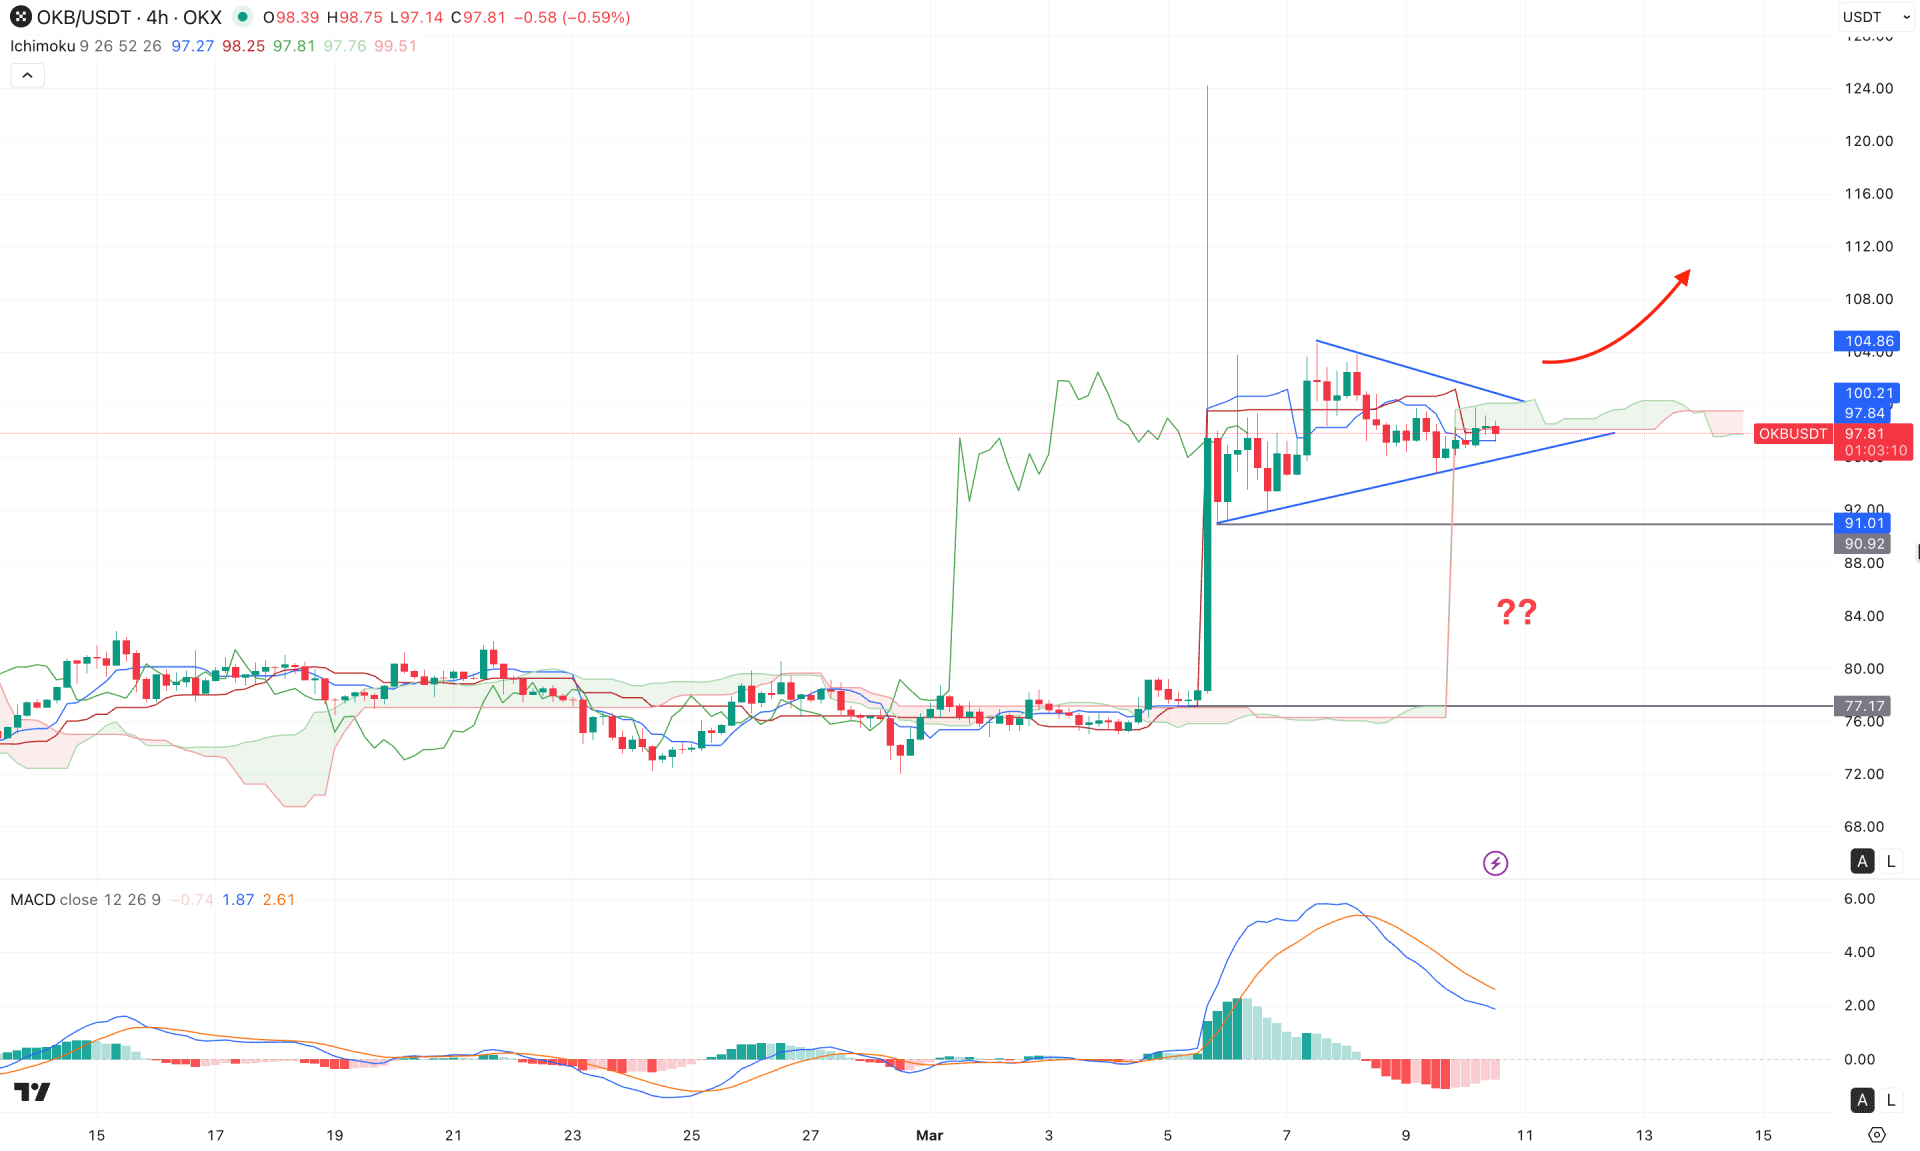
In the H4 timeframe, the current market momentum remains bullish as the price failed to form a pump-and-dump pattern after the recent bullish cloud breakout. Instead, the price is trading sideways within a symmetrical triangle, which suggests a potential bullish continuation.
In the future cloud, both lines are moving sideways, signalling a corrective market structure. However, the price is trading above the dynamic Kijun-sen level, which could be a positive factor for the bulls.
The MACD histogram shows a similar outlook, where the signal line has formed a bearish crossover at the top. Moreover, the MACD histogram still reflects a bearish bias, although the downside momentum appears relatively weak.
Based on this outlook, impulsive buying pressure is visible on the main price chart, and a break above the trendline resistance could validate a long opportunity, targeting the 120.11 level. On the other hand, a deeper pullback toward the 91.01 support level is possible before another long opportunity emerges.
An extended selling pressure below the 80.00 psychological level could invalidate the bullish structure and push the price toward the 77.17 key support level.
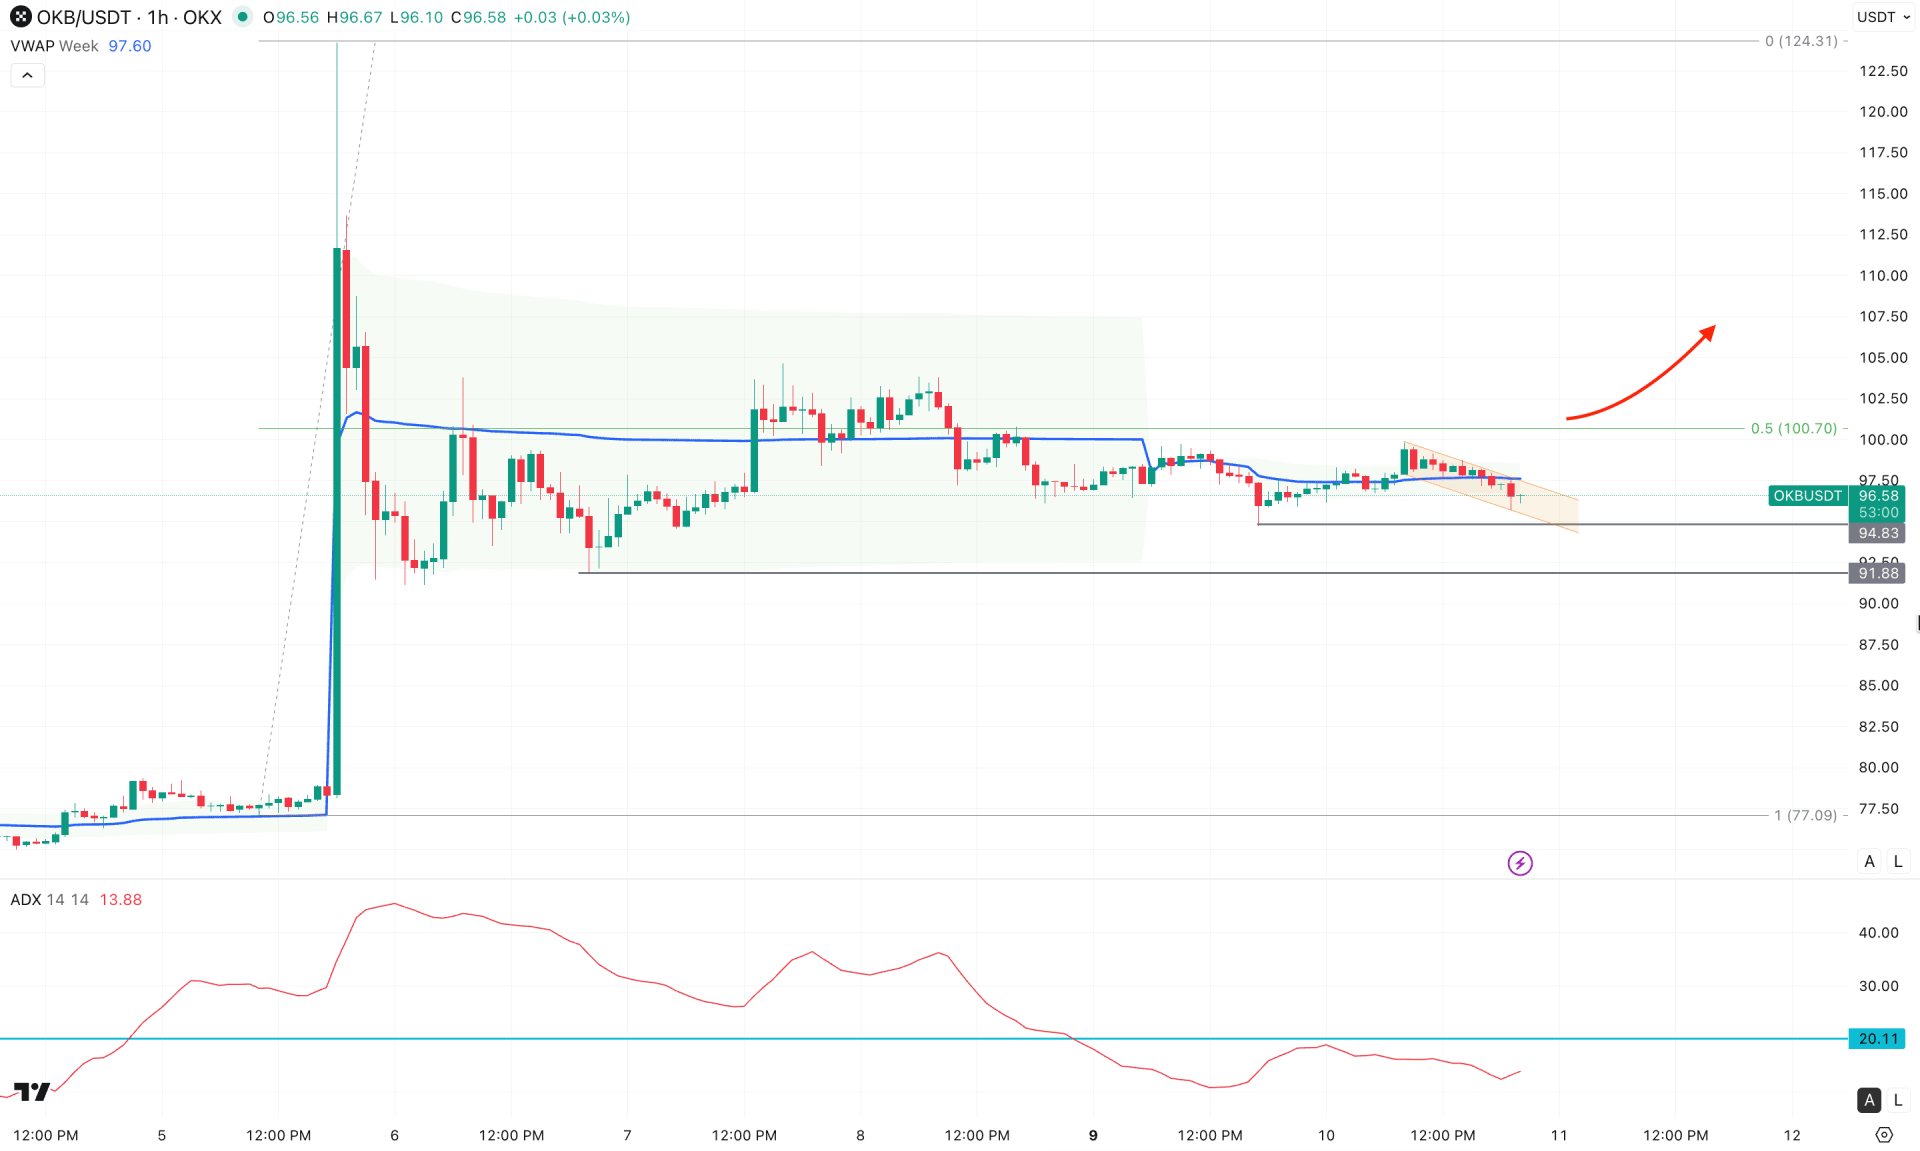
In the hourly timeframe, the recent price is trading sideways after having an impulsive bullish pressure. Later on, the price went sideways instead of making a pump and dump, which signals a bullish continuation opportunity. Moreover, the price has completed the correction by moving below the 50% Fibonacci Retracement level of the existing price swing that might attract bulls.
In the most recent chart, a corrective bearish pressure is visible within a descending channel, taking the price below the weekly VWAP line. Moreover, the ADX level is marked below the 20.00 line, signalling a corrective trend.
Based on the hourly price outlook, the price is trading at the discounted zone from where any bullish price action could offer a long opportunity. The conservative approach is to wait for a channel breakout with a stable price above the VWAP line. The immediate target of the bull run is at the 100.70 level, which needs to be breached before heading towards the 124.00 area.
On the other hand, the immediate support level is located at the 93.82 level, which could be tested as a channel extension. An unstable price at the channel resistance could signal a deeper discount towards the 90.00 area.
Based on the overall market structure, OKB/USDT has the potential to grow higher based on the recent development. The on-chain data is supportive of bulls, as is the price action. In that case, a closer attention to the intraday price could offer an early trading opportunity.


