Published: January 18th, 2024
OKX Platform declared on Tuesday that it has obtained regulatory authorization in Dubai, enabling the delivery of cryptocurrency services to retail customers. OKX Middle East has been granted a Virtual Asset Service Provider (VASP) registration by the Virtual Assets Regulatory Authority (VARA) of Dubai to facilitate exchange services. Upon becoming operational, this authorization will allow OKX to provide spot and spot-pairs services to eligible retail and institutional clients.
Emirates of Arabia is proactively positioning itself as a global hub for the cryptocurrency industry by establishing VARA in March 2022. OKX's general manager for the MENA region, Rifad Mahasneh, was ecstatic about the development.
The OKX ecosystem heavily relies on OKB, a cryptocurrency issued by the OK Blockchain Foundation, and the Maltese cryptocurrency exchange OKX. OKX, which ranks fourth in trading volume and third in liquidity, is one of the world's largest exchanges.
Since its inception in 2017, OKX has developed into the preeminent international trading platform. OKX, founded in 2013 as an offshoot of the original OKCoin platform in China, has become an authority on cryptocurrency trading and features an API for algorithmic trading. Additionally, the platform includes a multi-currency portfolio and margin trading capabilities.
Let’s see the future price direction of this coin from the OKB/USDT technical analysis:
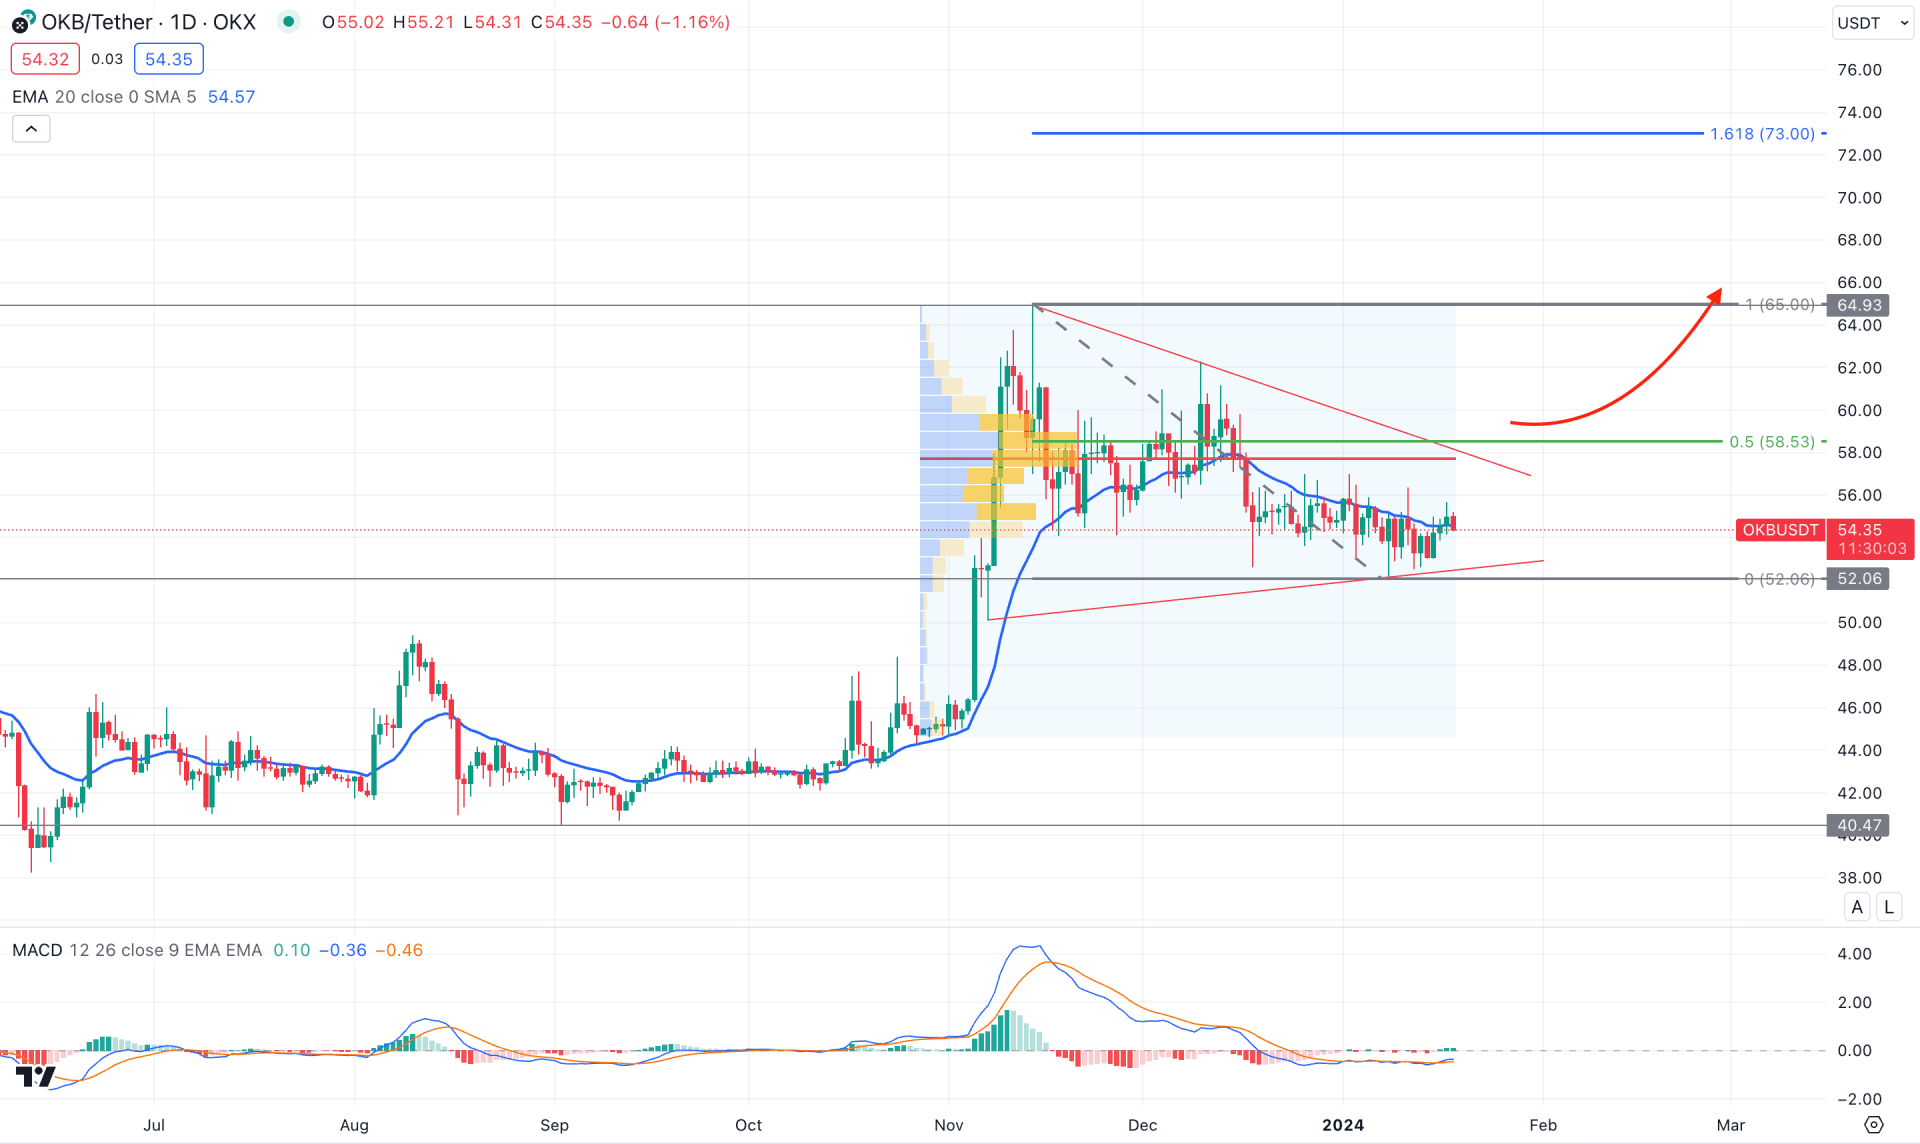
The ongoing buying pressure is valid in the daily chart of OKB/USDT as the recent price trades sideways after forming a top at the 64.93 level. As bulls hold the momentum for three months, with no significant counter-bearish selling pressure, we may expect an upward continuation in the coming days.
In the volume structure, the most active level since October 2023 is at 57.74 level, which is above the current price. As the current price trades sideways below the high volume level, investors might expect an upward continuation after taking over the high volume zone.
In the higher timeframe, the latest monthly candle closed as an inside bar to the previous impulsive pressure, which suggests buyers' presence in the market. On the weekly chart, ten consecutive indecision candlesticks are present after a bull run, which indicates no counter-impulsive selling pressure.
In the daily chart, the dynamic 20-day EMA aligns with the current price, suggesting a sideways momentum. Moreover, the recent price remains within a bullish pennant pattern, which could offer a long-term bullish opportunity after having a breakout.
In the secondary window, the MACD Histogram remained sideways within the neutral level while the Signal line formed a bullish crossover.
Based on this outlook, a high probable long opportunity might come after overcoming the 58.53 level with a daily close. In that case, the upward continuation could take the price towards the 73.00 level, which is a crucial Fibonacci Extension zone.
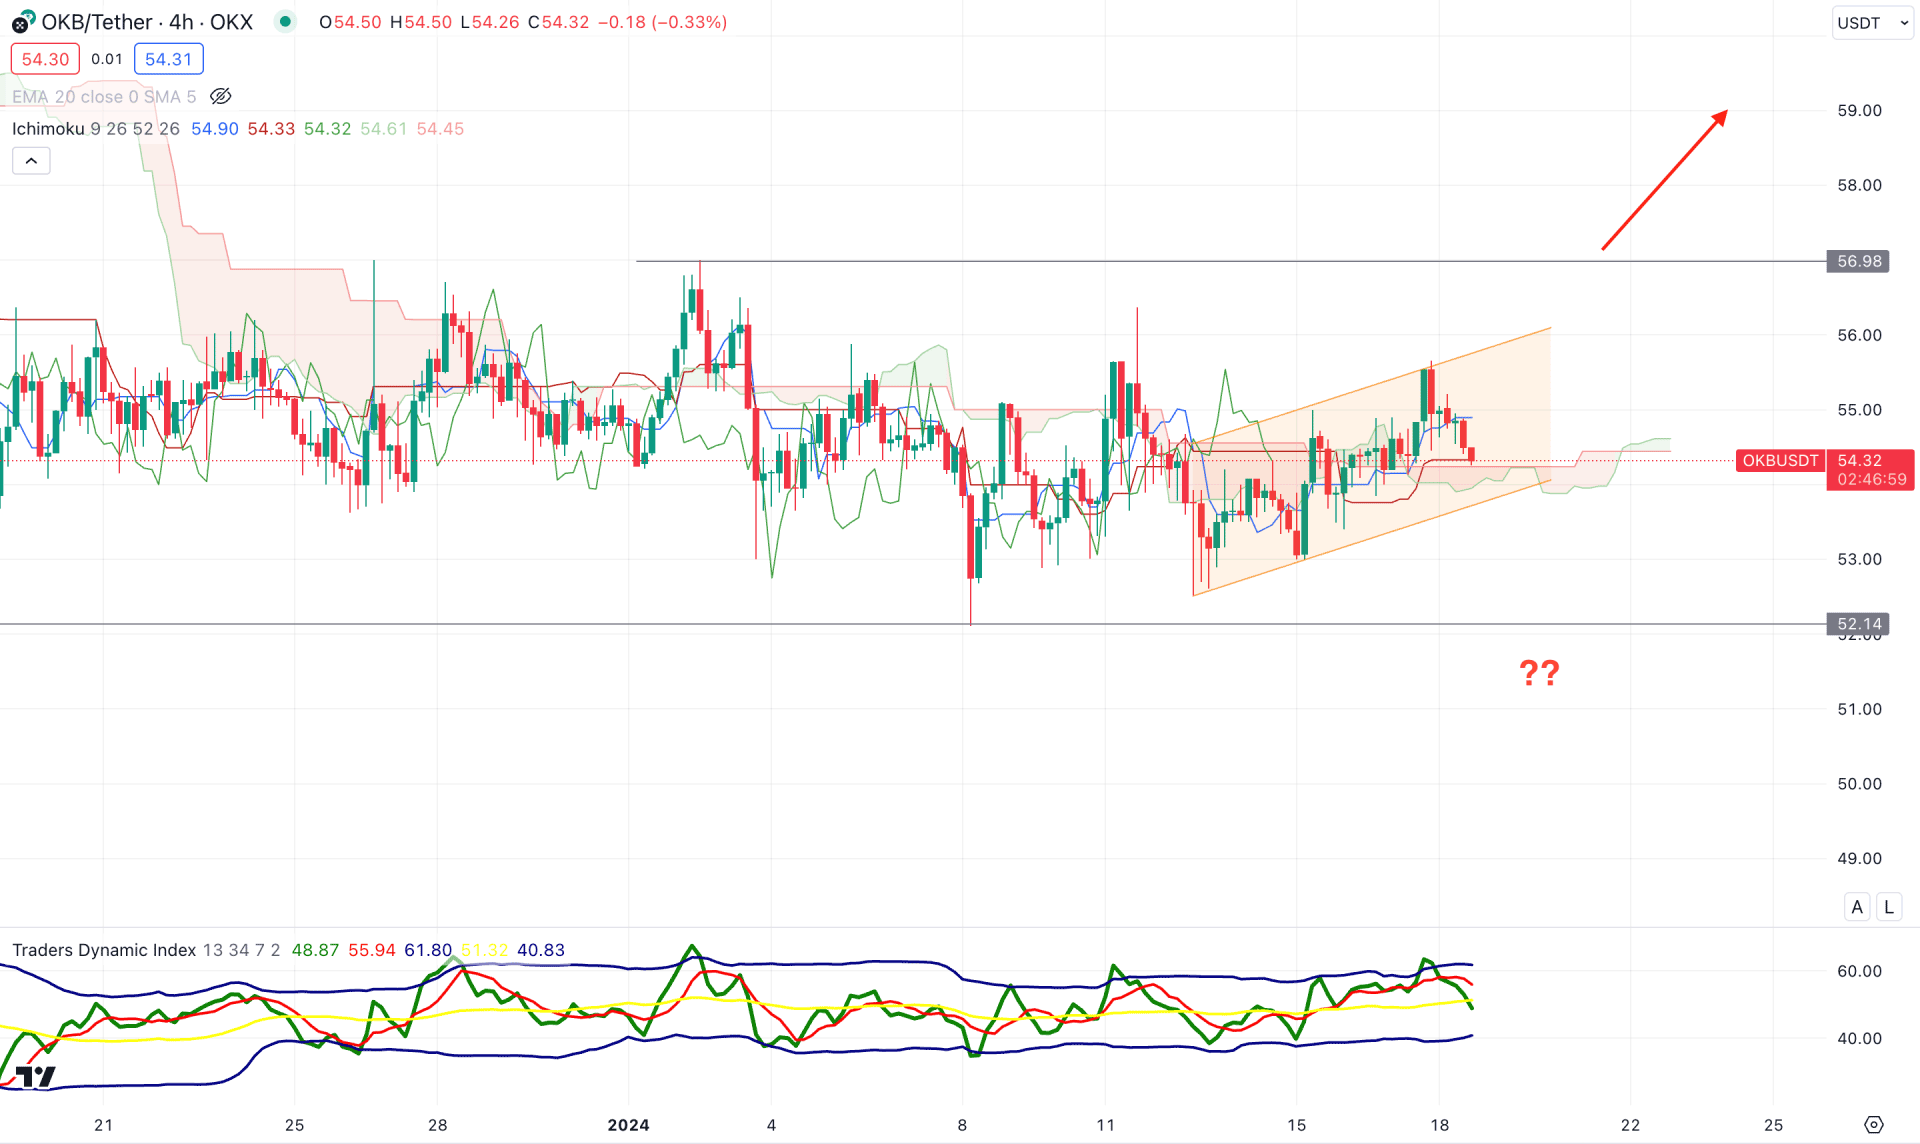
In the H4 chart, the most recent price action shows a corrective momentum as the price has remained sideways for a considerable time. In that case, a breakout could work as a strong bullish signal, followed by a long-term bullish leg.
In the Future Cloud, the Senkou Span A and B remained sideways, while the dynamic Kijun Sen worked as an immediate resistance. Meanwhile, the secondary indicator window shows a bullish possibility as the Traders Dynamic Index level moved above the 50.00 line.
Based on this outlook, a high probability of a long signal might come after having a bullish H4 candle above the 57.00 level. On the other hand, a deeper correction might happen after having an H4 candle below the 52.00 level.
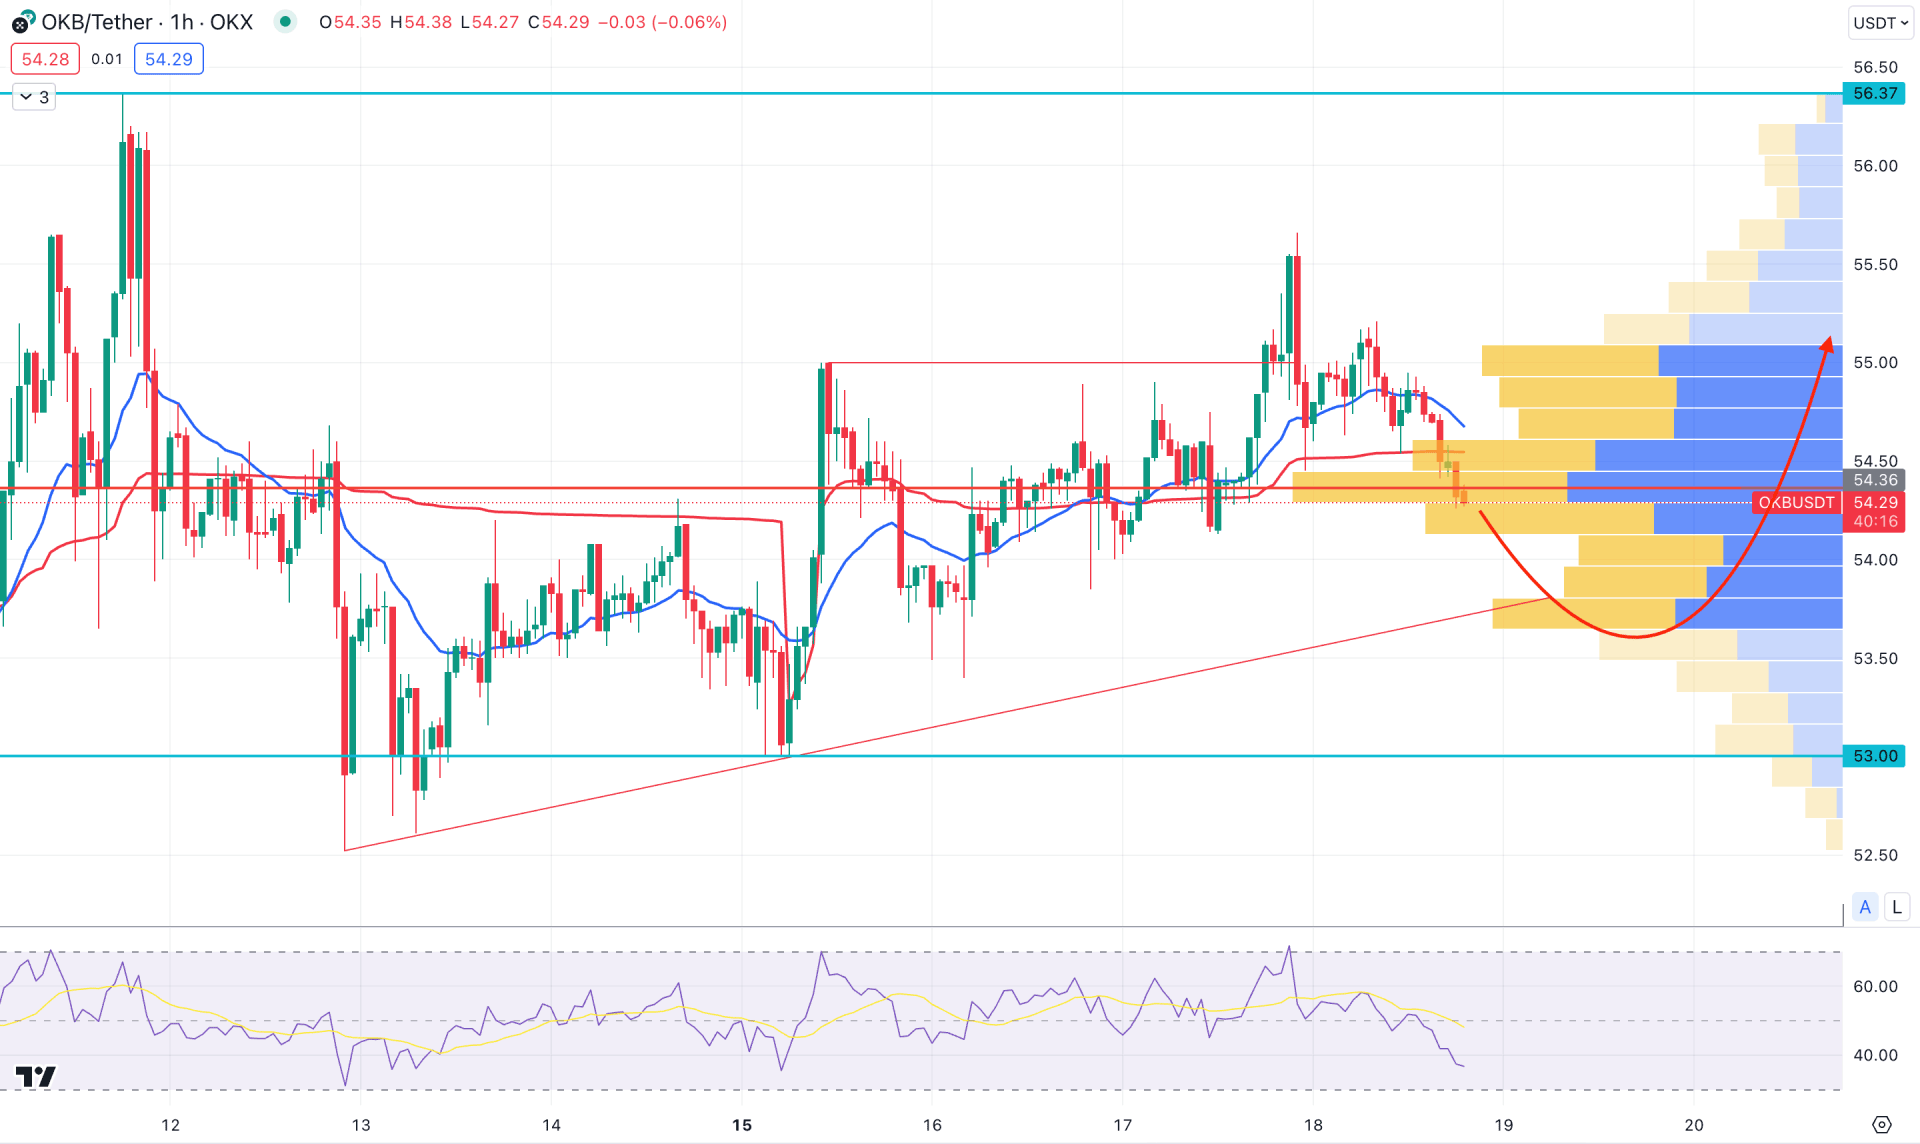
In the H1 chart, the most recent price trades below the visible range high volume level, suggesting an intraday selling pressure. However, a crucial trendline support holds the buying possibility, with enough retail liquidity below it.
In the secondary window, the Relative Strength Index (RSI) moved below the 50.00 line, indicating selling pressure in the market.
Based on this outlook, a downside pressure with an immediate recovery from the 53.90 to 53.00 area could be a long opportunity, targeting the 56.00 level.
Based on the current market outlook, OKB/USDT bulls could resume the existing trend after forming a pennant pattern breakout. However, an early bullish opportunity might come after having a long signal in the intraday chart.


