
Published: March 31st, 2021
The Ocean is a BigData utility token, which could be starting or already started to attract a lot of attention. Despite the fact that the total market cap is just above $600 million, and it is not even in the top 100 coins, this might change very soon. There are not many competitors to the OCEAN and comparing to other coins in the top 200, it is still lagging behind and there is some catching up to be expected.
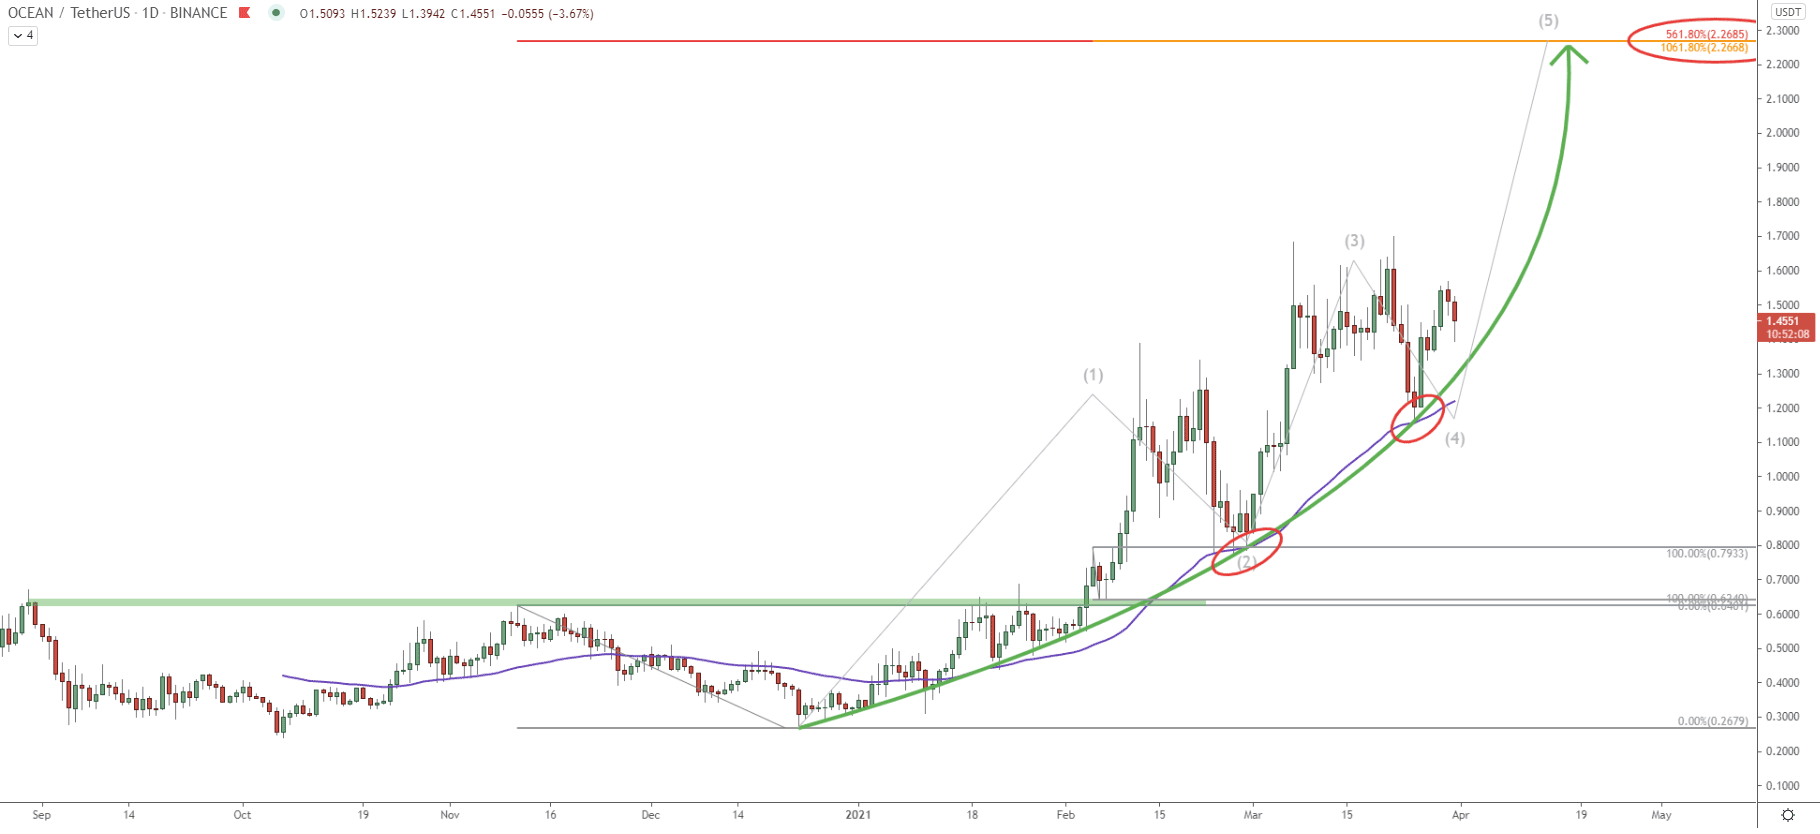
Having said that, time to move on to the technical analysis on the Daily timeframe. Until February 2021, the price of OCEAN/USDT stayed below the key resistance area near 0.62. But then the break above followed, which was the very beginning of a long-term bullish trend.
Based on the Elliot Wave theory, right now OCEAN seems to be finishing the corrective wave 4, which means that there is yet another and perhaps final wave 5 to the upside. The trend is clearly bullish as the price is producing higher highs and higher lows. At the same time, on each corrective wave down, OCEAN bounced off the 50 Exponential Moving Average. This implies that buyers are in complete control and the next move could push the price up to the 2.26 resistance area.
This resistance is based on two Fibonacci retracement levels, 1061.8% and 561.8% as can be seen on the chart. First Fibs was applied to the major pullback after the price bottomed out. The second Fibs was applied to a minor pullback after the price broke above the 0.62 key resistance. This goes to show, that there is over 50% growth potential from the current price, and the next upside wave could be starting any moment.
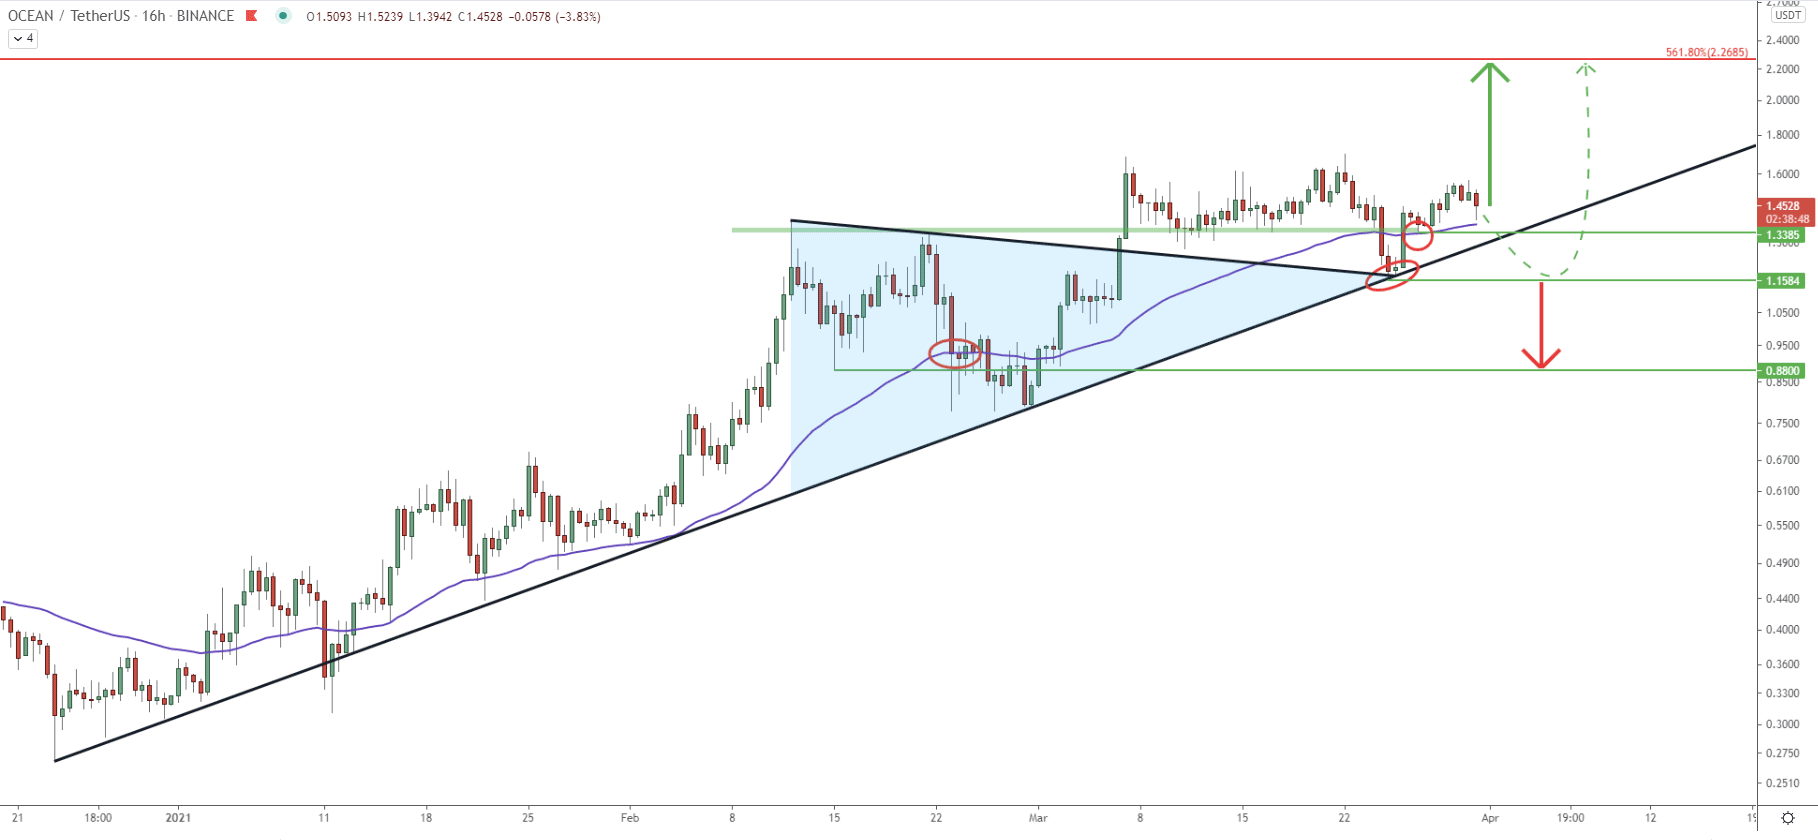
Based on the 16-hour logarithmic chart, OCEAN/USDT price continues to bounce off the simple uptrend trendline. Back in February, the support has been formed at 0.88, which was respected along with the 50 EMA. Then price broke above the previous high at 1.33 as well as the downtrend trendline, which was forming a triangle pattern. This is a strong bullish pattern, which yet again confirms strong bullish momentum.
Recent price action shows, that 1.33 support got rejected along with the 50 EMA. Maybe this is the beginning of wave 5, and the final upside move towards the 2.26 resistance. On the other hand, it is also possible that OCEAN will attempt to re-test the 1.15 support, before/if the price will continue to rise.
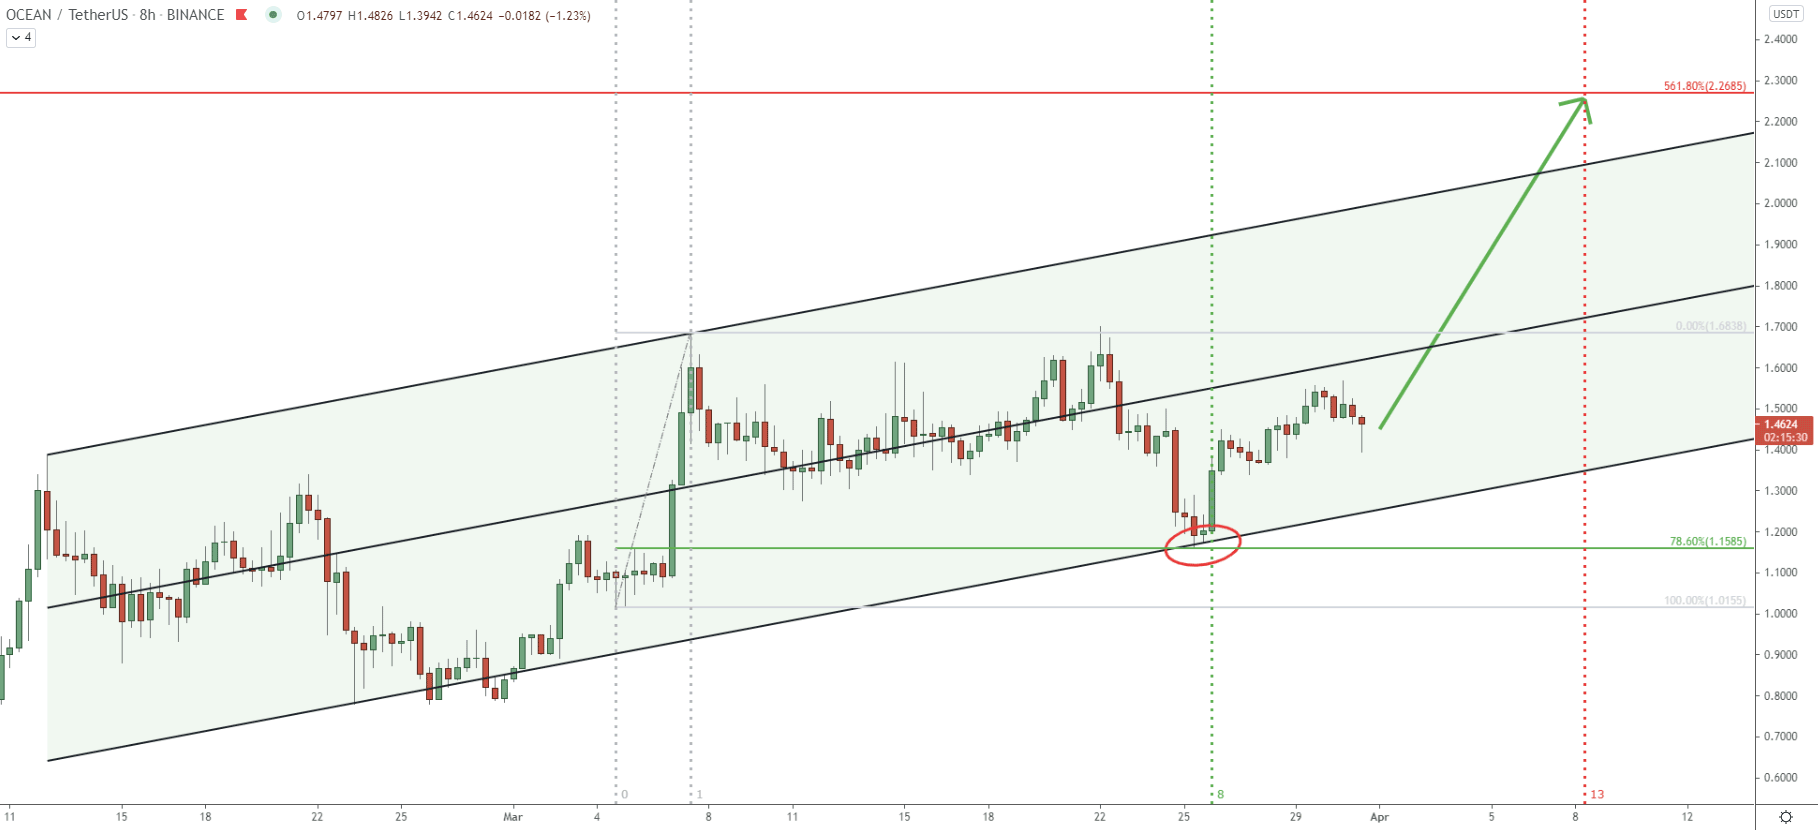
On this chart, the price is moving within the ascending channel, but what is most important, is the clean rejected of the bottom of the channel. Simultaneously, there was a precis bounce off the 78.6% Fibs, making the 1.15 level key support to watch. The Fibonacci retracement, as well as the Fibonacci cycle indicator, was applied to the last wave up, where the price produced a top at 1.68. The Fibonacci cycle indicator shows that cycle number 8 was the trigger point for the recent move to the upside, after the rejection of the cannel bottom. The next cycle is on April 8, which is only one week away. Perhaps this will be a fast 50% growth for the OCEAN, suggesting that the uptrend continuation could have started already.
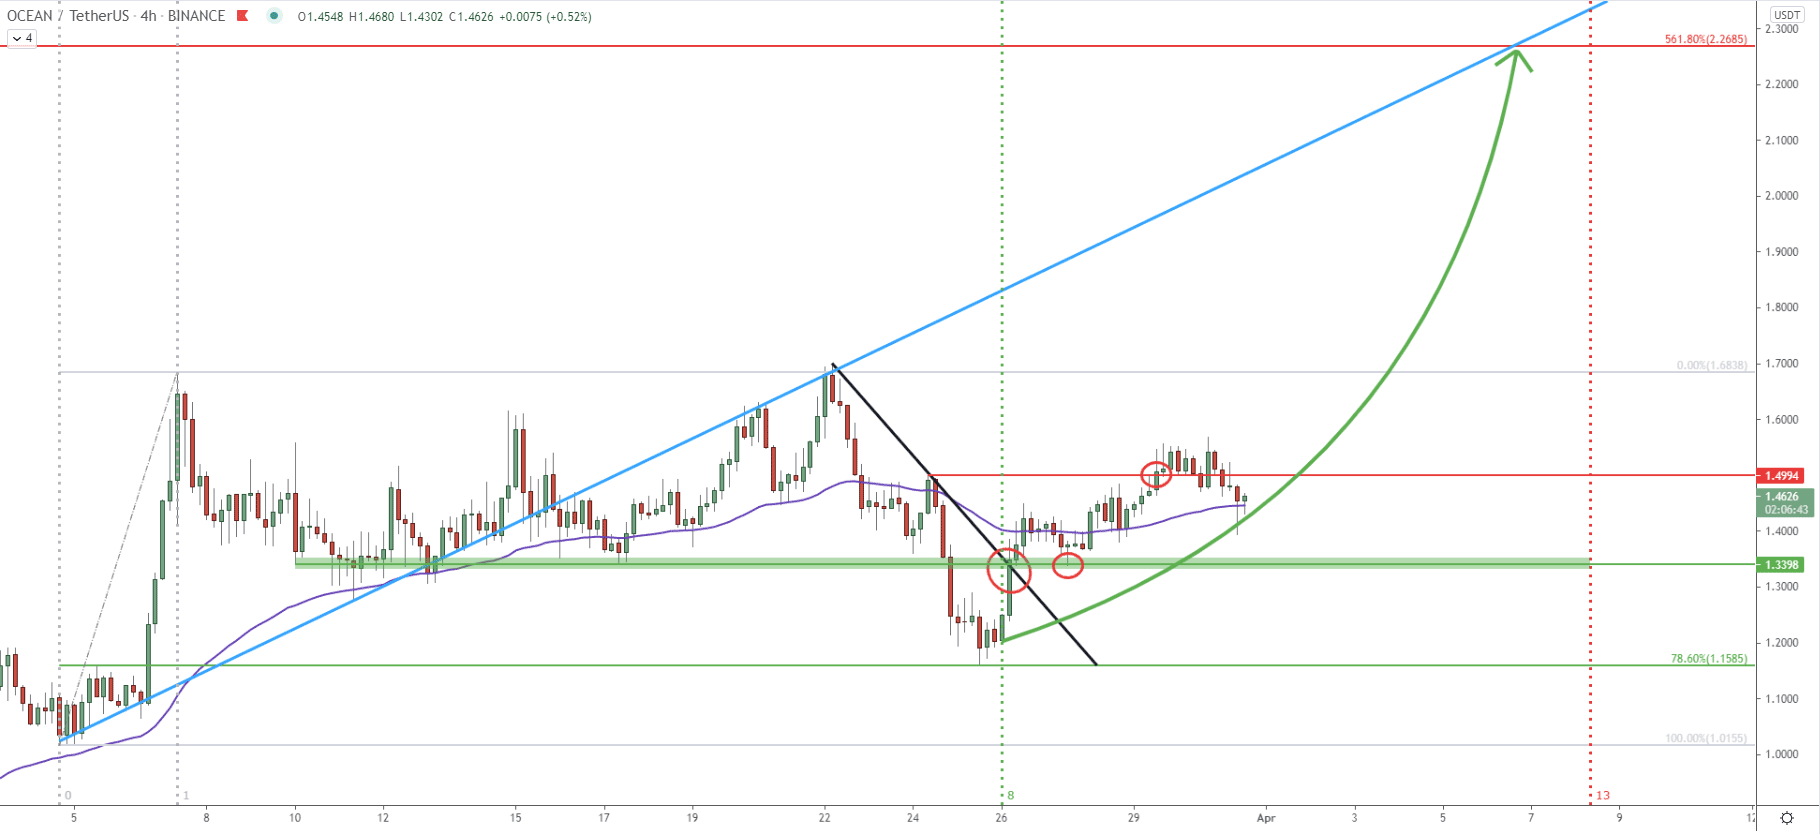
Another confirmation of an uptrend is the recent break above the simple downtrend trendline. After the breakout price pulled back and bounced off the 1.33 support level. The price growth continued resulting in the break above the 1.49 resistance. Right now, OCEAN/USD is trading near the 50 EMA, which might be a very attractive price area for buyers. Based on the crossing of the 561.8% Fibs with the average-price uptrend trendline and the next Fibonacci cycle, it would be reasonable to assume that the uptrend might be ending anywhere between 6-8 of April.
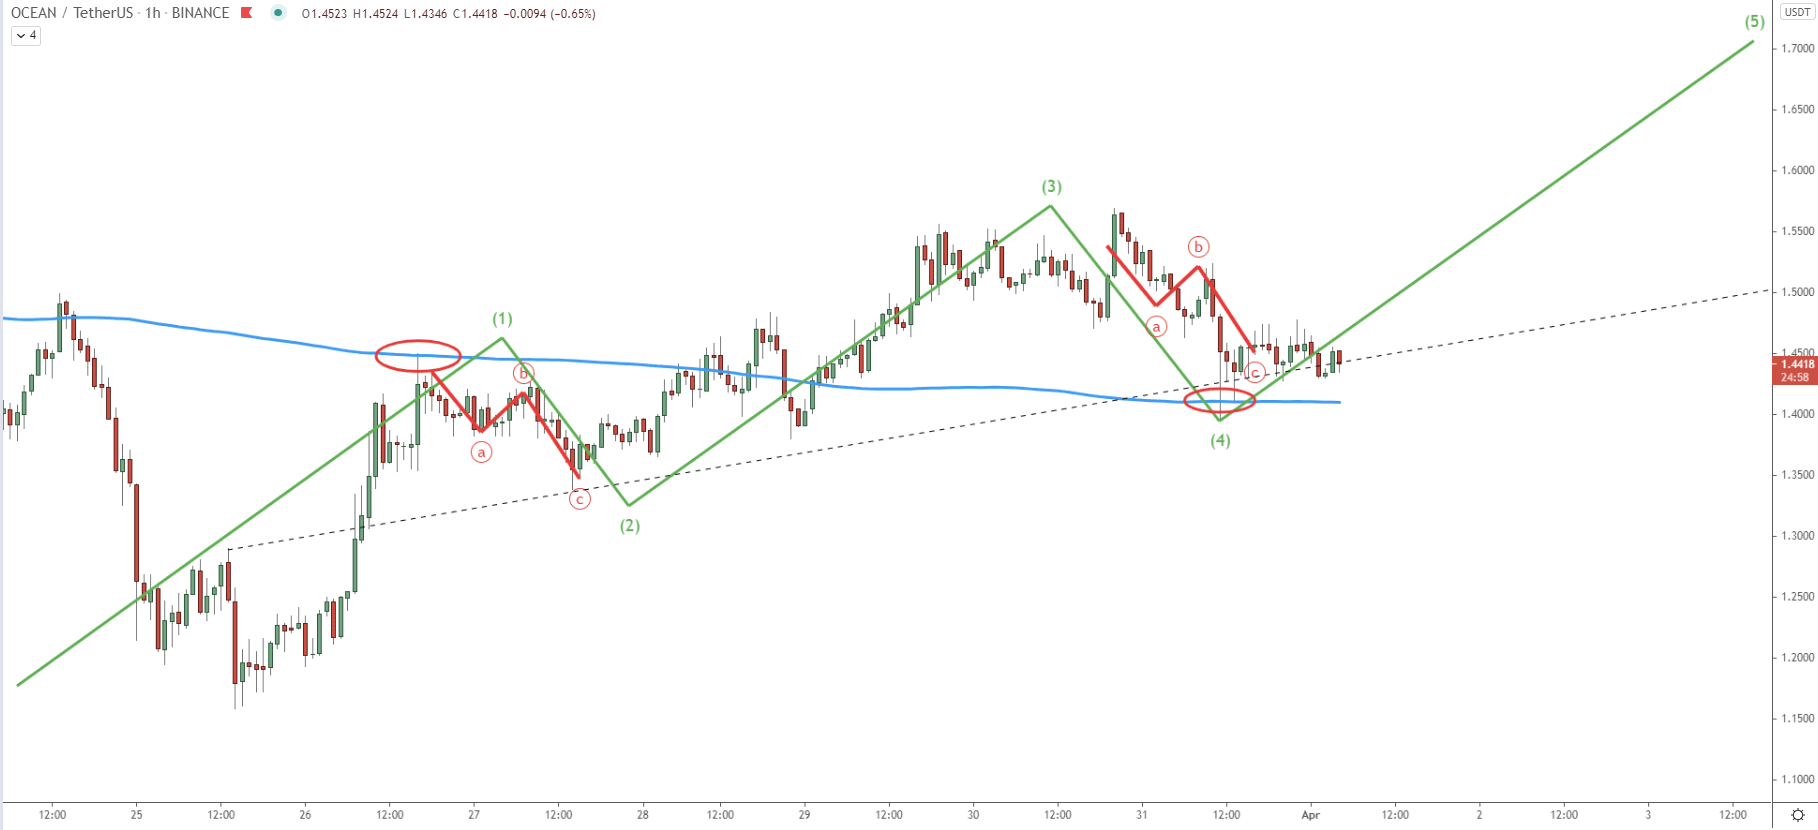
Similarly to the daily chart, on the hourly chart, the Elliot Wave theory was also applied. It also shows that right now, OCEAN could be completing a correctional ABC pattern as well as wave 4. This is because the average price uptrend trendline, along with the 200 Simple Moving Average acted as the support. And as long as the price remains above 1.33, a strong upside swing should be just around the corner.
OCEAN price is getting ready for the final move. This could be a 57% growth, which might be achieved within just one week from now.
As per the daily chart, the key resistance and the potential upside target is located at 1.26, which is confirmed by two Fibonacci retracement levels.
As per the 16-hour chart, only a break below the 1.15 support will invalidate this bullish forecast. In this scenario, OCEAN/USDT price is likely to drop towards the 0.88 support area.
Support: 1.33, 1.15, 0.88
Resistance: 1.70, 2.00, 2.26