
Published: March 2nd, 2022
Oasis Petroleum Inc. showed an amazing business performance from 2021 to the present, where the massive gain from oil price influenced this stock to have a solid financial position.
The current expectation of OAS is to provide a 14.6% revenue growth in 2022, where oil and gas exploration might work as a significant revenue generator. Moreover, the A+ Free Cash Flow grade with the 16% forward EPS may keep the business outlook stable with support from the rising oil price. In the latest quarterly earnings report, Oasis earned an EPS of $3.16, beating the expectation of $1.21. Moreover, the revenue came at $408.04 million against the analysts' expectation of $204.44. According to some prominent analysts, Oasis may generate $399 million in revenue before the effect of its hedges.
On the other hand, Oasis Petroleum has an A+ profitability and momentum grades with multiple outperformance in underlying metrics. Moreover, the price-performance and trading volume are also supportive for showing a long-term bullish vibe in the stock. The rising oil price is another bullish factor for OAS, while the current geopolitical uncertainty from Russia and Ukraine has no sign of ending.
Let’s see the upcoming price direction from the Oasis Stock (OAS) technical analysis:
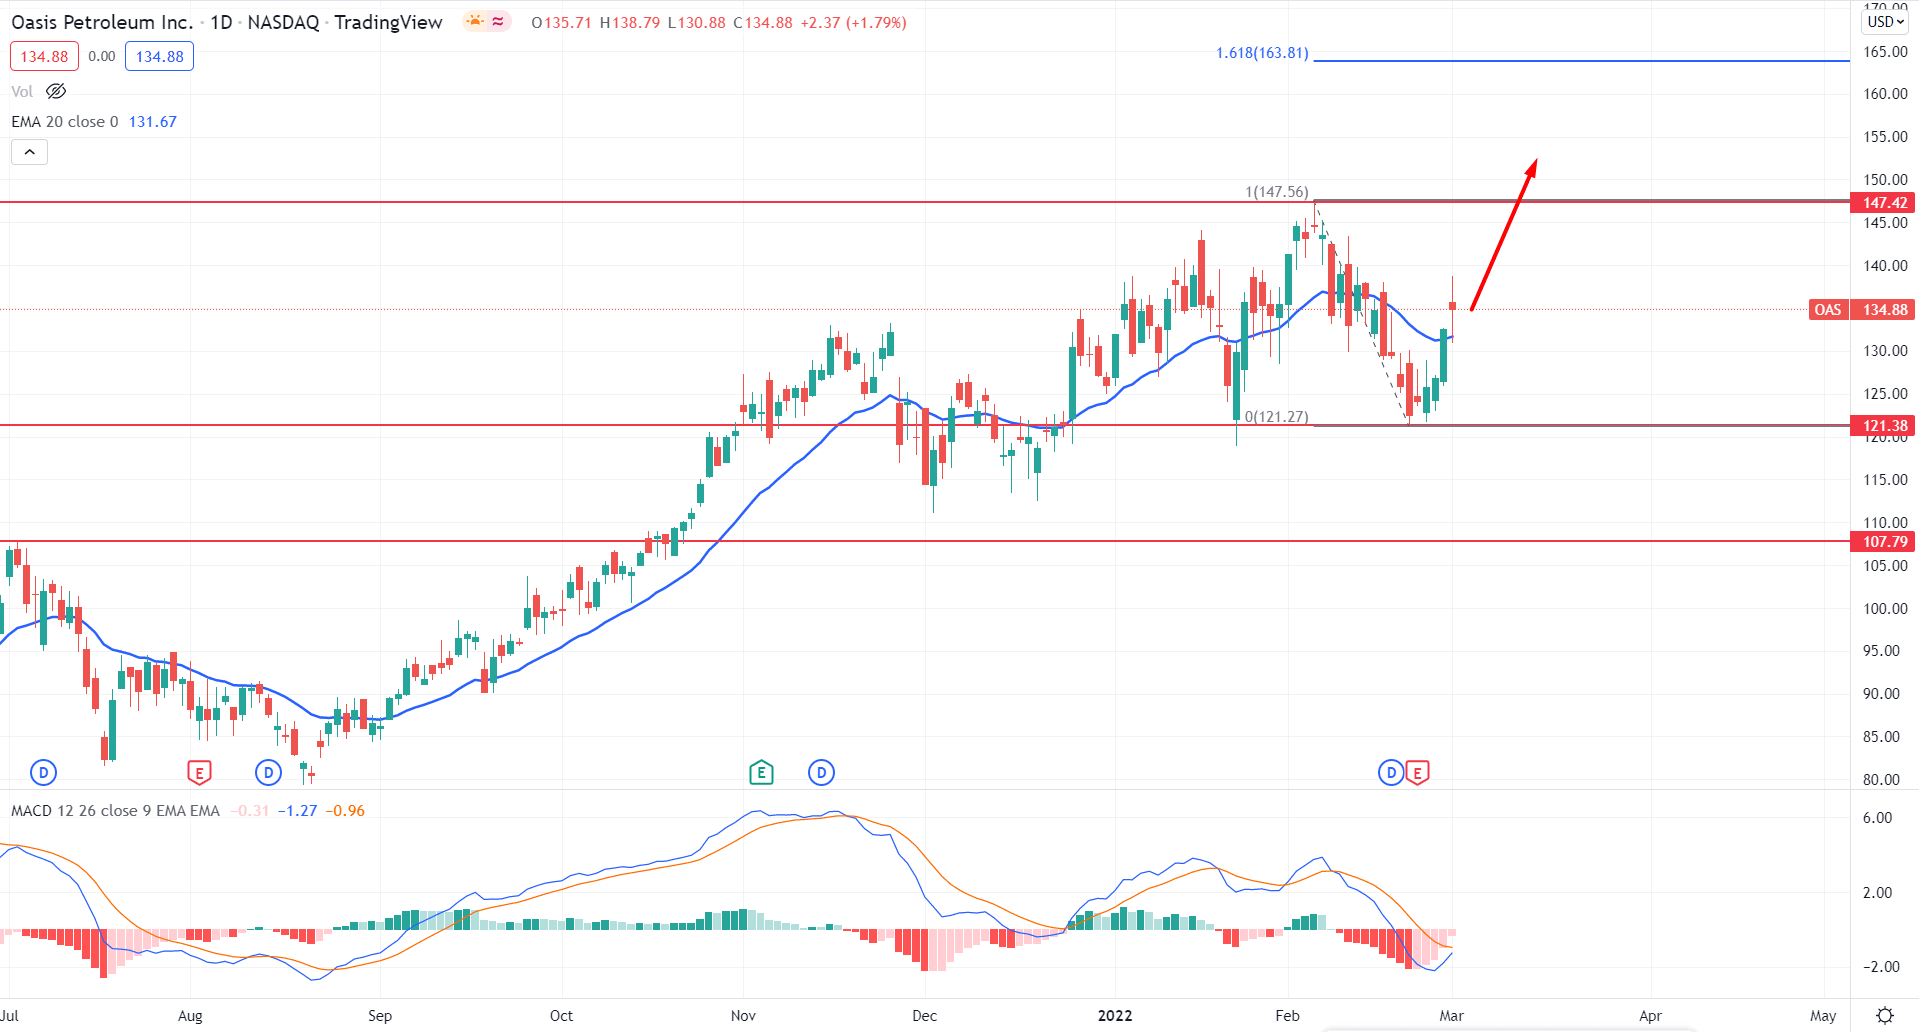
The major trend in the Oasis stock (OAS) daily chart is bullish, where the price made multiple higher highs. Although the price showed a bearish pressure from the 147.42 swing high, bears failed to breach the 121.38 support level. Moreover, bulls regained the momentum from the 121.28 support level and formed a bullish daily candle above the dynamic 20 EMA.
The above image shows how the MACD Histogram decreased its bearish momentum and squeezes to the neutral zone. Meanwhile, the dynamic 20 EMA is below the price while the broader market context is bullish.
In this scenario, investors should consider the upcoming price direction as bullish as long as bulls hold the price above the 121.38 support level. In that case, the primary bullish target is towards the 163.81 level, which is the 161.8% Fibonacci Extension from February high to low. The bullish opportunity needs close attention to dynamic levels where any bullish rejection increases buying possibility. On the other hand, a break below the 121.28 level with a bearish daily candle may alter the current market structure and lower the price towards the 107.79 level.
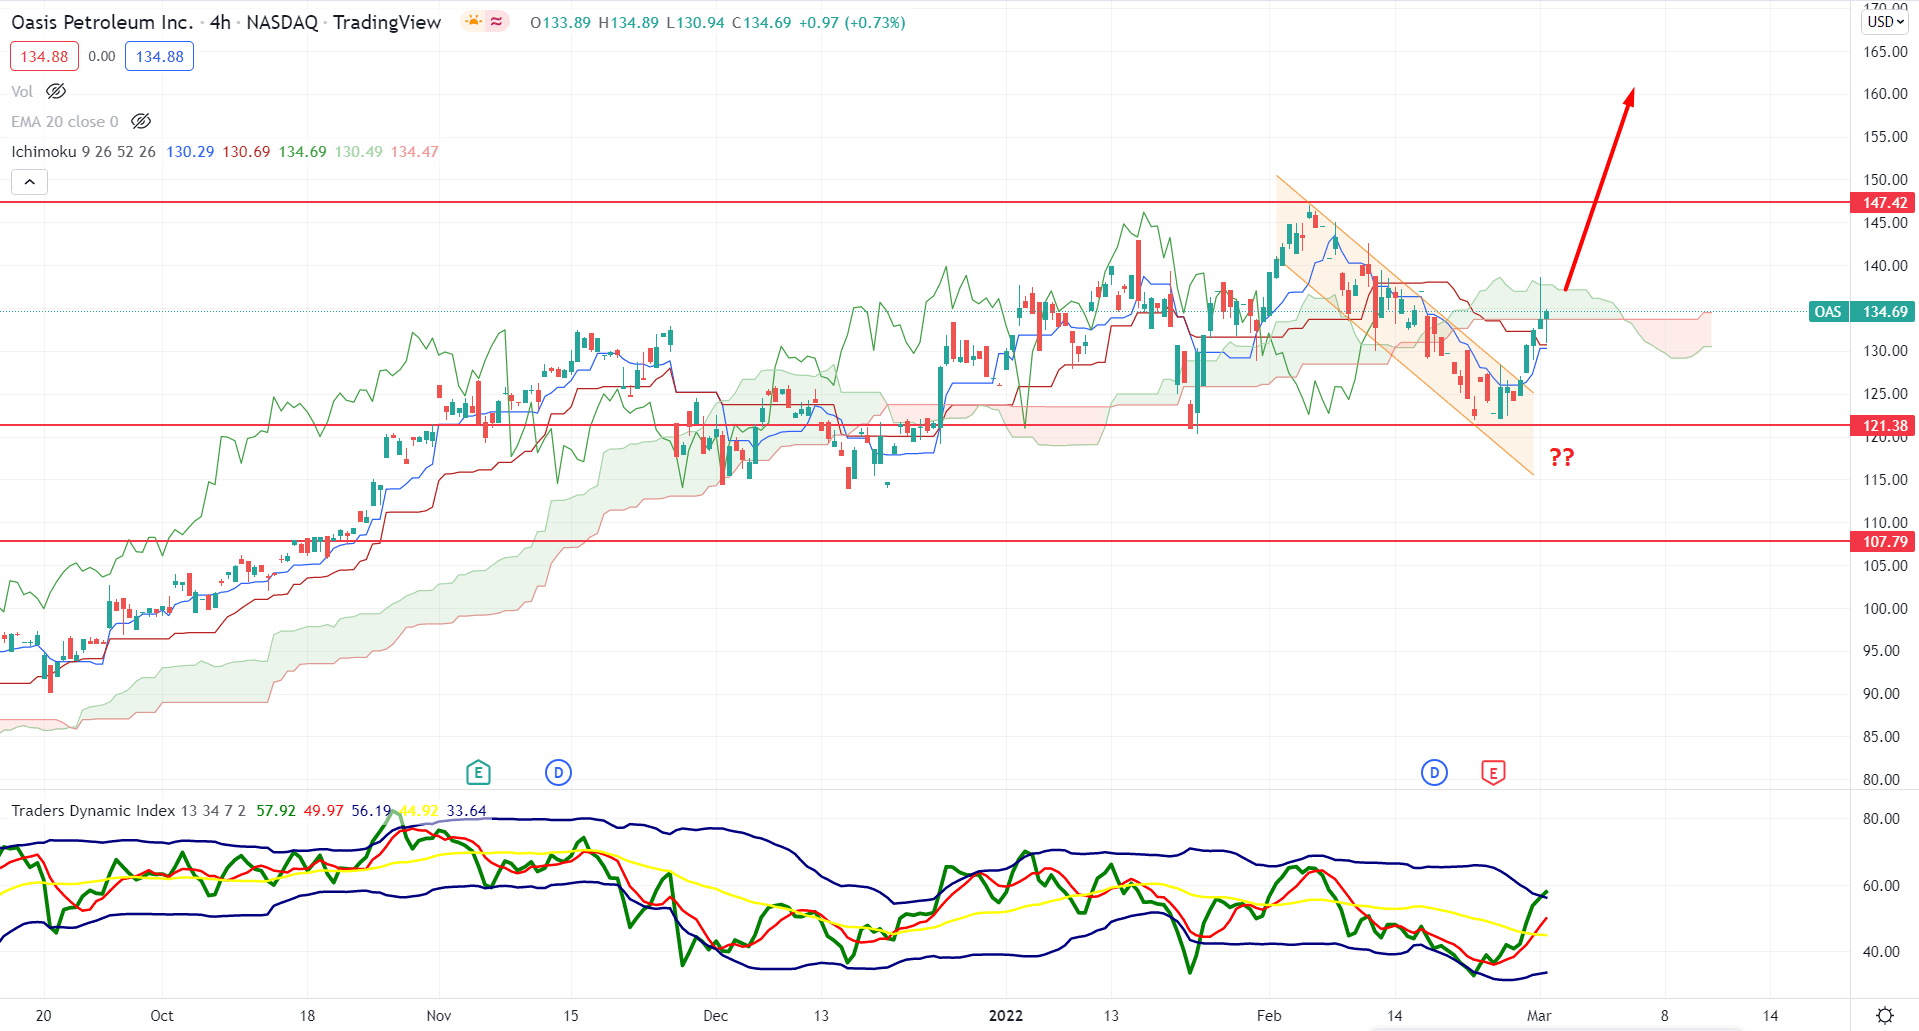
According to the Ichimoku Kinko Hyo, the broader market context is bullish as the recent price showed a bearish channel breakout from the 121.38 support level. Moreover, the bearish strength in the future cloud has limited the momentum while the long-term market trend is bullish.
The above image shows how the Traders Dynamic Index reached the higher limit, indicating an intense buying pressure in the price. Moreover, the price formed a bullish H4 candle above the dynamic Kijun Sen with a bullish crossover.
Based on the current market structure, a bullish H4 close above the Kimo Cloud would increase the buying pressure where the primary aim is to test the 160.00 psychological level. On the other hand, a sharp rebound might open another buying opportunity from 121.90 support, while the break below the 121.90 level would alter the current market sentiment from bullish to bearish.
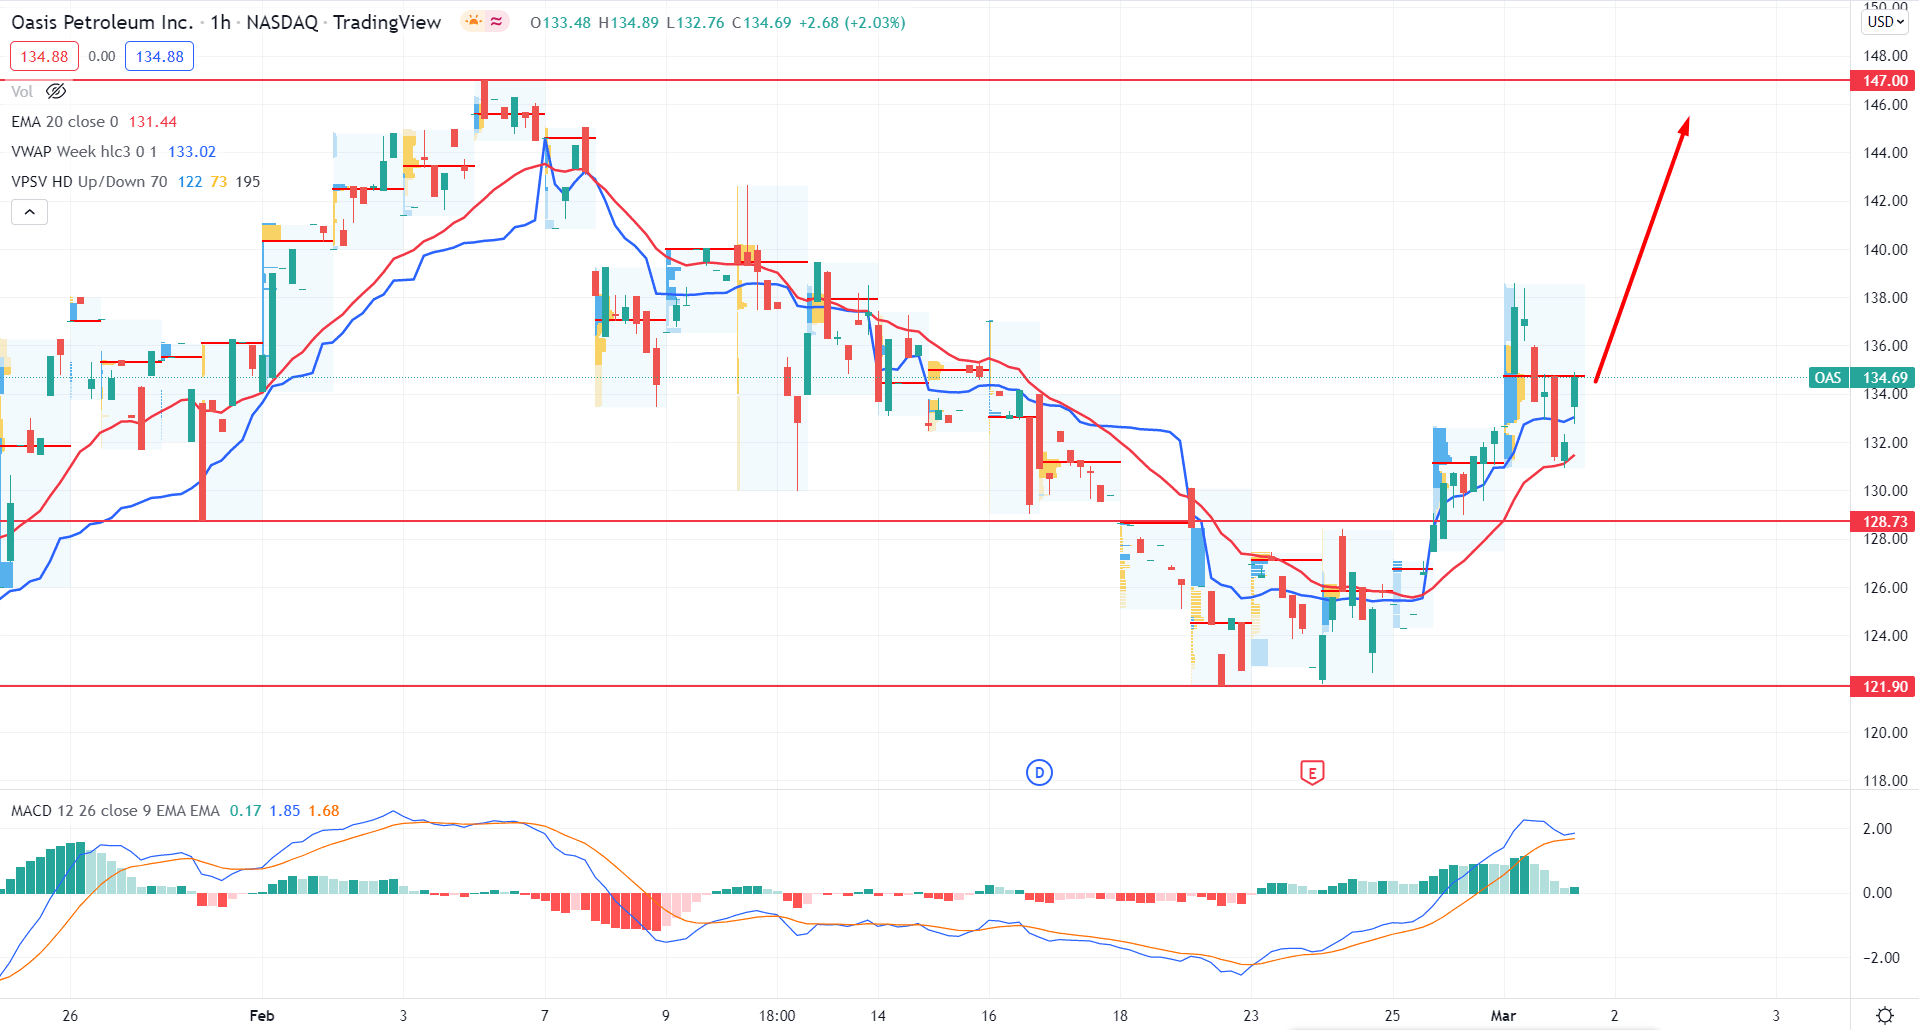
In the intraday chart, OAS is trading within a bullish trend as the price moved above the 128.73 intraday resistance with an H1 close. Moreover, dynamic 20 EMA And weekly VWAP are below the piece and drive upside.
The above image shows how the MACD Histogram continued its bullish momentum by remaining above the neutral line while the most recent high volume level is at 133.70 level. As the broader market direction is bullish, any bullish rejection from dynamic weekly VWAP would open a buying opportunity in this instrument where the primary is to test the 147.00 level.
As per the current market context, the overall outlook of OAS is bullish, based on technical and fundamental structure. In that case, any bullish opportunity from the H4 timeframe might provide more profits from the existing bullish trend.


