
Published: January 21st, 2025
The NZDUSD has reversed its recent rise from the prior session, trading close to 0.5650. The pair was volatile as market tremors were caused by US President Donald Trump's inaugural day.
Following rumours that Trump intends to order government agencies to look at tariff policy and reevaluate the US's trade relations with Canada, Mexico, and China, the US dollar (USD) strengthened.
But as pressure mounted on the Greenback, the NZDUSD recovered some ground. The TikTok agreement, Trump's seeming attempts to improve relations with the Chinese President, Xi Jinping, and indications of a more lenient tariff policy were the main causes of this.
After the president filed a presidential decree postponing the implementation of the TikTok ban by seventy-five days, he made a statement. Since China and New Zealand are close trading partners, any shifts in China's economy may impact New Zealand's marketplaces.
In the meantime, Business NZ's data showed a drop in the nation's Performance of Services Index (PSI), which put downward pressure on the New Zealand Dollar (NZD). After 10 months of contraction, the PSI fell from 49.5 during November to 47.9 in December.
With the yearly rate of inflation expected to fall to its lowest point since 2021, traders will be eagerly watching Wednesday's Consumer Price Index (CPI) report. According to the market's present value, the Reserve Bank of New Zealand (RBNZ) is expected to lower the cash rate from 4.25% to 3.75% the following month, with an 80% chance.
Let's see the future price direction of this pair from the NZDUSD technical analysis:
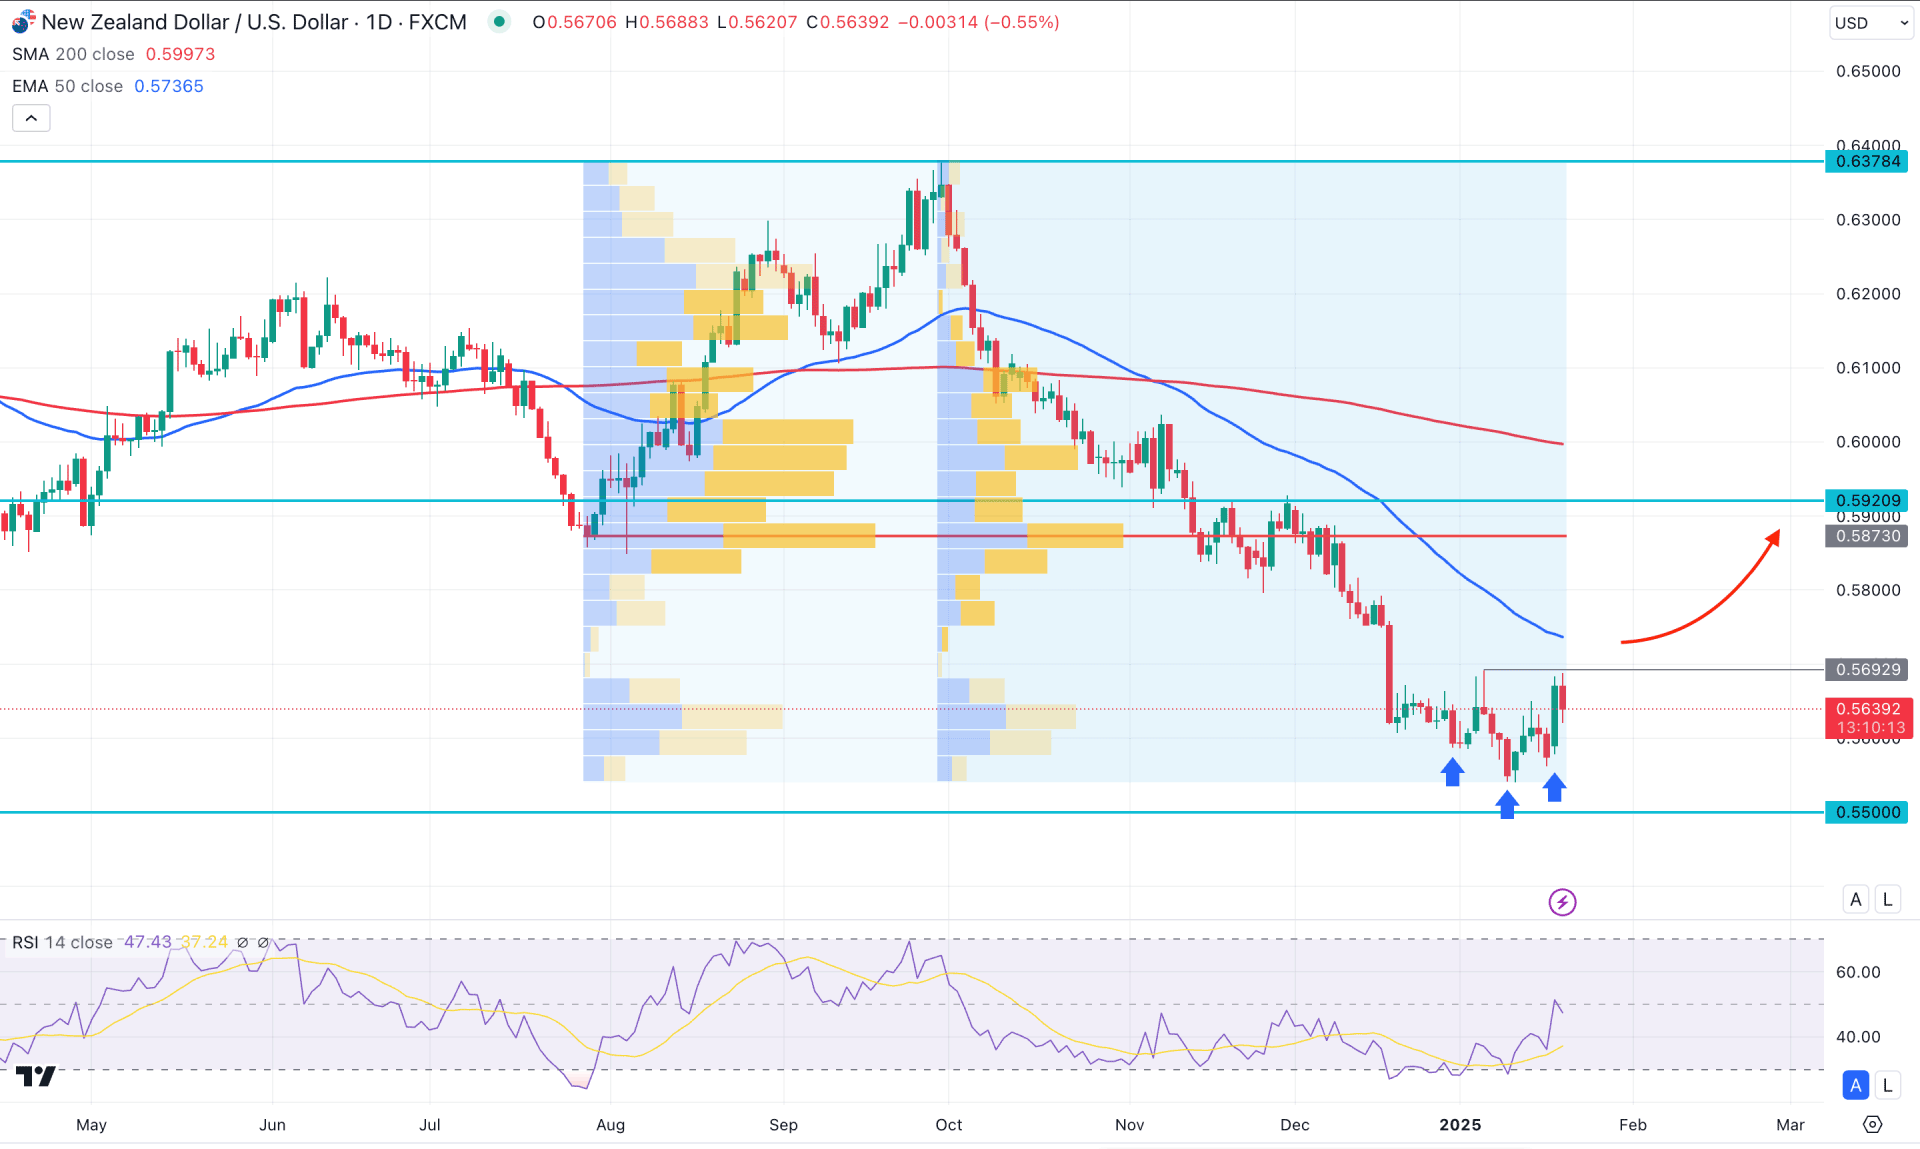
In the daily chart of NZDUSD, the ongoing selling pressure is visible, which was initiated from September 2024 high. However, there has been no sufficient bullish recovery since then, signalling no solid bottom. In this context, investors should monitor how the price trades in the current area, as valid counter-bullish pressure could signal a solid bottom. Until the bottom is formed, the ongoing selling pressure is likely to extend to the record low level.
In the volume structure, the active levels are above the current price, following the major trend. The most active levels from July 2024 and October 2024 are aligned in the same place, suggesting extreme selling pressure from the 0.5873 level.
In the main price chart, the sideways momentum is visible, whereas an emerging inverse Head and Shoulders pattern has yet to be validated from the neckline. Moreover, the major trend remains bearish as the 200-day SMA is above the high volume line with a downward slope.
On the other hand, the Relative Strength Index, which has rebounded from the oversold 30.00 zone, provides an early bullish signal.
Based on the daily market outlook for NZDUSD, the Inverse head-and-shoulders pattern has yet to be validated after overcoming the 0.5692 resistance level. A valid daily close above the 0.5692 to 0.5700 level could be a potential bullish opportunity, aiming for the 50-day EMA level before reaching the 0.6000 psychological line.
On the other hand, the ongoing bearish pressure is likely to extend where the near-term support is at the 0.5500 level. Overcoming this line could extend the loss and find support from the 0.5724 level.
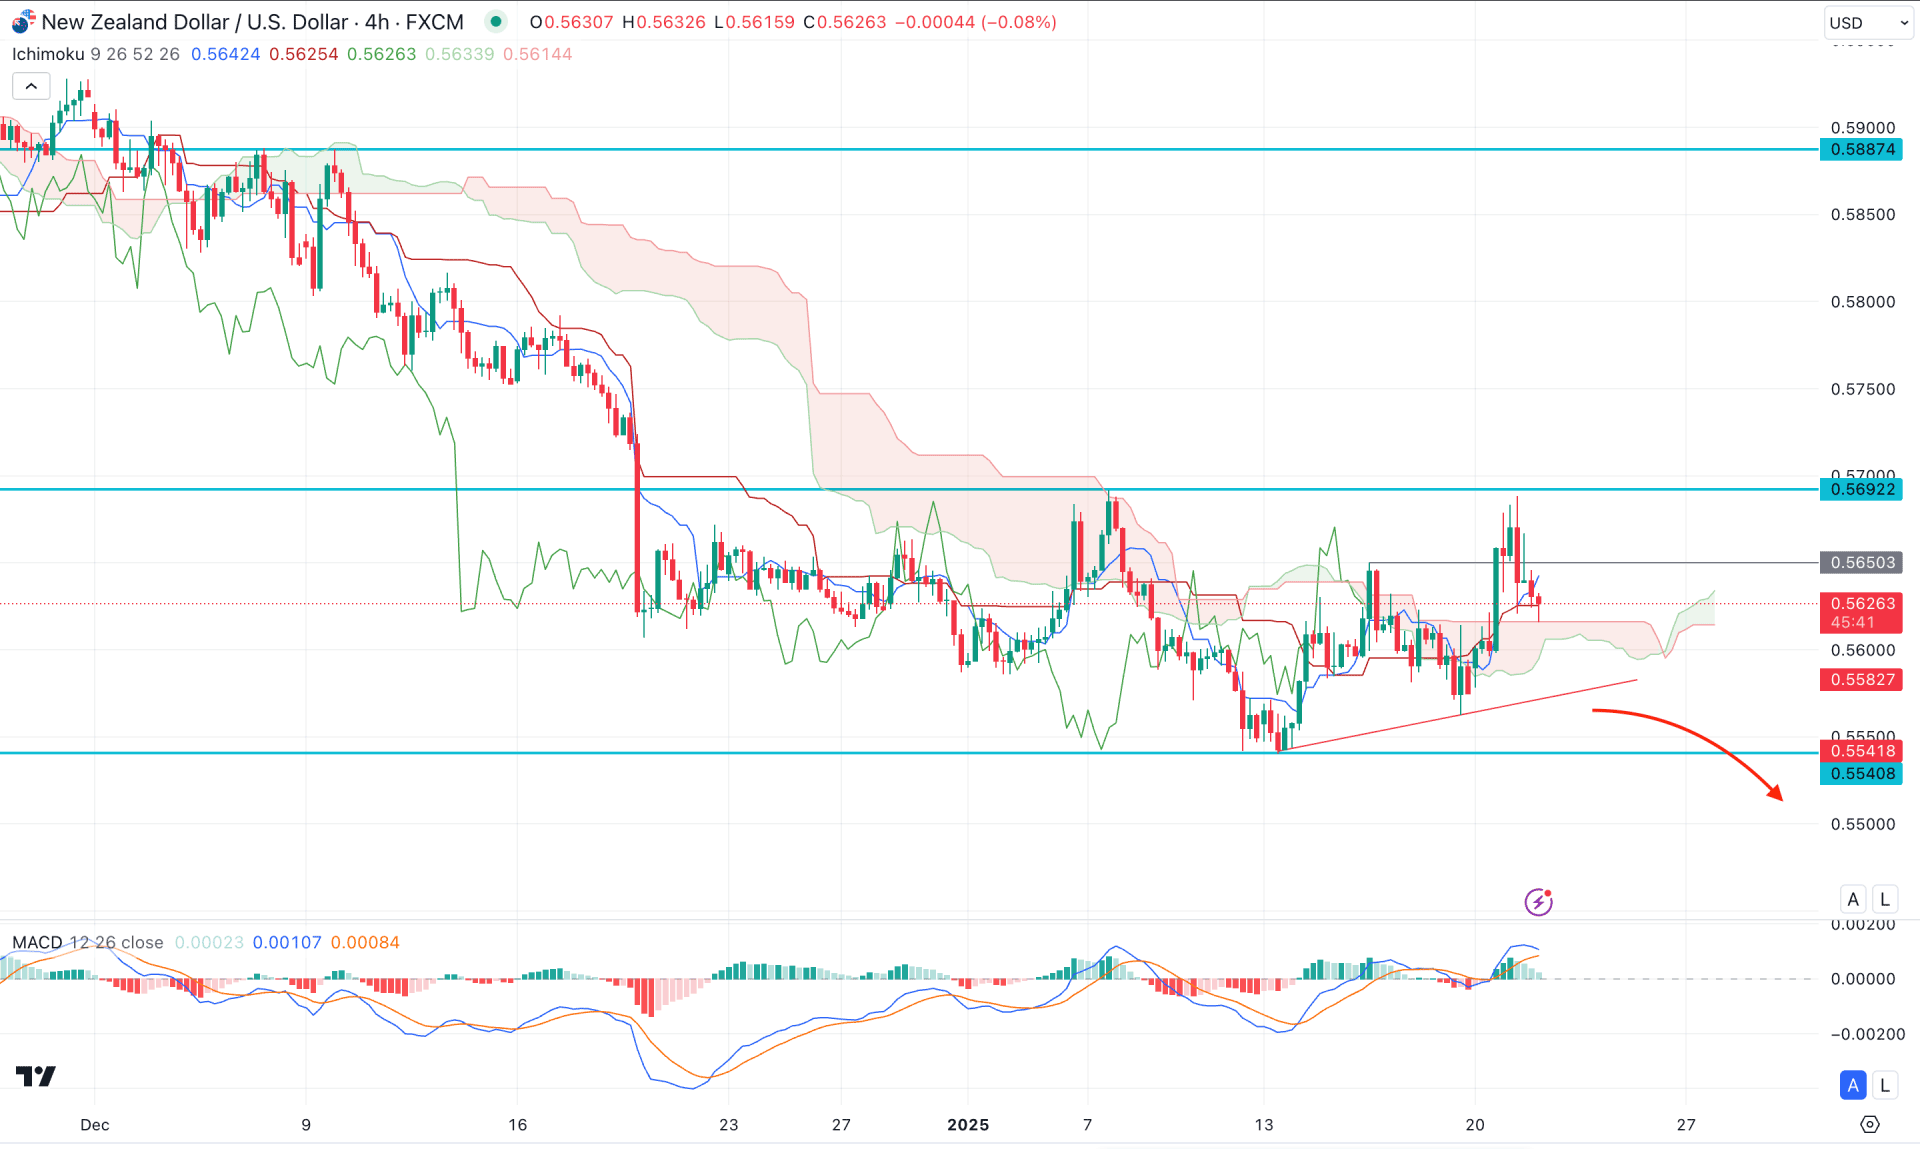
In the H4 timeframe, the drop-base drop formation is visible. The current price is hovering in a tight range after a strong bearish pressure. As the redistribution phase is active, the price is more likely to extend lower until a sell-side liquidity sweep appears.
In the Ichimoku Cloud zone, the future cloud has shifted its position from bearish to bullish, signalling an early long opportunity. However, the MACD Histogram lost its bullish momentum as it reached the neutral zone.
Based on the current H4 outlook, the bullish liquidity grab from the 0.5650 high with a bearish pressure from the 0.5690 area signals a bearish opportunity. However, a proper validation awaits a break below the trendline support before anticipating the 0.5500 level as a primary target.
On the bullish side, overcoming the 0.5692 high with a bullish H4 candle could be the first sign of a bullish range breakout. A proper break with a corrective price action could be a valid long opportunity, aiming for the 0.5800 level.
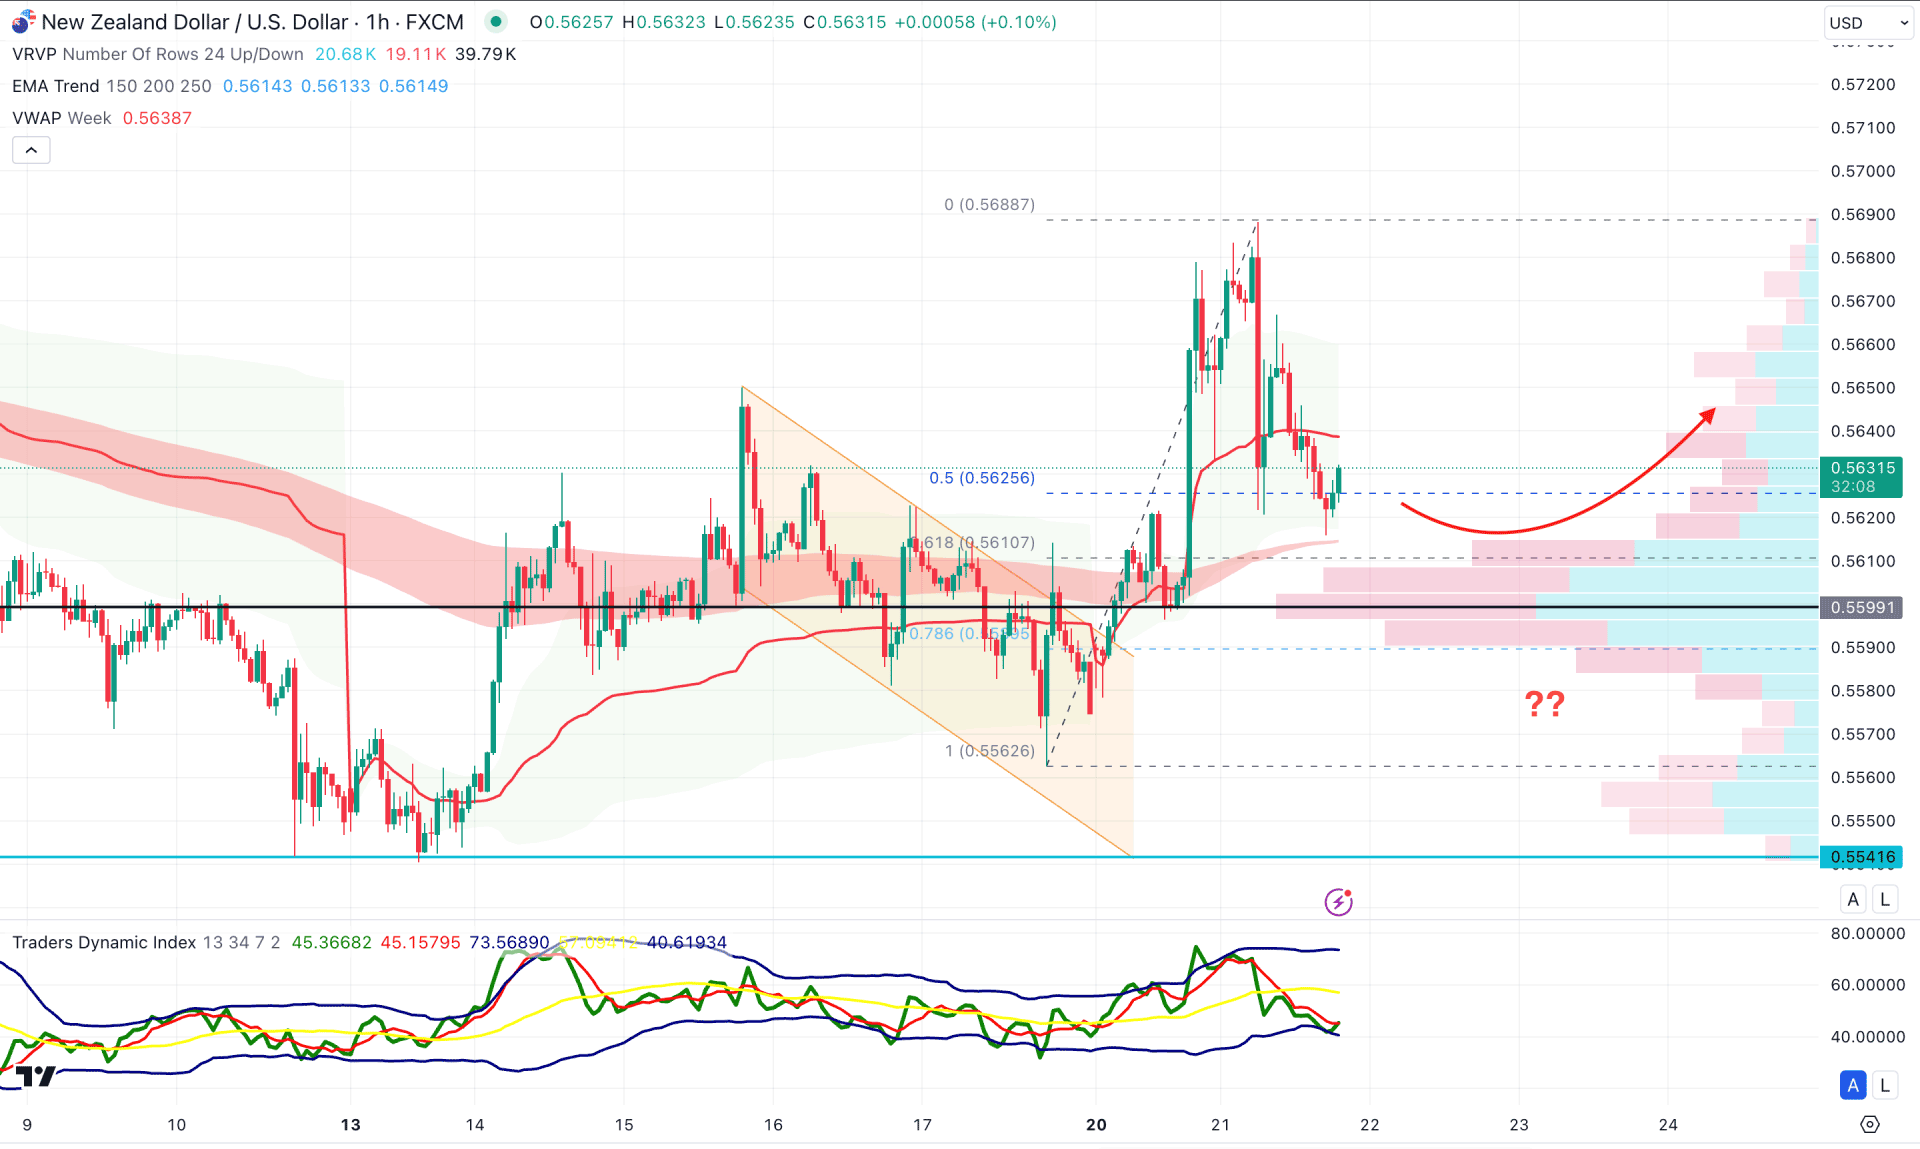
In the hourly time frame, the ongoing bullish pressure is potent as the price forms a descending channel breakout, creating a change of character (CHoCH).
Moreover, the price formed a daily high before lowering below the 50% Fibonacci Retracement level. As the current price is trading from the discounted zone after the existing bullish swing, a bullish attempt might appear after confirming the bottom within the discounted area.
In the secondary window, the Secondary indicator shows an overall price as the current traders' dynamic index line is at the lowest point in a week.
Based on this outlook, investors should closely monitor how the price reacts above the high volume line. A potential bullish recovery with an hourly candle above the VWAP level would validate the long opportunity targeting the 0.5700 psychological line.
On the other hand, any immediate selling below the 0.5570 level might invalidate the recent bullish pressure and open a short opportunity, aiming for the 0.5500 psychological line.
Based on the current market outlook, the NZDUSD price is more likely to continue selling pressure until a bottom is validated from the inverse head-and-shoulders breakout. Although the major trend is bearish, a potential bullish recovery from valid price action could attract bulls to join from a deeply discounted price.


