
Published: September 23rd, 2021
In this week’s FOMC, the Federal Reserve provided another hawkish outlook for the US economy where analysts expect it as a bullish price driver for the US Dollar. The Federal Funds rate remained unchanged at 0-0.25% with a split of the monthly QE assets purchases of $120 bn to $80 bn on Treasury Securities and another $40 bn on agency MBS. Moreover, the US Dollar and the US short rates have lifted from the Fed’s expectation of a rate hike as soon as next year. The hawkish expectation became supportive for the US Dollar signaling that the moderation on the pace of the asset purchase program may become warranted. The reference indicated a taper announcement in the November FOMC meeting, and until now, there has been no negative shock in the interim period.
On the other hand, the global factor and the unwinding pricing for a 50bp RBNZ rate hike are potential Kiwi to see a slippage against the US Dollar.
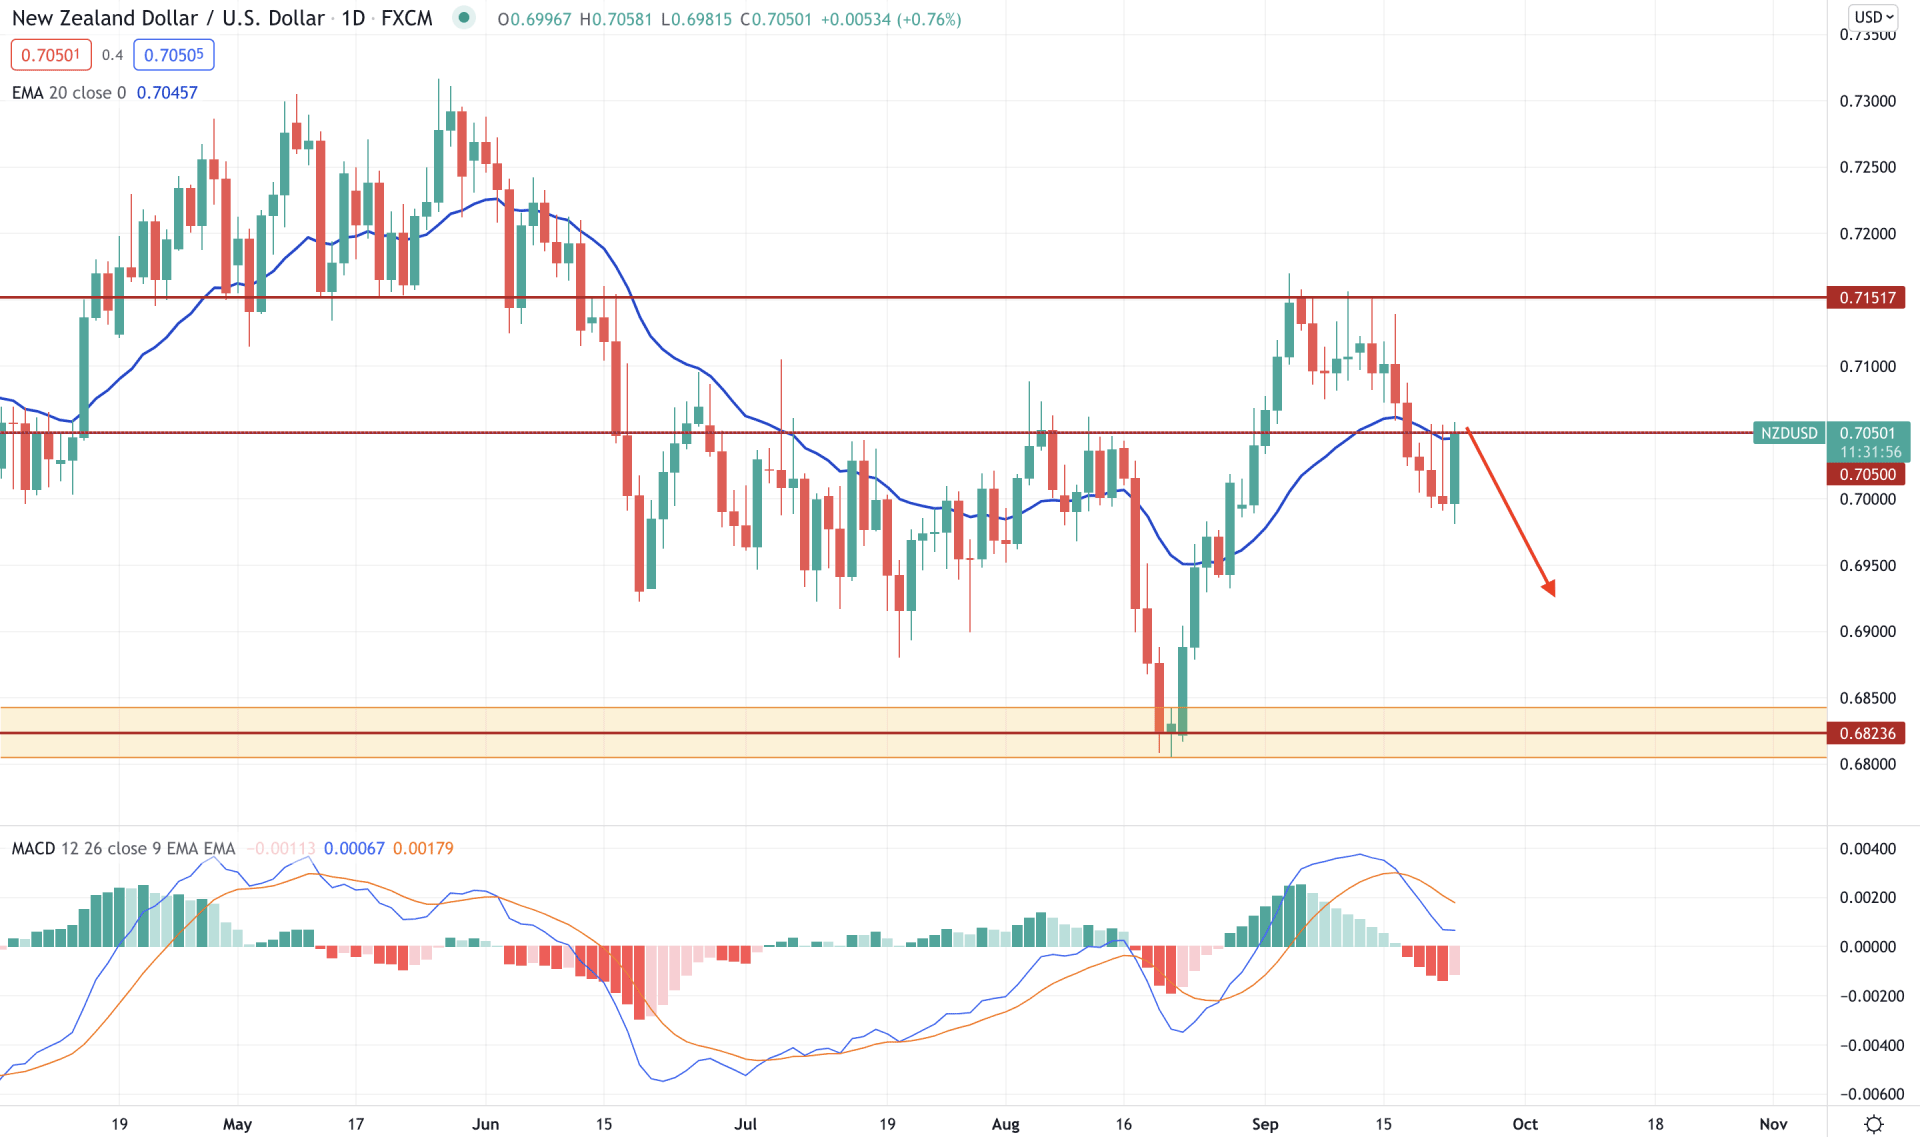
NZD/USD bulls started to take the price higher from the fresh demand zone at 0.6823, which was topped at the 0.7151 level. The multiple bearish rejections from the 0.7151 level signified bears present in the chart, making a new swing low below the 0.7050 event level. Therefore, as long as the price is trading below the 0.7050 level, it is more likely to extend the bearish pressure towards the 0.6850 level.
The above image shows how the price rejected the 0.7050 level with multiple long wicked candles while the dynamic 20 EMA works as minor resistance. Therefore, bulls should find a daily close above the dynamic 20 EMA to consider the bearish invalid. However, a rejection from the 0.7050 level with a bearish daily close has a higher possibility of taking the price lower towards the 0.6823 demand zone.
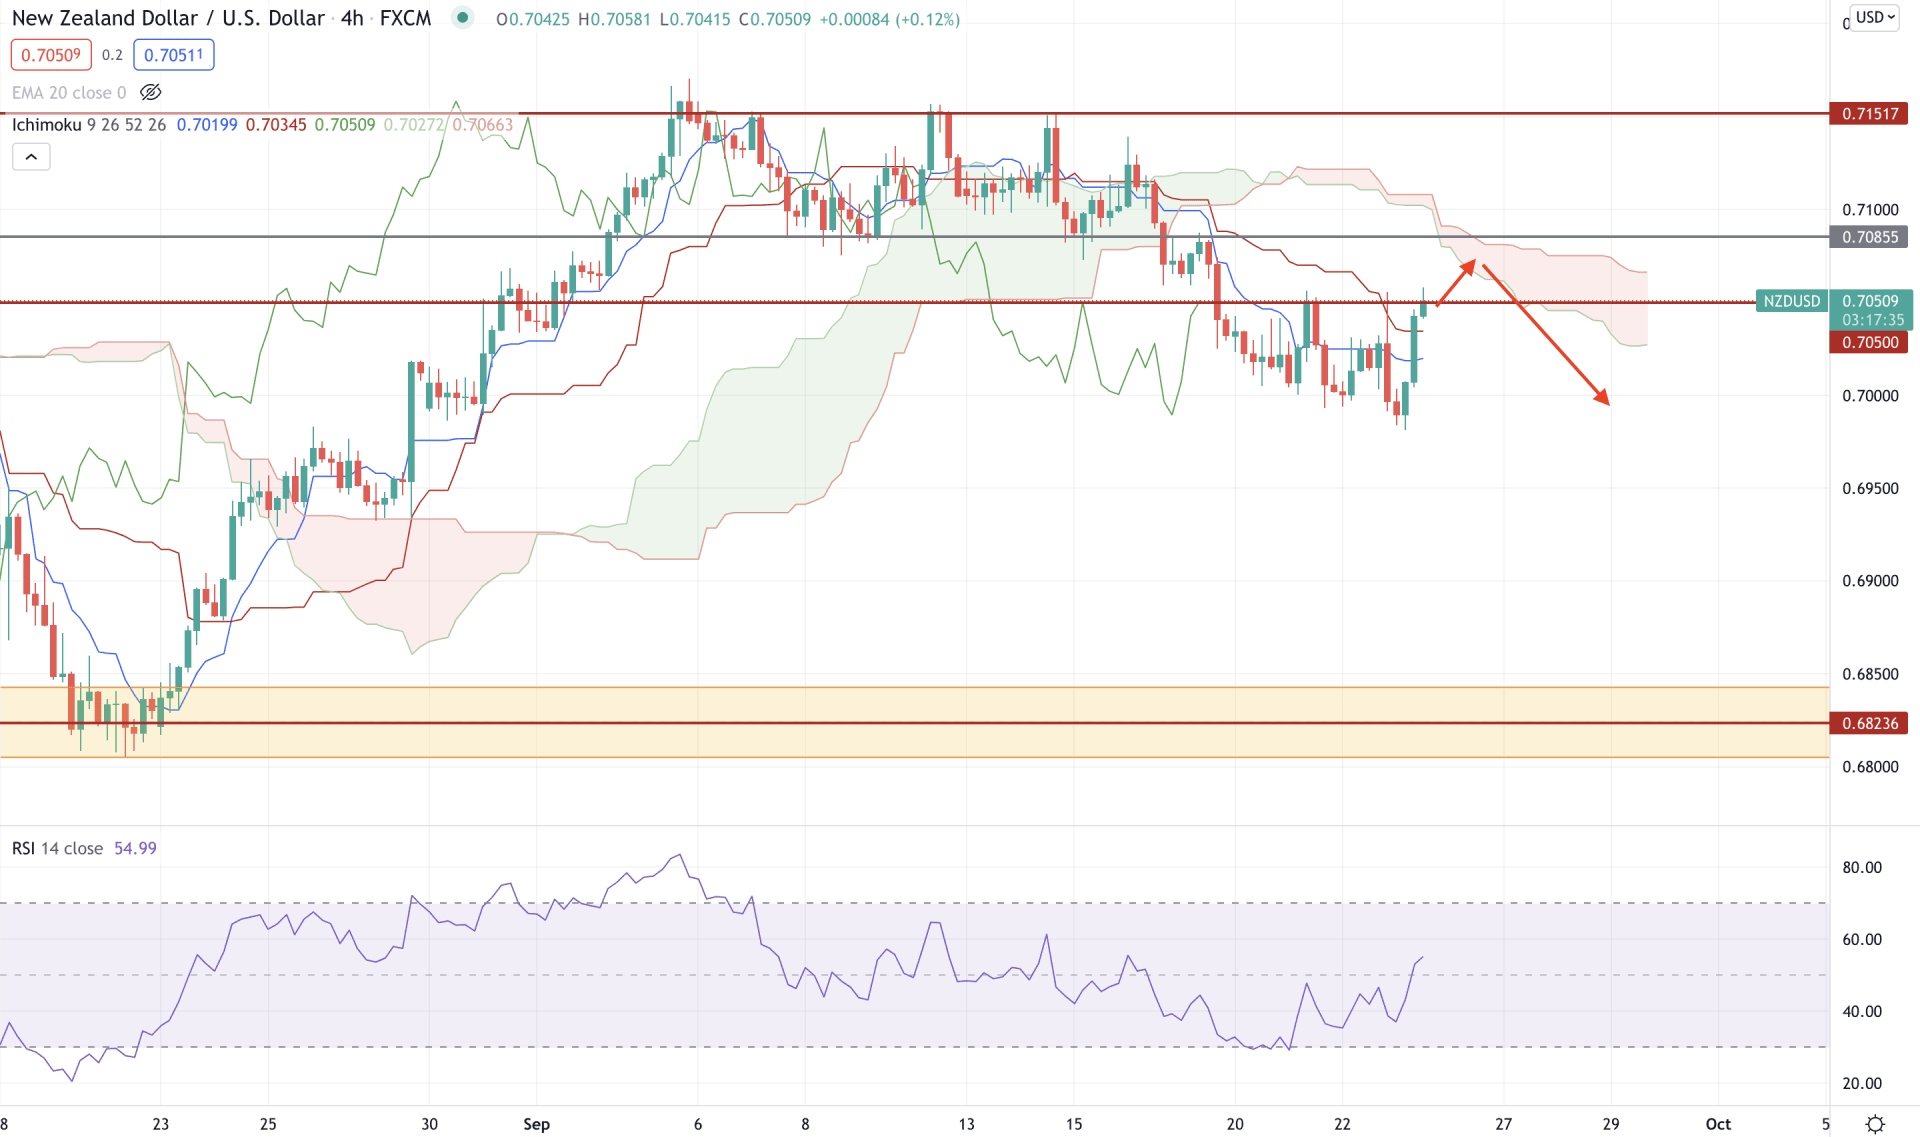
As per the Ichimoku Cloud, the NZD/USD H4 price became bearish after moving below the Kumo Cloud after multiple failures of breaking above the 0.7151 resistance level. Moreover, the Future Cloud is bullish where Senkou Span A is below Senkou Span B and aiming lower.
However, the most recent price moved above the dynamic Tenkan Sen and Kijun Sen with a bullish H4 close, which is an alarming sign for bears. In that case, investors should wait for a rebound and bearish H4 close to relying on the upcoming bearish possibility. On the other hand, a break above the 0.7085 intraday event level may initiate a buy trend towards the 0.7151 area.
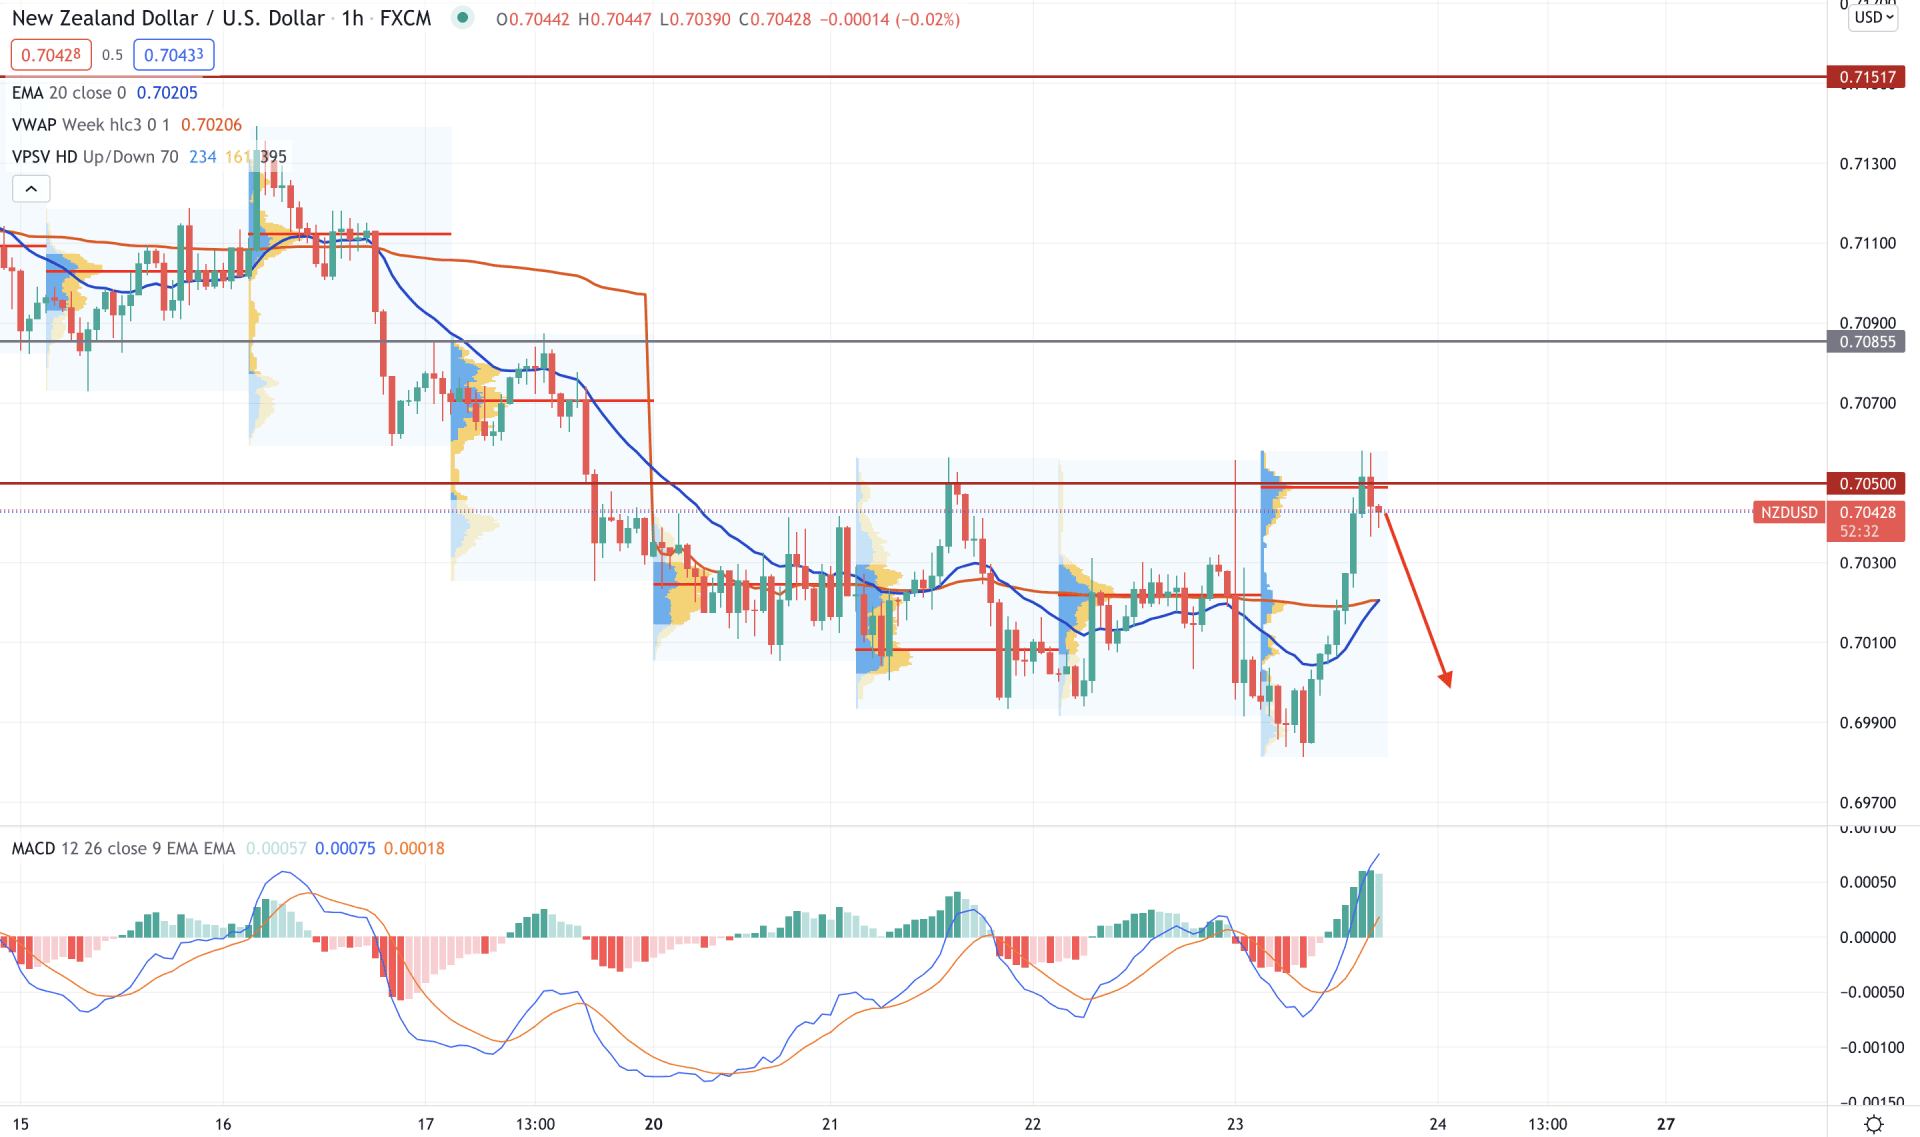
In the intraday chart, NZD/USD is volatile as the price moved above the dynamic 20 EMA and vwap but failed to hold the momentum above the 0.7050 level. Moreover, the price formed an intraday high volume level at 0.7050 level, pointing out that bears became active from that level.
In the above image, we can see how the price is trading above the dynamic 20 EMA. Moreover, the MACD Histogram remained bullish but failed to make a new low. In that case, bears should wait for the price to come below the dynamic 20 EMA with a bearish H1 close. In that case, the price may come lower towards the 0.6934 support level in the coming hours.
On the other hand, the London session pushed the price up to where the overall market context remains towards the US dollar. The price is still below the FOMC high, where a break above the 0.7050 level with a bullish H1 close may increase the price volatility. However, a bullish possibility is once the daily candle moves above the 0.7050 level.
As of the above discussion, we can say that the NZD/USD has a possibility of coming down if the intraday H1 candle comes below the dynamic vwap with a bearish close. In that case, the price may move lower towards the demand zone at 0.6823 area. On the other hand, a stable bullish D1 close above the 0.7050 level may take the price higher towards the 0.7151 resistance area.


