
Published: January 24th, 2023
In December, the US retail sales came in below expectations with a decrease of 1.1% month-over-month. The control group, which is used in GDP calculations, also saw a decline of 0.7% month-over-month.
Furthermore, industrial production data for December also showed a decrease of 0.7% month-over-month, following a revised November decrease of -0.6% month-over-month. These negative reports on consumption and production have raised concerns that the US may be entering a recession, leading to a rise in the value of the US dollar and a decline in the stock market.
In New Zealand, the NZIER Quarterly Survey of Business Opinion revealed that business confidence in the fourth quarter deteriorated to -70%, compared to -42% in the third quarter. A net 73% of businesses also predicted a deterioration in general economic conditions in the coming months, making this the weakest reading in the survey's history.
The report indicates that companies are becoming more cautious, looking to reduce staff numbers and scale back on investment plans. Furthermore, the second GDT auction of the year showed prices continuing to decline, albeit by a negligible -0.1%.
The daily NZDUSD price has become choppy at the resistance but there is no sign of bearish pressure.
Let’s see the future price direction from the NZDUSD technical analysis:
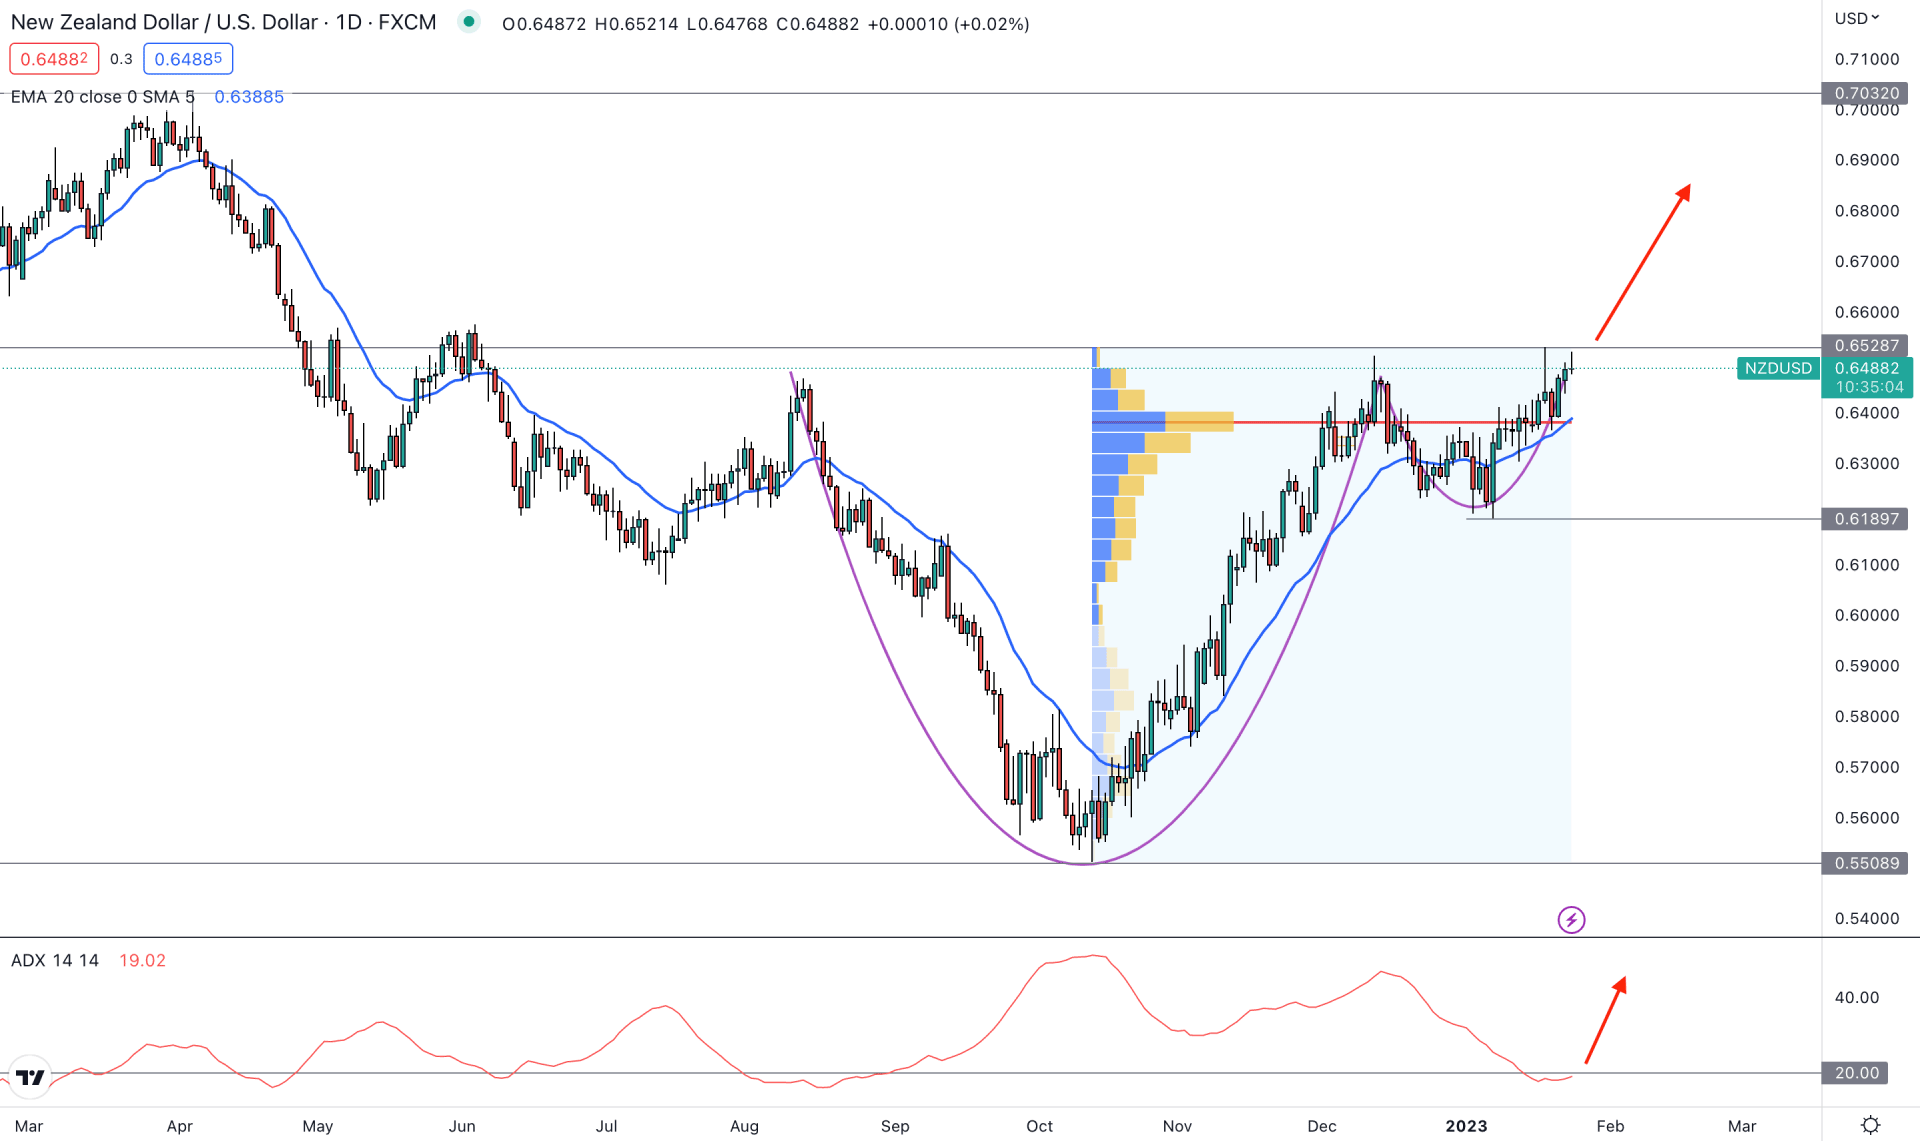
In the daily price of NZDUSD, strong buying pressure is seen from the October 2022 low from where the price provided an 18.15% gain. The massive bullish recovery with a counter-impulsive momentum is a primary sign that bulls have gone into the market and can take the price higher at any time.
After reaching the peak in December 2022, bears tried to take control but failed. This scenario is represented by a bullish Cup & Handle pattern, which is a strong bullish reversal signal. In that case, a strong buying pressure above the 0.6528 level could increase the price toward the 0.7000 area.
It is true that a price pattern is not enough to anticipate the future price direction of a trading instrument. Institutional investors are the key price driver and their involvement needs to be monitored. As per the high volume indicator from October to January, the highest trading volume level is spotted at 0.6380 levels, which is below the current price. Moreover, the dynamic 20 Exponential Moving Average is working as confluence support at the high volume level.
In the indicator window, The ADX level is still below the 20.0 area. It is a sign that the pressure of the current trend is not strong enough to make an impulsive momentum. However, bullish pressure in the ADX level above the 22.00 area might indicate a strong trend trading opportunity.
Based on the daily price structure of NZDUSD, buyers have a higher possibility of taking the price to 0.7000 key psychological level. In that case, a strong daily candle above the 0.6528 area could offer a long opportunity.
On the other hand, a bearish recovery with the daily candle below the 0.6508 high volume level could limit the buying pressure and lower the price in the coming days.
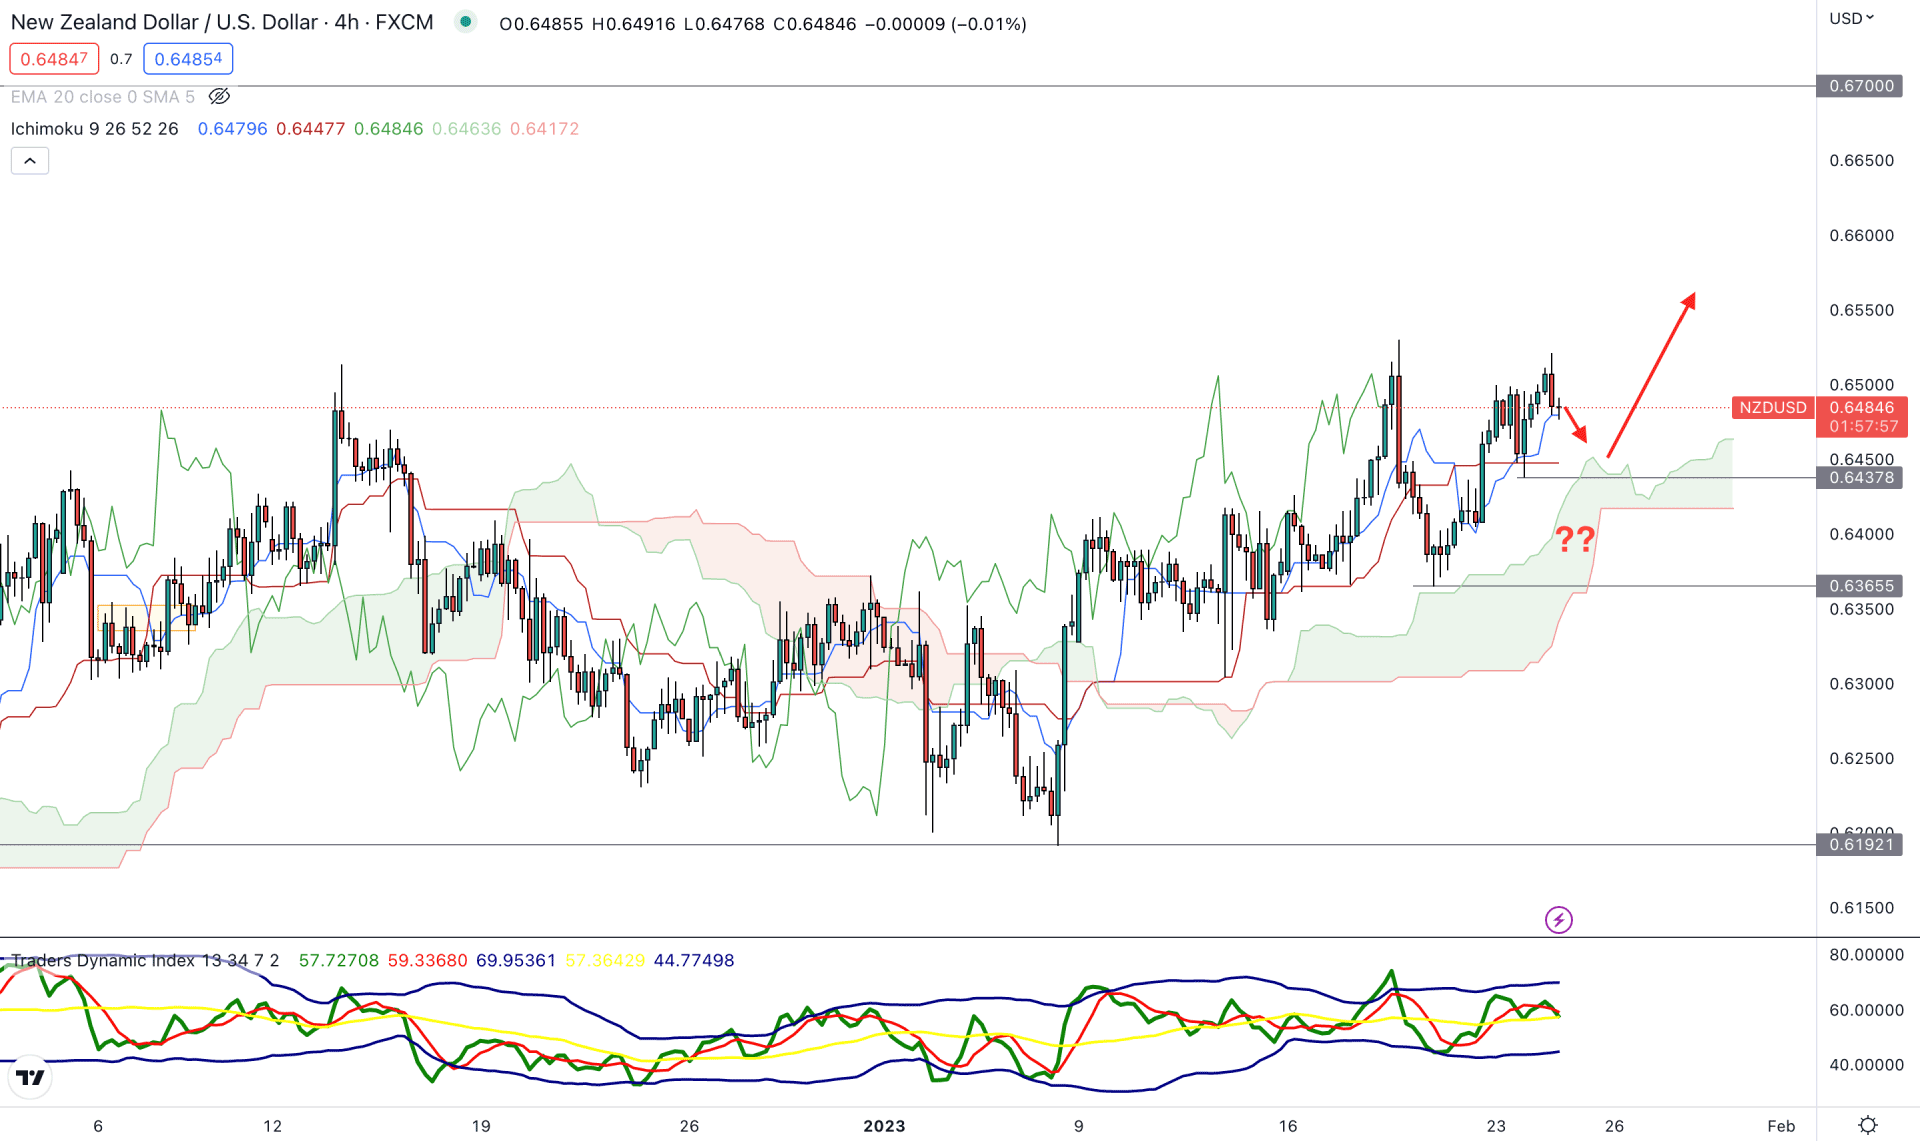
In the H4 chart, the buying pressure is still strong in the NZDUSD as the current price is trading above the dynamic Kumo Cloud support.
In the future cloud, the Senkou Span B is flat, which is a sign of a neutral momentum from medium-term traders. However, the Senkou Span A is above B and aiming higher. It is a sign of active pressure from short-term bulls. The indicator window shows a neutral opinion, where the current TDI level is above the 50% area.
Based on the H4 outlook, a minor bearish correction and buying pressure from the 0.6470 to 0.6435 area could offer a long opportunity in this pair. In that case, a bullish pressure H4 close above the Tenkan Sen level would be the conservative buying approach, towards the 0.6700 area.
On the bearish side, a stable break with an H4 candle below the 0.6470 level could lower the price toward the 0.6192 area.
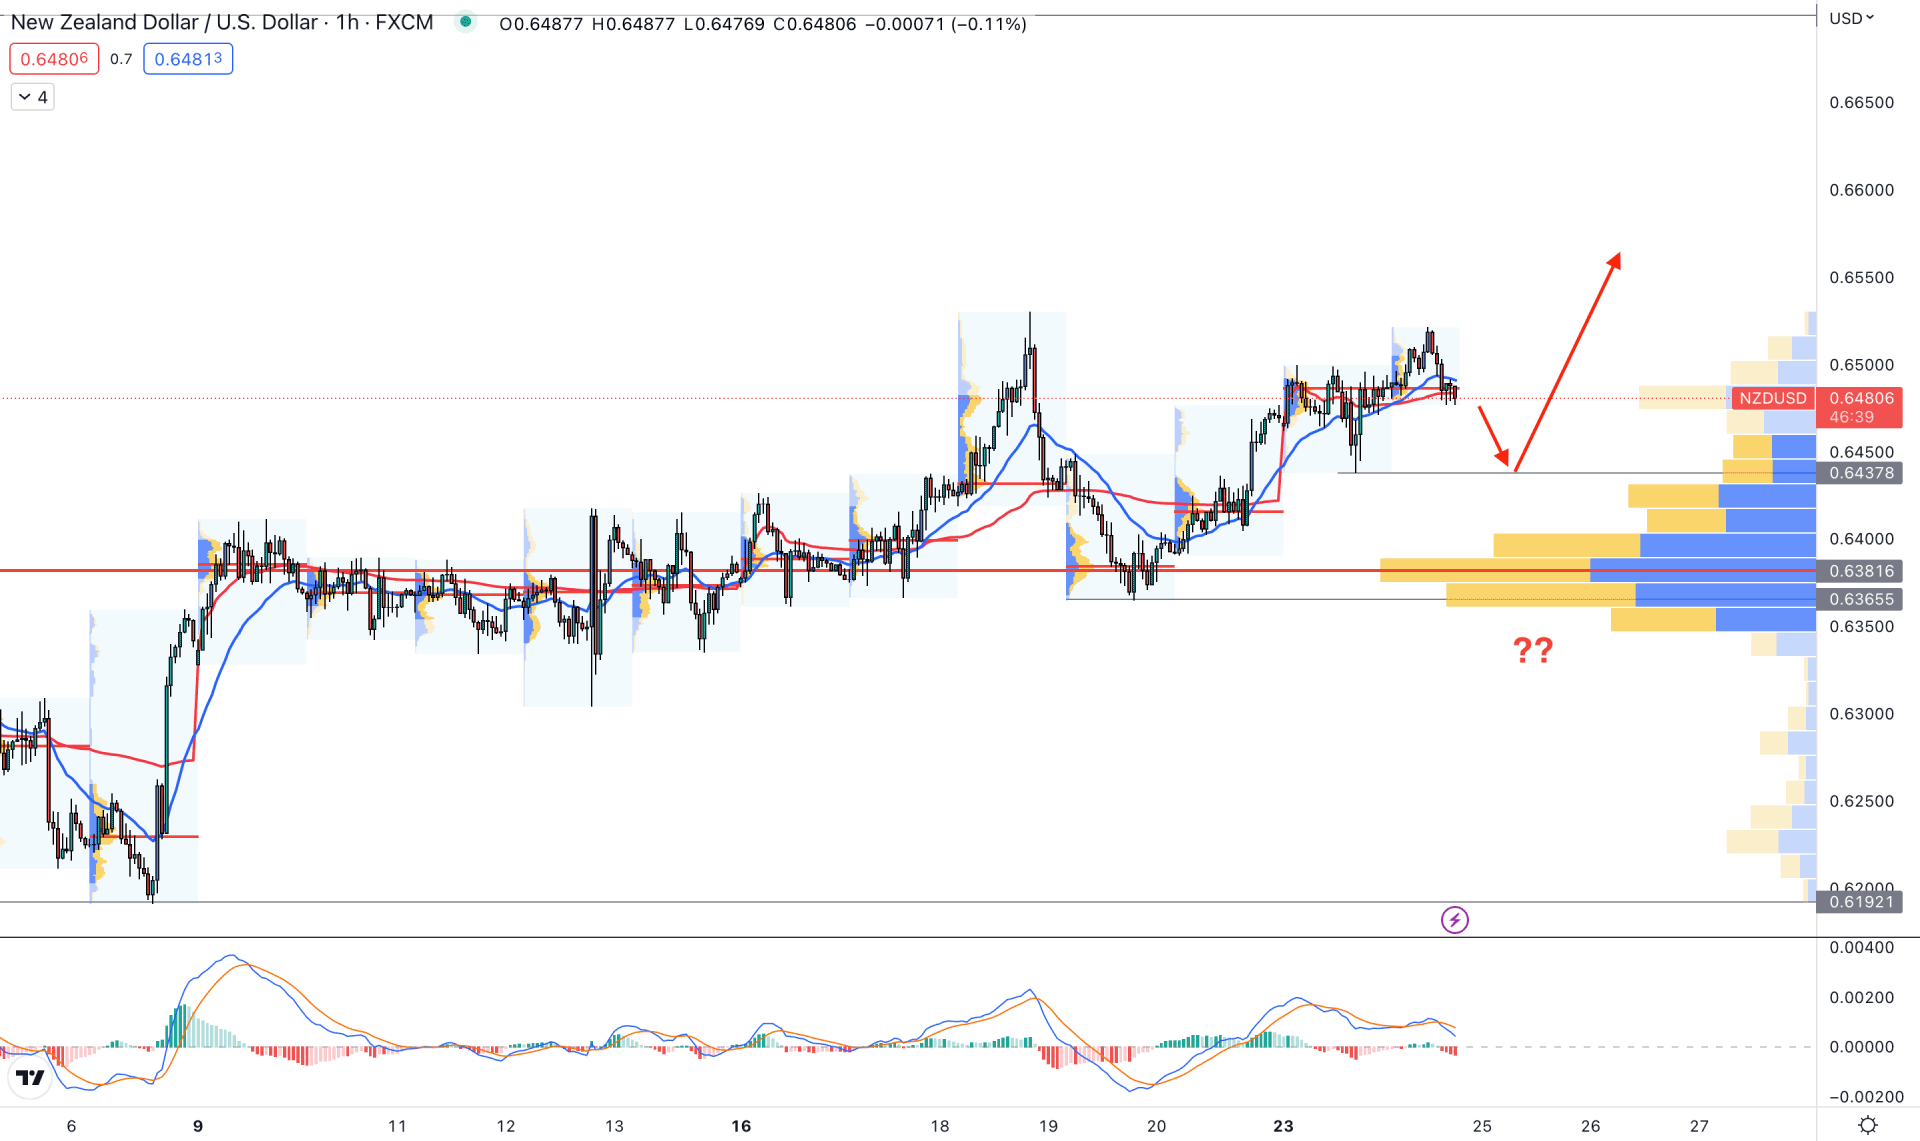
In the hourly chart, the current price is trading above the visible range high-volume level, which is a sign that the price is trading at buyers zone. In that case, any bullish opportunity is valid until the price breaks below the 0.6381 high volume level.
Moreover, the price is facing support from dynamic 20 EMA and the weekly VWAP, while the intraday high volume level is above the price. It is a sign that the price is trading within a correction, which is also visible from the MACD divergence.
Based on the hourly price chart, a minor bearish correction and bullish rejection are needed to offer a long opportunity but breaking below the 0.6370 level coils initiate a correction.
Based on the current multi-timeframe analysis, a strong bullish breakout above the 0.6528 level could initiate a strong buying momentum in the NZDUSD price. Investors should find long opportunities as the buying pressure is strong above the 0.6380 level.


