
Published: May 24th, 2023
After the Reserve Bank of New Zealand (RBNZ) released its policy decision on Wednesday, the NZD/USD pair continued its decline from the 0.6300 level, confronting significant selling pressure.
As the RBNZ astonished the markets by announcing that its most aggressive interest rate hike cycle since 1999 had concluded, the New Zealand dollar experienced a significant decline. The central bank increased its official cash rate (OCR) by 25 basis points to 5.5% on Wednesday, the highest level since the 2008 financial crisis.
The RBNZ projected in its accompanying monetary policy statement that the OCR would peak at its present level. In conjunction with the strength of the US Dollar (USD), this resulted in intense selling pressure on the NZD/USD pair.
The USD Index (DXY) remained near a two-month high attained on Tuesday as investors anticipated that the Federal Reserve (Fed) would maintain higher interest rates for an extended period of time. Recent hawkish remarks from several Fed officials have encouraged market participants to price in the possibility of another 25 basis point rate hike in June. Concerns about a slowdown in global economic growth added to the dollar's safe-haven allure and weighed on the risk-sensitive New Zealand dollar.
Although much more is waiting for the upcoming FOMC meeting minutes, the technical outlook remained on the sellers' side for this trading instrument.
Let’s anticipate the future price of NZDUSD from today’s technical analysis:
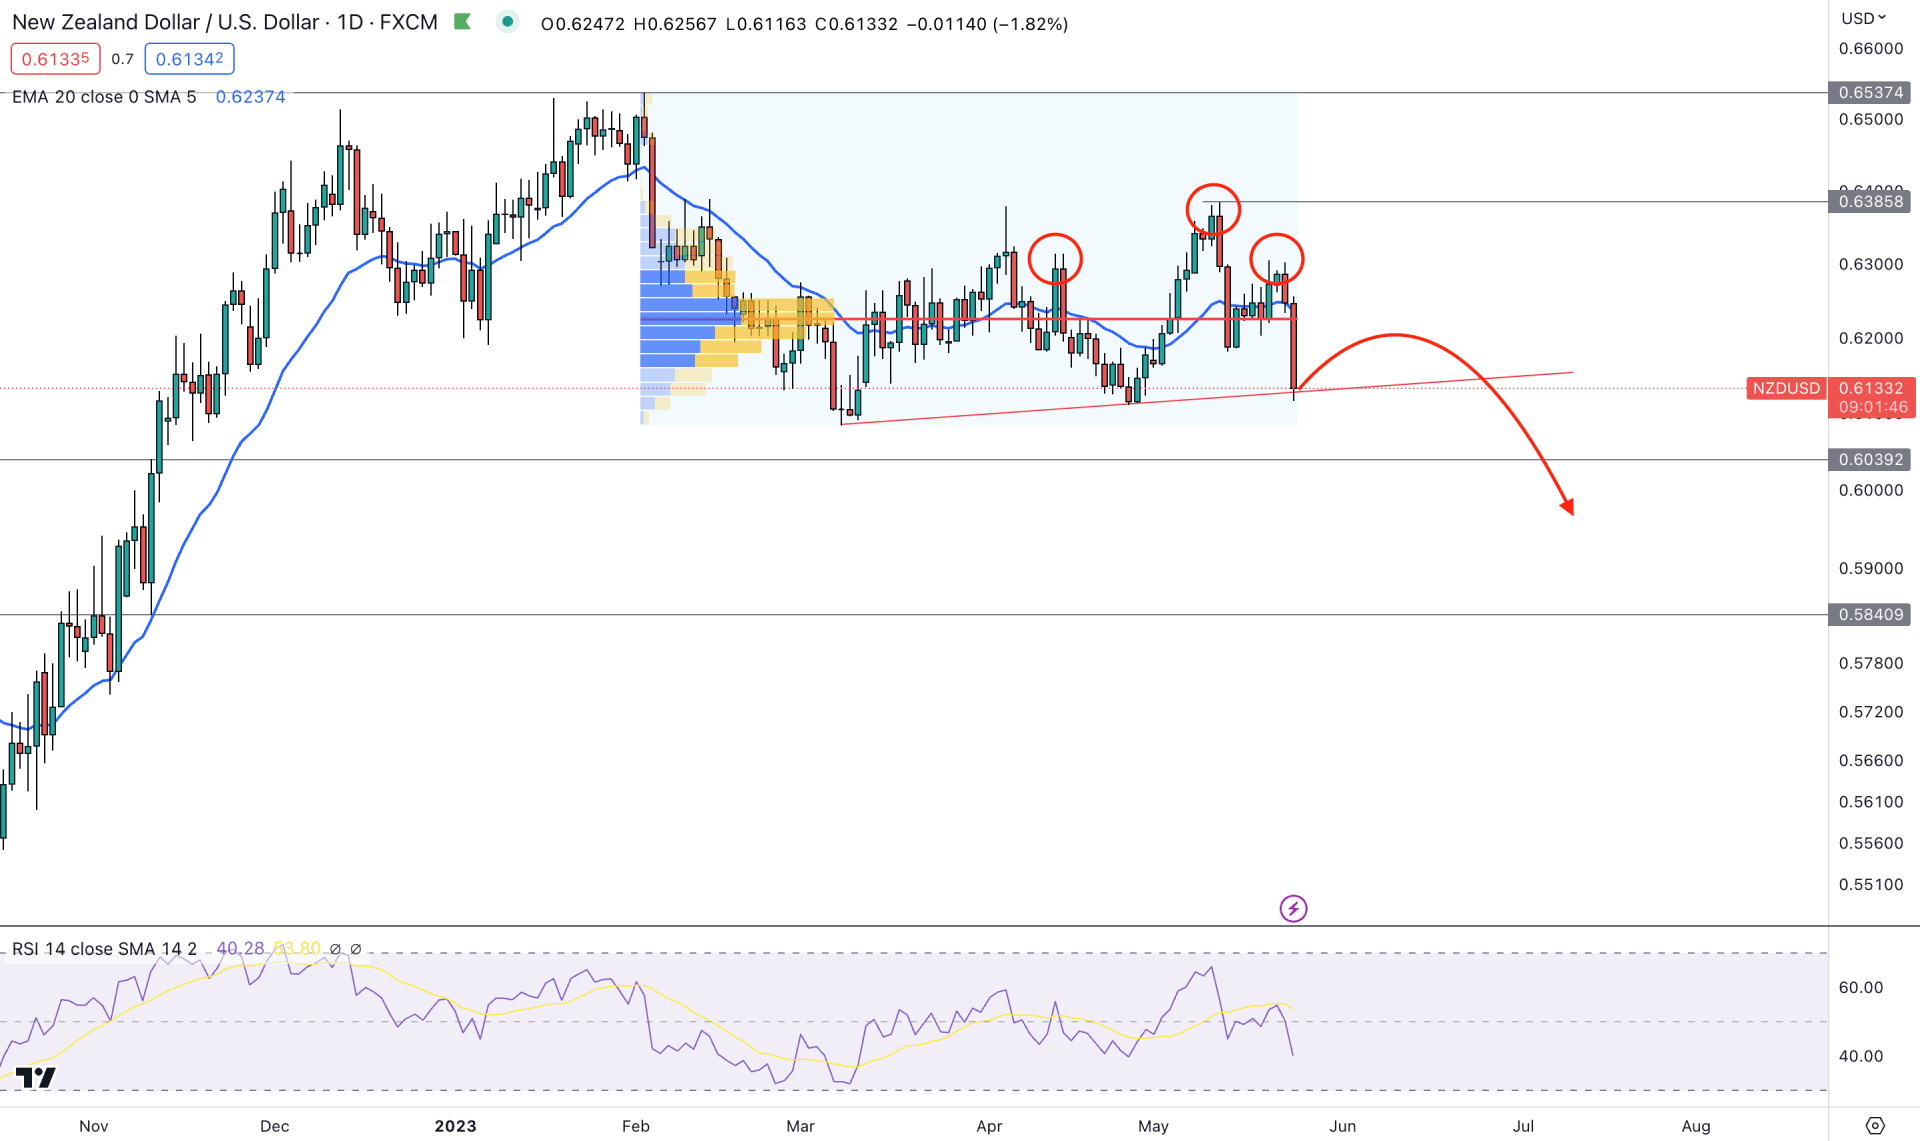
NZDUSD remained within a strong bullish trend in the broader market outlook before testing the 0.6537 swing high. However, the price made several lower lows after making a solid top with a reversal pattern. In that case, bears can take control of the price at any time, which may lead to a sharp fall in the NZDUSD price.
If we look at the volume structure, downside momentum is possible if the price trades below any high-volume area. As per the current context, the highest trading volume level since 02 February 2023 is at the 0.6226 level, above the current price. As the RBNZ-driven bearish pressure holds momentum below the high volume level, we may expect more downward pressure in the coming days.
In the main chart window, a potential bearish possibility is visible from the Head and Shoulders formation in the daily chart. Although the current price faces support at the H&S neckline, a break below this level with a daily close is needed to validate the bearish reversal.
In the short-term momentum, sellers are in control as the dynamic 20 DMA is above the price with a downward slope. Also, the downside pressure is supported by the Relative Strength Index, which is below the 50.00 line.
Based on the daily price outlook of NZDUSD, a valid break below the Head and Shoulders Neckline is needed before aiming for the 0.5840 inefficiency level. However, investors should monitor the intraday price to find any pre-breakout structure before the neckline breakout.
On the other hand, a sharp recovery with a D1 candle above the 20 DMA level would make the downside possibility obsolete. In that case, bulls may resume the existing pressure toward the 0.6385 and 0.6500 levels.
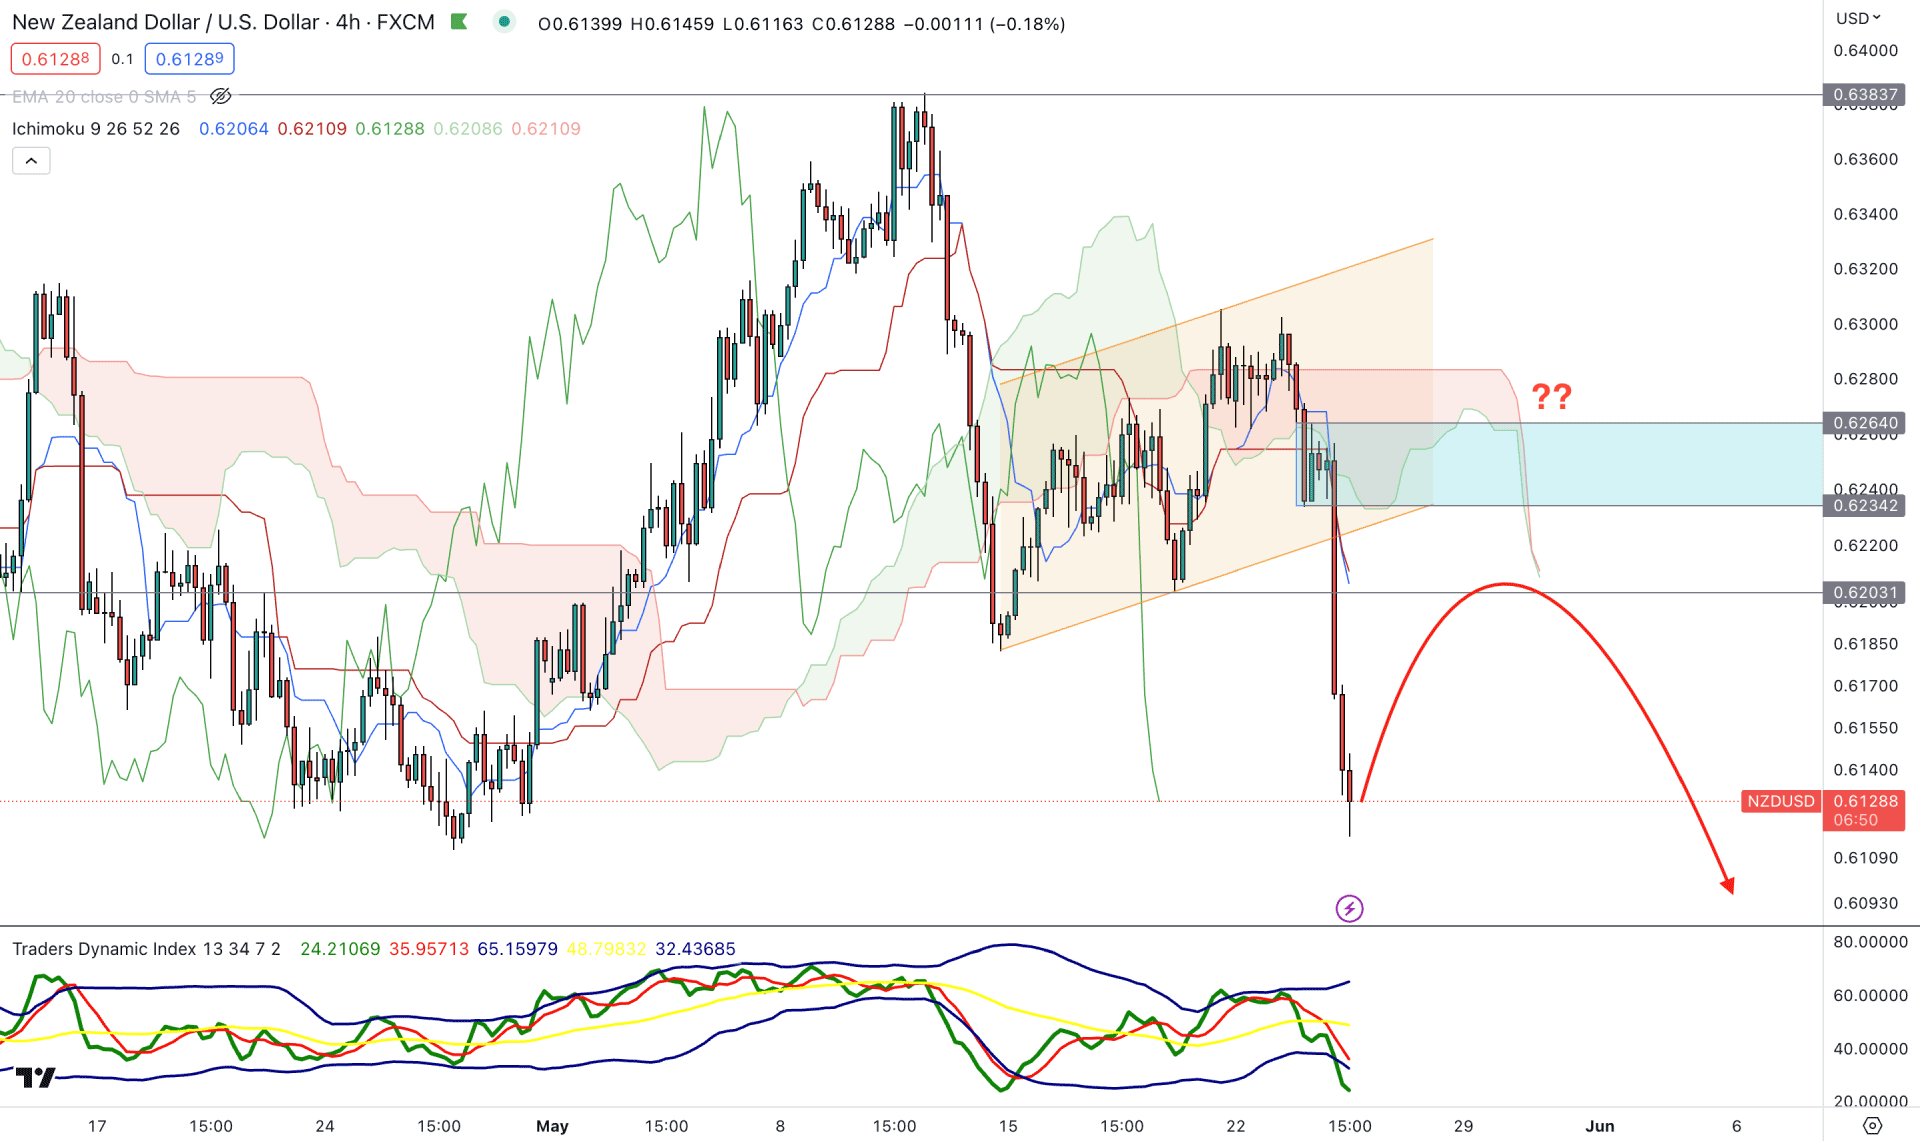
In the H4 chart, a solid example of drop-base-drop is available, where the current price is trading below the Ichimoku Kumo Cloud resistance.
In the future cloud, the thickness is not strong, which suggests that a bullish correction is needed before forming another swing low. Also, there is a strong gap between the price and the dynamic Kijun Sen level, indicating a bullish mean reversal.
The indicator window shows the same story, where an oversold situation is visible. However, the bearish pressure may extend if the TDI level remains below the 50.00 line.
Based on this structure, a bearish trend continuation opportunity needs a valid rejection from the dynamic Kijun Sen or 0.6264 to 0.6234 supply zone. However, a bullish break with a D1 candle above the 0.6280 level would invalidate the downside possibility and open a long opportunity, targeting the 0.6383 resistance level.
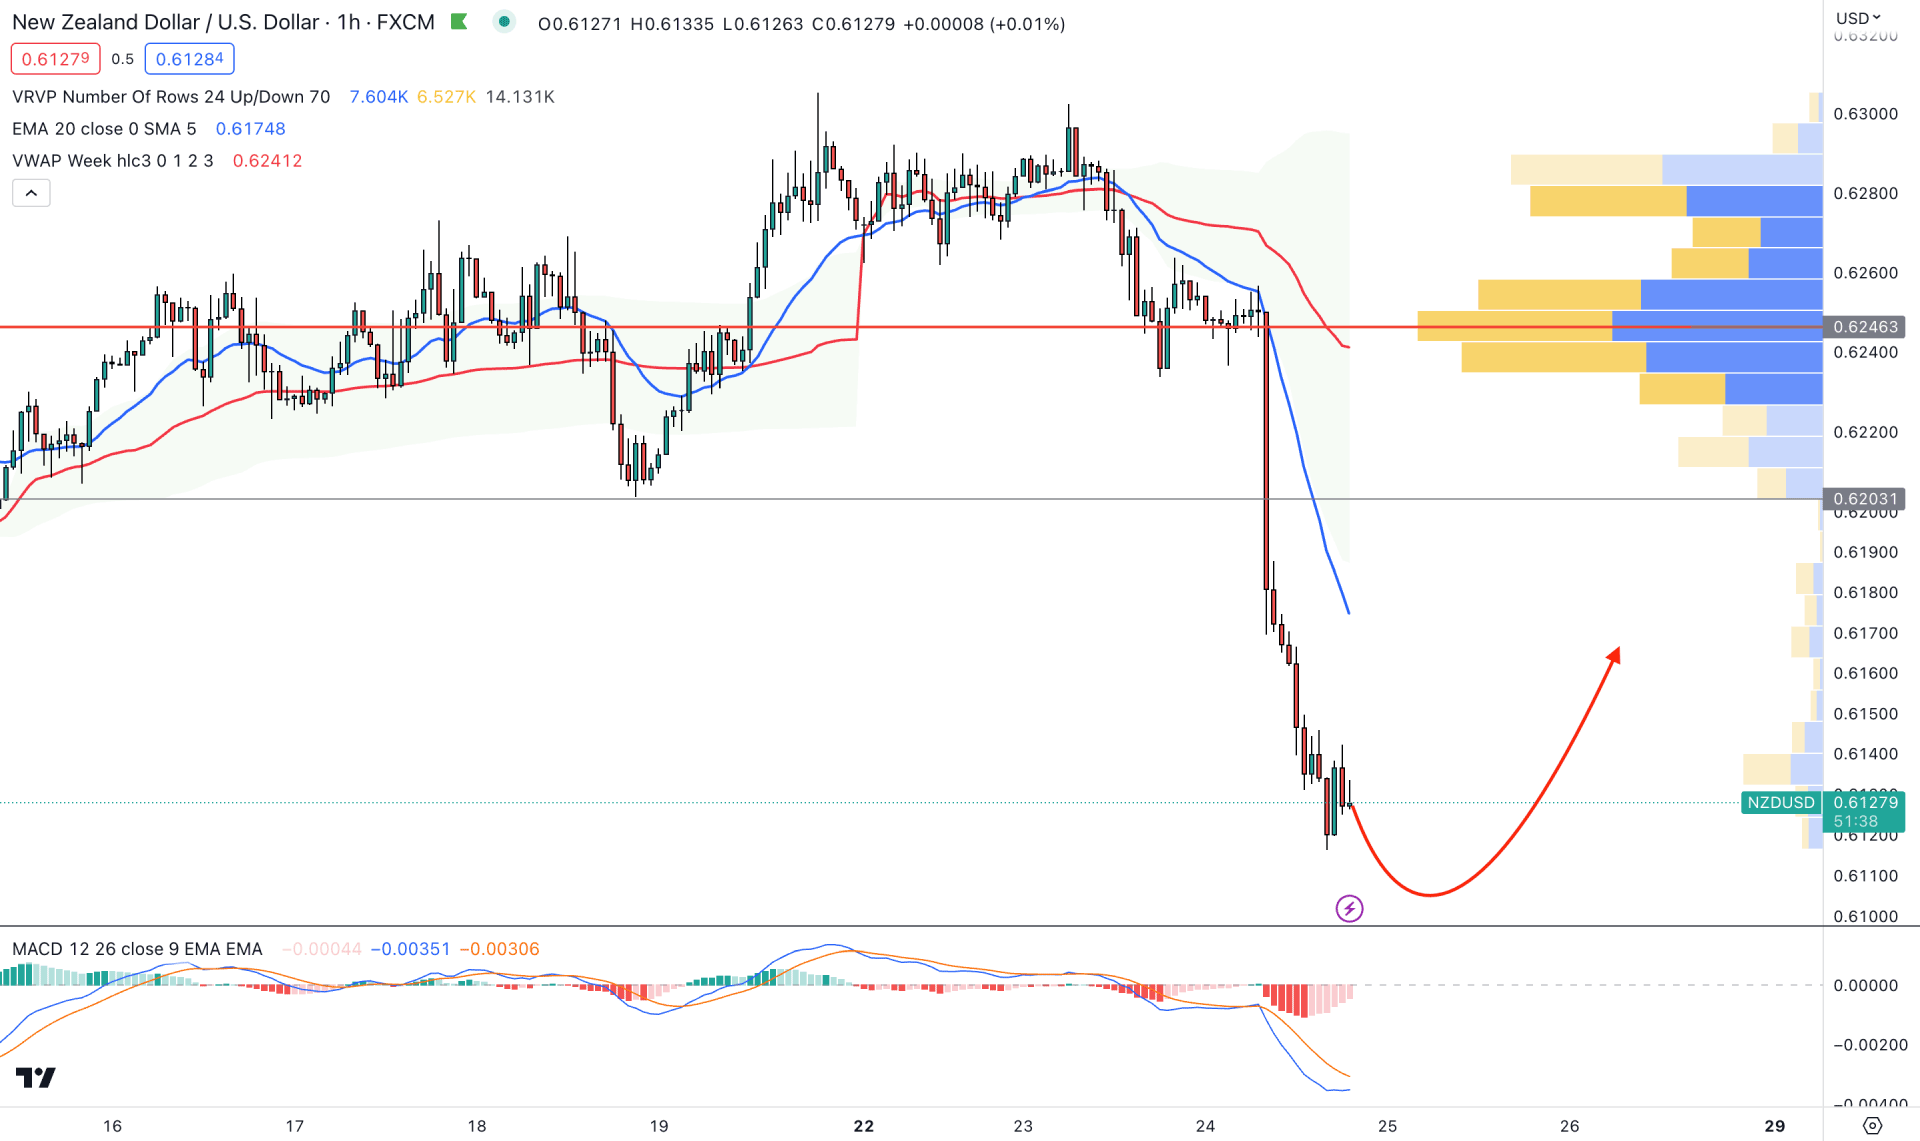
In the H1 chart, the current price is facing extreme selling pressure with a new high volume level formation. It is a sign that the recent bearish momentum is backed by institutional traders' interest.
After a massive bearish H1 candle, the price remained steady on the downside, which opened a possibility of a bullish correction. The dynamic 20 EMA and Weekly VWAp are above the price, working as a resistance.
Based on this outlook, the downside movement can resume until the price breaks above the 0.6246 high volume level. Therefore, any bearish rejection from the dynamic 20 EMA could offer a bearish opportunity, targeting the 0.6000 level.
As per the current context, NZDUSD needs a valid H&S breakout with a daily close before opening a short position. However, an early opportunity to join the potential downside momentum is possible if the H4 price forms a sell signal after a sufficient bullish correction.


