
Published: November 2nd, 2023
An optimistic prognosis favors higher-risk currencies like the New Zealand Dollar (NZD) as the US Federal Reserve (Fed) prepares for its monetary policy meeting. Recent US economic data presents a varied picture, with the ADP Employment Change report for October showing an increase in job creation compared to the previous month but falling short of expectations.
On the other hand, the US Department of Labor's JOLTs report indicates that the number of job openings continued to increase in September, surpassing both estimates and August figures.
Nevertheless, the manufacturing sector in the United States continues to contract. Twelve consecutive months have passed, with the ISM Manufacturing PMI for October remaining below the critical 50-point threshold for expansion or contraction. This is due to declining new orders and increased manufacturing prices simultaneously.
On the other hand, New Zealand's employment data hurt the NZD/USD pair, as the country lost positions and the unemployment rate rose. This event will likely discourage the Reserve Bank of New Zealand (RBNZ) from increasing interest rates.
In addition, the NZD could face headwinds from the uncertain nature of China's economic recovery, as evidenced by the Caixin Manufacturing PMI for October, which showed further deterioration, in line with data from the National Bureau of Statistics (NBS) the day before.
Let’s see the upcoming price direction of this pair from the NZDUSD technical analysis:
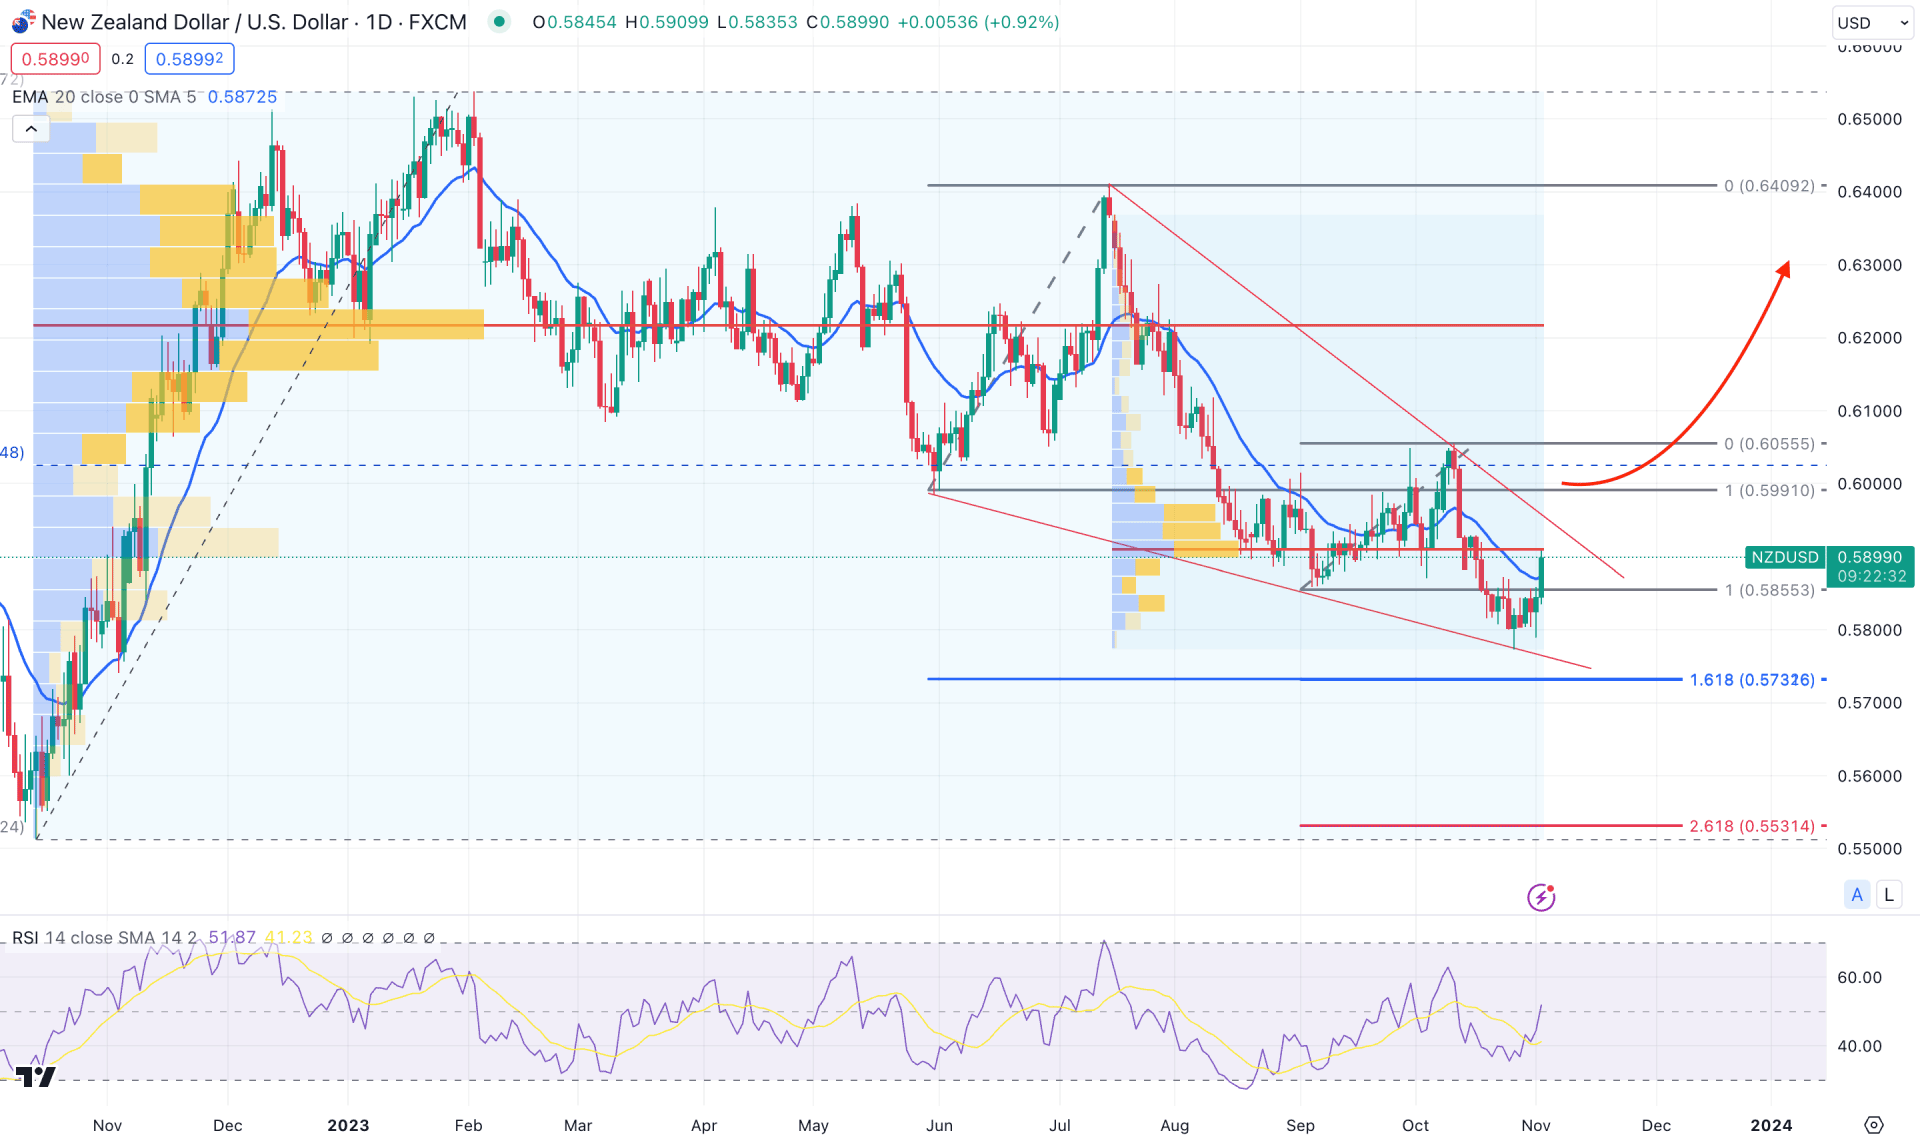
In the daily chart of NZDUSD, the 50% Fibonacci Retracement level from the October 2022 low to the February 2023 high is at the 0.6055 level, which is 2.16% higher than the current price. As the current price trades at the discounted area of the long-term bullish swing, any bullish signal could work better than bearish setups.
In the higher timeframe, The monthly candle suggests a bearish continuation as the October close came with a bearish engulfing bar. However, the weekly price shows a different picture, where the last W1 candle came by eliminating the last three week’s bearish pressure.
In the daily chart, the 161.8% Fibonacci Extension level from the 0.5991- 0.6409 zone is at 0.5732 level. Another 161.8% Fibonacci Extension level from the 0.5855- 0.6055 zone is also at the 0.5732 level. Moreover, the recent price trades sideways within a falling wedge, where a bullish break could validate a long opportunity.
The recent daily candle moved above the dynamic 20 EMA, while the RSI pushed higher to the 50.00 neutral level.
Based on the current daily outlook, a bullish trend may initiate after forming a valid breakout above the falling wedge resistance. In that case, the upward pressure could extend toward the 0.6055 resistance level. Moreover, a stable market above this level could extend the momentum toward the 0.6400 psychological level.
On the bearish side, the 0.5732 level Fibonacci Extension level could be a strong barrier to bulls as a bearish daily candle below this low could open a short opportunity after a considerable correction.
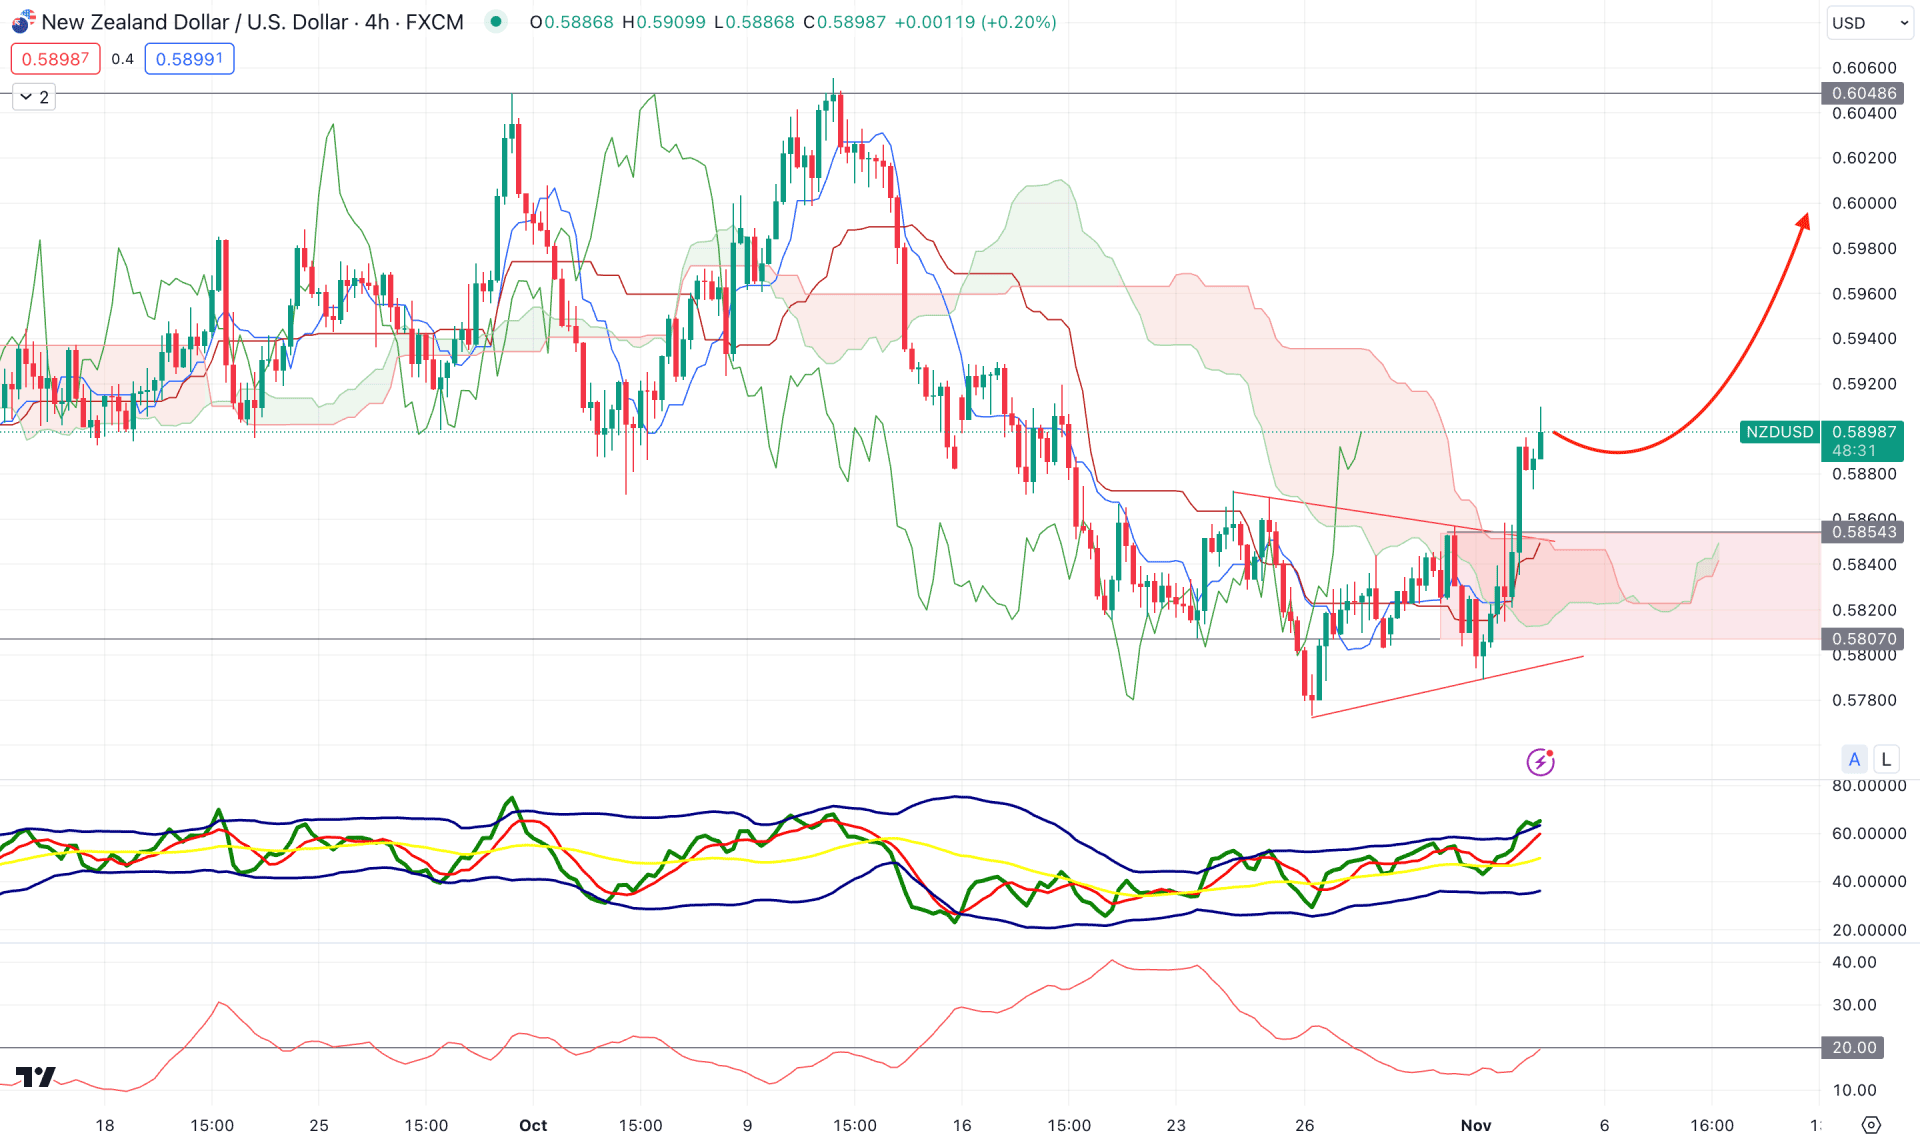
In the H4 timeframe, the overall market momentum is bullish as the recent price formed a bullish range breakout with impulsive pressure. Moreover, the Senkou Span A and B show an upward pressure in the future cloud, suggesting a trend continuation.
In the indicator window, the Average Directional Index (ADX) initiates a trend as it moves at the 20.00 level. On the other hand, the Traders Dynamic Index (TDI) reached the overbought level, which suggests a pending downward correction in the market.
Based on the current H4 outlook, investors might expect the bullish trend to extend in the coming days, where the primary target is to test the 0.6048 resistance level.
However, a bearish correction is possible toward the 0.5854 to 0.5807 demand zone, but a deeper discount below the 0.5800 level could extend the downside pressure towards the 0.5700 level.
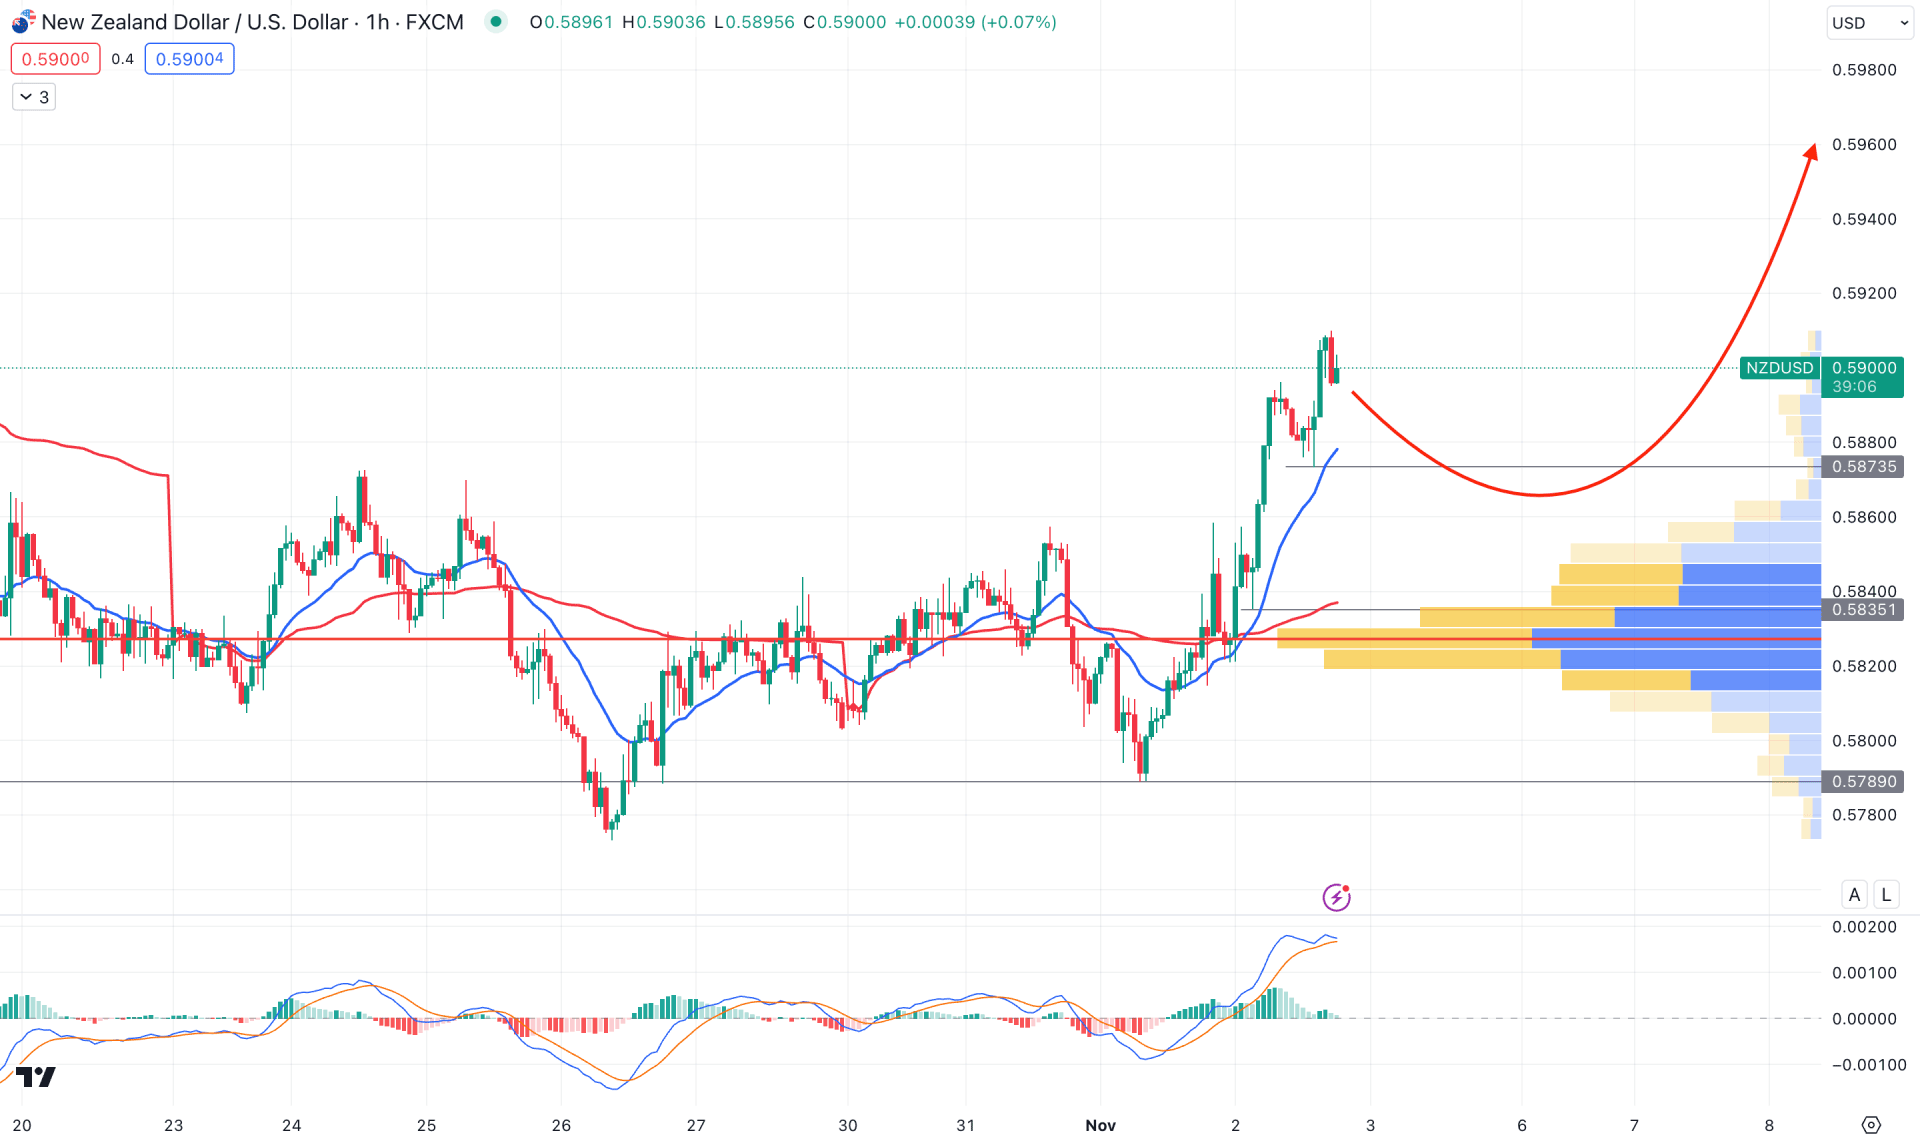
In the hourly time frame, the overall market pressure is bullish as the recent price increased above the 0.5870 level with impulsive pressure. Moreover, the near-term high volume level is below the current price, which suggests an active buying pressure in the market.
In the indicator window, the MACD Histogram is bullish, but the MACD line reached the overbought level, signaling a bearish possibility.
Based on the current H1 chart, a bearish correction is potent due to the mean reversion from the high volume level. In that case, a bearish H1 close below the 0.5870 level could initiate a short-term bearish opportunity, targeting the dynamic VWAP support. However, the 0.5857 to 0.5800 would be a buy zone, where a bearish pressure below 0.5789 could be a short opportunity.
In the current multi-timeframe analysis, the overall market momentum looks corrective, where a bullish break from the channel support would signal a long-term bullish opportunity. On the other hand, the monthly candle suggests a bearish trend continuation, where downside pressure below the October low could be a strong bearish opportunity.


