Published: September 4th, 2024
For the fourth day in a row, the NZDUSD pair is losing ground, which may be ascribed to market respondents' cautious approach in advance of this week's important economic report releases. The amount of the anticipated interest rate reduction by the Fed during the month may be revealed by these data.
The decline in Treasury yields causes the US dollar to weaken. As of this writing, the yields in US Treasury bills with a 2-year maturity are 3.86%, while those with a 10-year maturity are 3.83%. But after the ISM Manufacturing PMI was released, the Greenback gained traction. The index barely increased from 46.8 in July to 47.2 in August, missing the market's projected 47.5. In the previous 22 months, there have been 21 contractions in US manufacturing activity.
China's Services Purchasing Managers' Index (PMI) fell to 51.6 in August from 52.1 in July, putting pressure on the New Zealand Dollar (NZD). This decline is noteworthy because of the robust trade ties between China and New Zealand.
Furthermore, Bank of America (BoA) has downgraded its estimate of China's economic expansion to 4.8% in 2024 from 5.0% in the previous projection. The growth estimate for 2025 has been revised to 4.5%, and the outlook for 2026 stays at 4.5%.
After declining 1.7% in July, New Zealand's ANZ Commodity Price Index rose 2.1% in August. S&P Global Ratings Director Martin Foo issued a warning on Wednesday in an interview with Bloomberg, saying that "New Zealand's current account deficit needs to narrow further." Although he is generally satisfied with New Zealand's sovereign evaluating prospects, Foo continued, he is keeping a close eye on the nation's significant current-account deficit financing and sluggish growth in the economy.
Let's see the further aspect of this pair from the NZDUSD technical analysis:

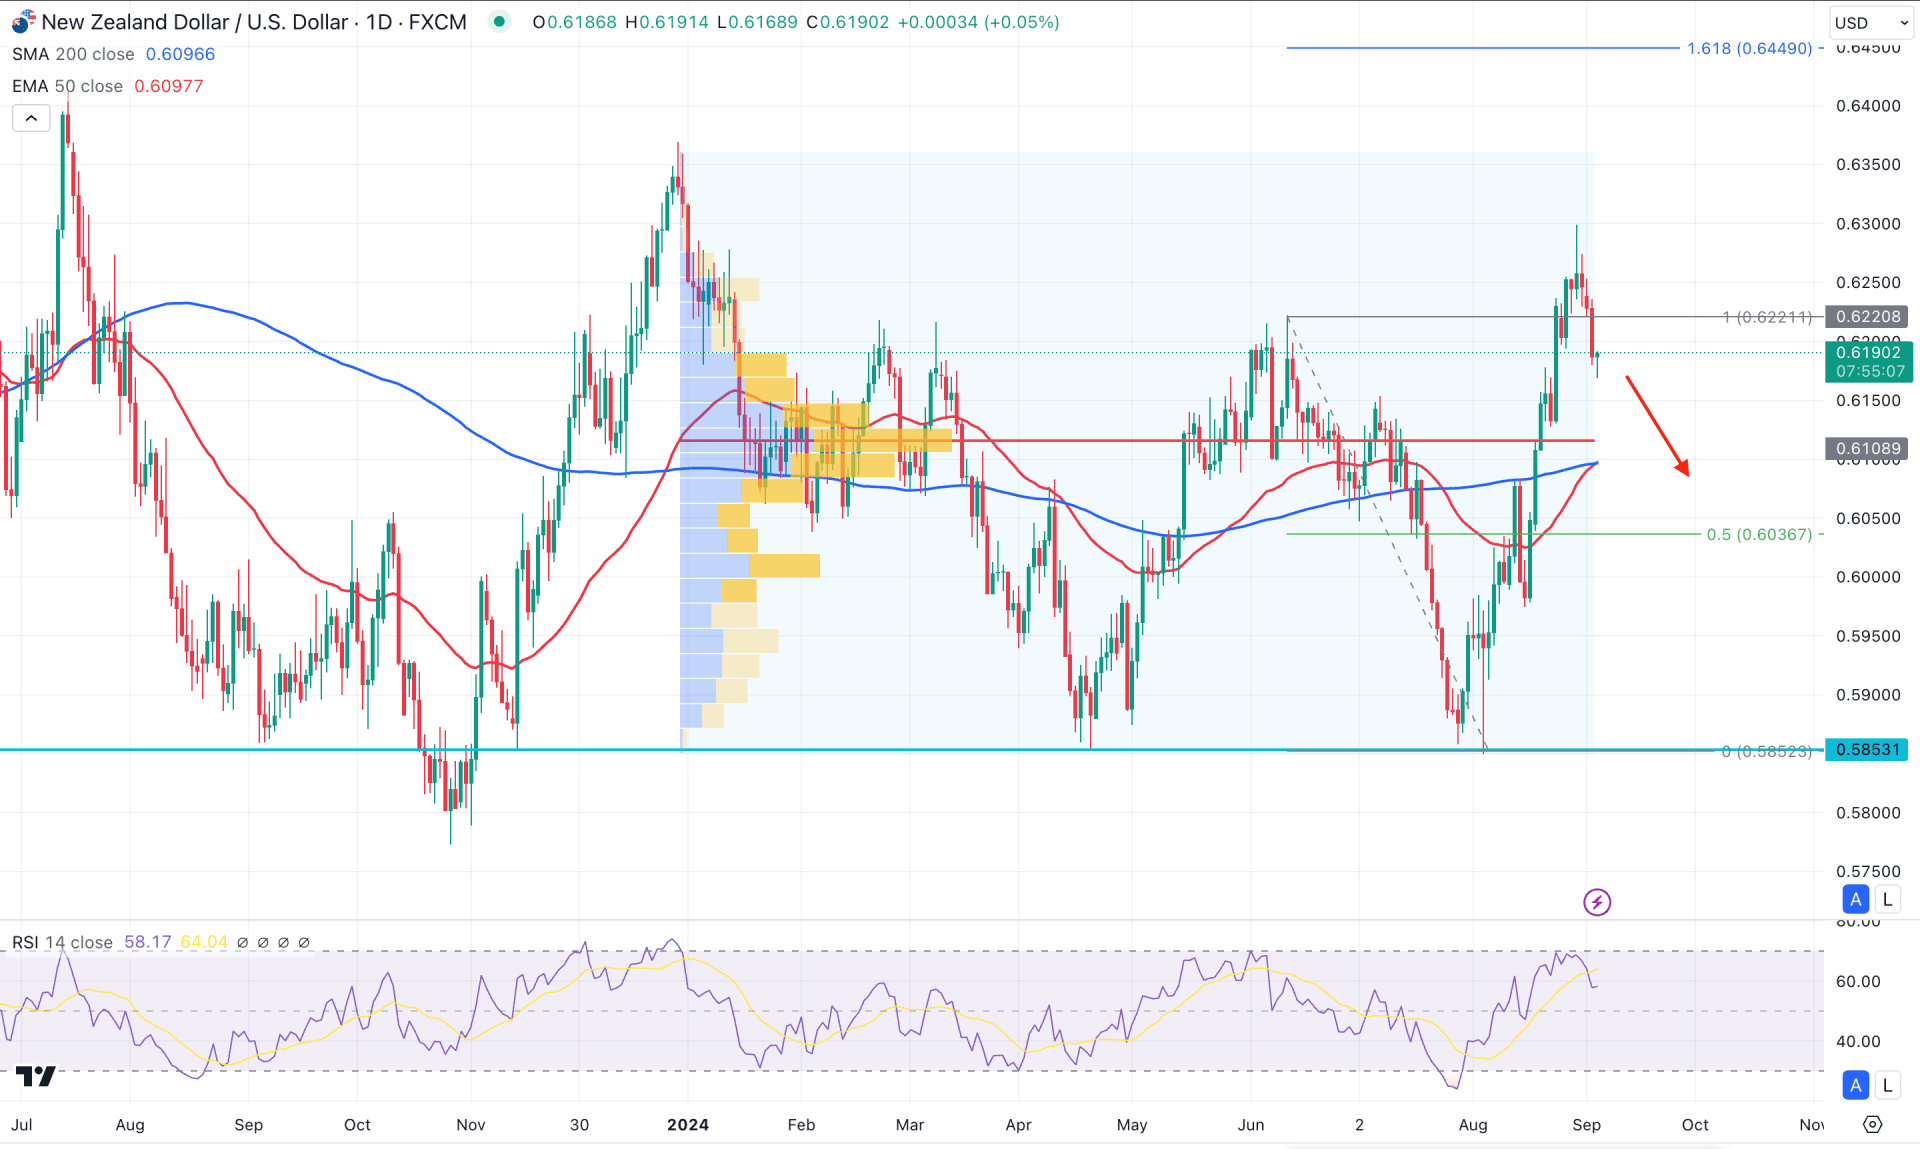
In the daily chart of NZDUSD, the current price trades with a bearish pressure after a long bullish wave. Although the current price trades within a selling pressure, the broader market direction remains on the buyers' side. In that case, the primary aim for this pair is to focus on long trades once the sufficient downside correction is over with a corrective momentum.
In the monthly candlestick, the current candle formed a bullish engulfing pattern, which is a strong bullish indicator. Meanwhile, the weekly price trades sideways after finding a peak, which indicates more downside pressure to come.
In the volume structure, the bullish possibility is potent as the current price is trading above the 0.6108 high volume line. Primarily this high volume level might work as an immediate support, which is just above the 50 day EMA level.
Meanwhile the 50 day Exponential Moving Average aimed higher and reached the 200 day SMA line, which might signal a bullish price action from the Golden Cross.
Looking at the current swing, the price is trading above the 50% Fibonacci retracement level from the current swing, which signals a premium zone. The 14-day Relative Strength Index (RSI) also reached the overbought 70.00 line and rebounded lower.
Based on the daily market outlook of NZDUSD, a downside correction and a valid bullish reversal from the 50 day EMA coil signal a long opportunity. In that case, the price is likely to extend the upside pressure and find resistance from the 0.6449 Fibonacci Extension level.
On the bearish side the recent high volume line could be a primary barrier, where a valid bearish daily candle below this line might extend the selling pressure towards the 0.5900 area.

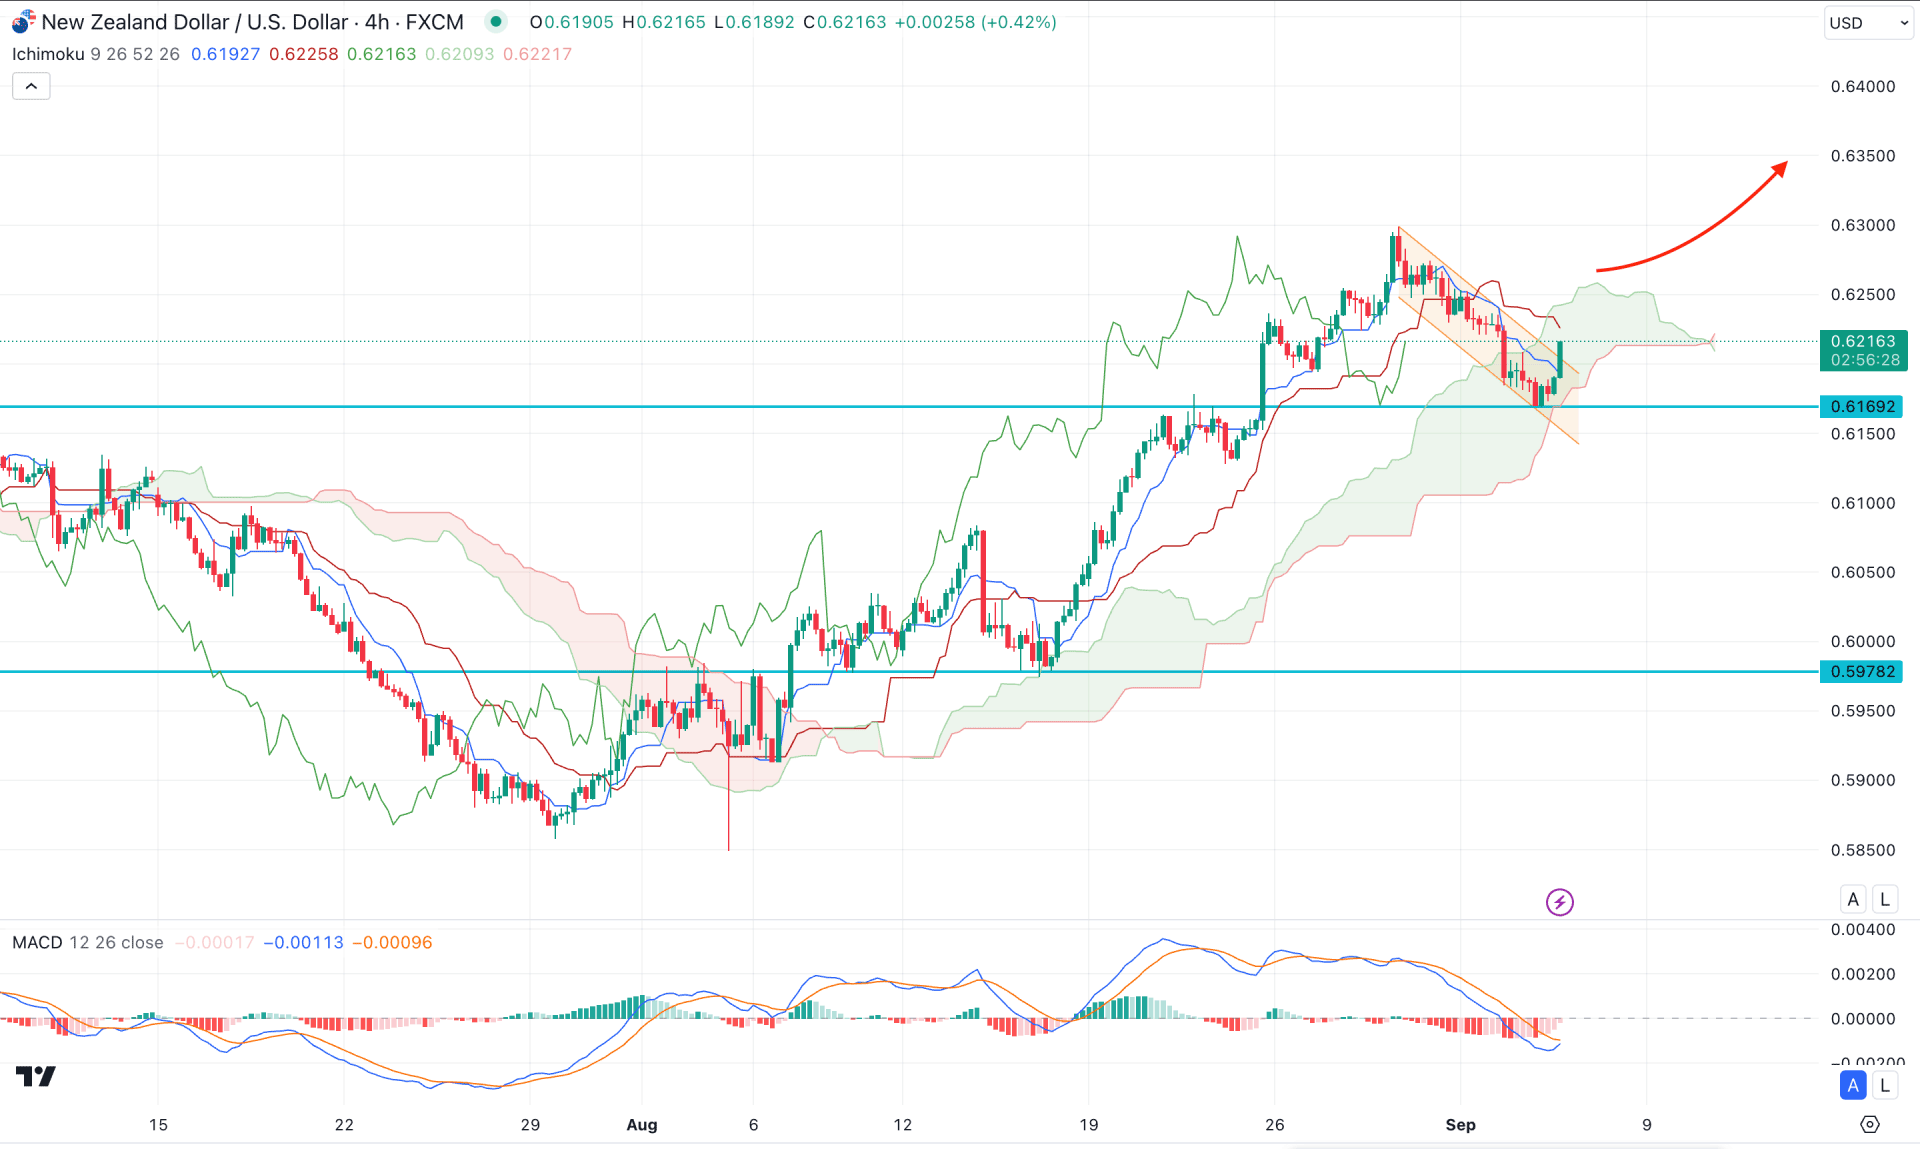
In the H4 timeframe, the recent price showed a downside correction and found the cloud zone as a crucial support. Moreover, the price trades within a descending channel, from where a bullish breakout could offer a trend continuation opportunity.
On the other hand, the Senkou Span A and B remain closer to the Futures Cloud, which signals a corrective pressure. However, the MACD Histogram, which is currently in the neutral zone, presents a neutral opinion.
Based on this outlook, a positive Histogram above the neutral point with a valid recovery above the Kijun Sen level could extend the upward pressure at the 0.6400 level. However, a failure to hold the price above the cloud zone might extend the loss, which might provide another long opportunity from the 0.6050 to 0.6000 area.

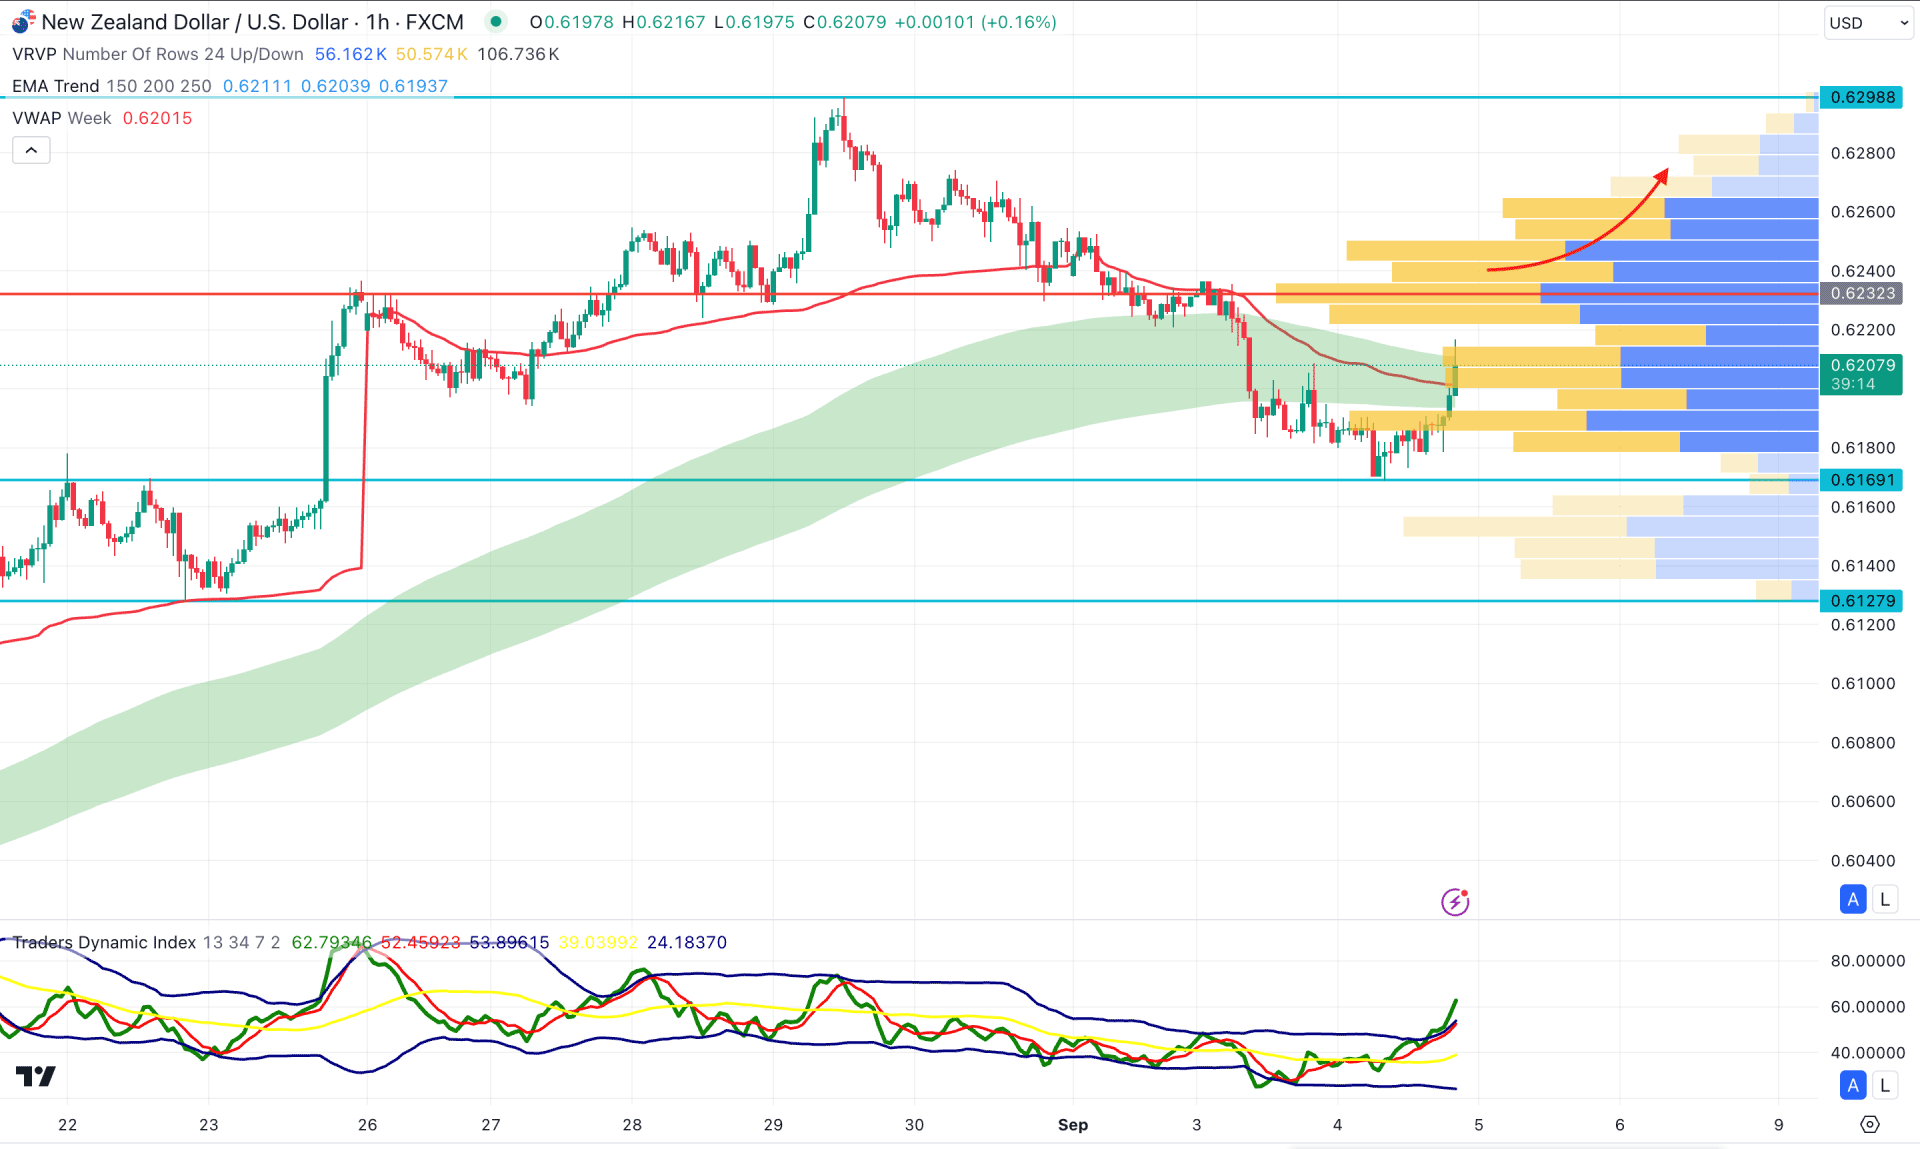
In the hourly time frame, the current price is trading above the dynamic weekly VWAP level, suggesting a potential bullish breakout. However, the Moving Average wave is still working as a resistance from where a bullish break is needed.
In the indicator window, the Traders Dynamic Index (TDI) shows strong buying pressure as the current level hovers at the bullish peak. In that case, a valid price action above the currently visible range high volume line might validate the long-term buying pressure targeting the 0.6298 high.
However, a downside pressure might extend if a beamish H1 candle comes below the 0.6169 level.
Based on the current market outlook, NZDUSD is more likely to form a valid long signal once the downside correction is over. Investors should closely monitor how the price trades on the hourly chart before anticipating a bullish movement.