
Published: December 7th, 2021
The global foreign exchange market seems fatigued regarding the good of New Zealand, where the downside pressure in the NZDUSD is still valid. On the other hand, some prominent analysts, including ANZ bank’s forecast of testing the 0.72 level in 2022, would be questionable.
According to the previous price action at the year-end, NZD was found to become stronger against the US Dollar. However, the situation is different now, where the recent Omicron variant of coronavirus keeps the global market volatile. In that case, the US dollar is more likely to win the battle due to having a better value during the uncertainty.
However, the bullish pressure in the US Dollar is already high where the market is now priced in for the possibility of multiple rate hikes in 2022. The yearly decrease period appeared where the long bear run in NZDUSD has a higher possibility of showing a correction in the coming days.
Let’s see the upcoming price direction from the NZDUSD technical analysis:
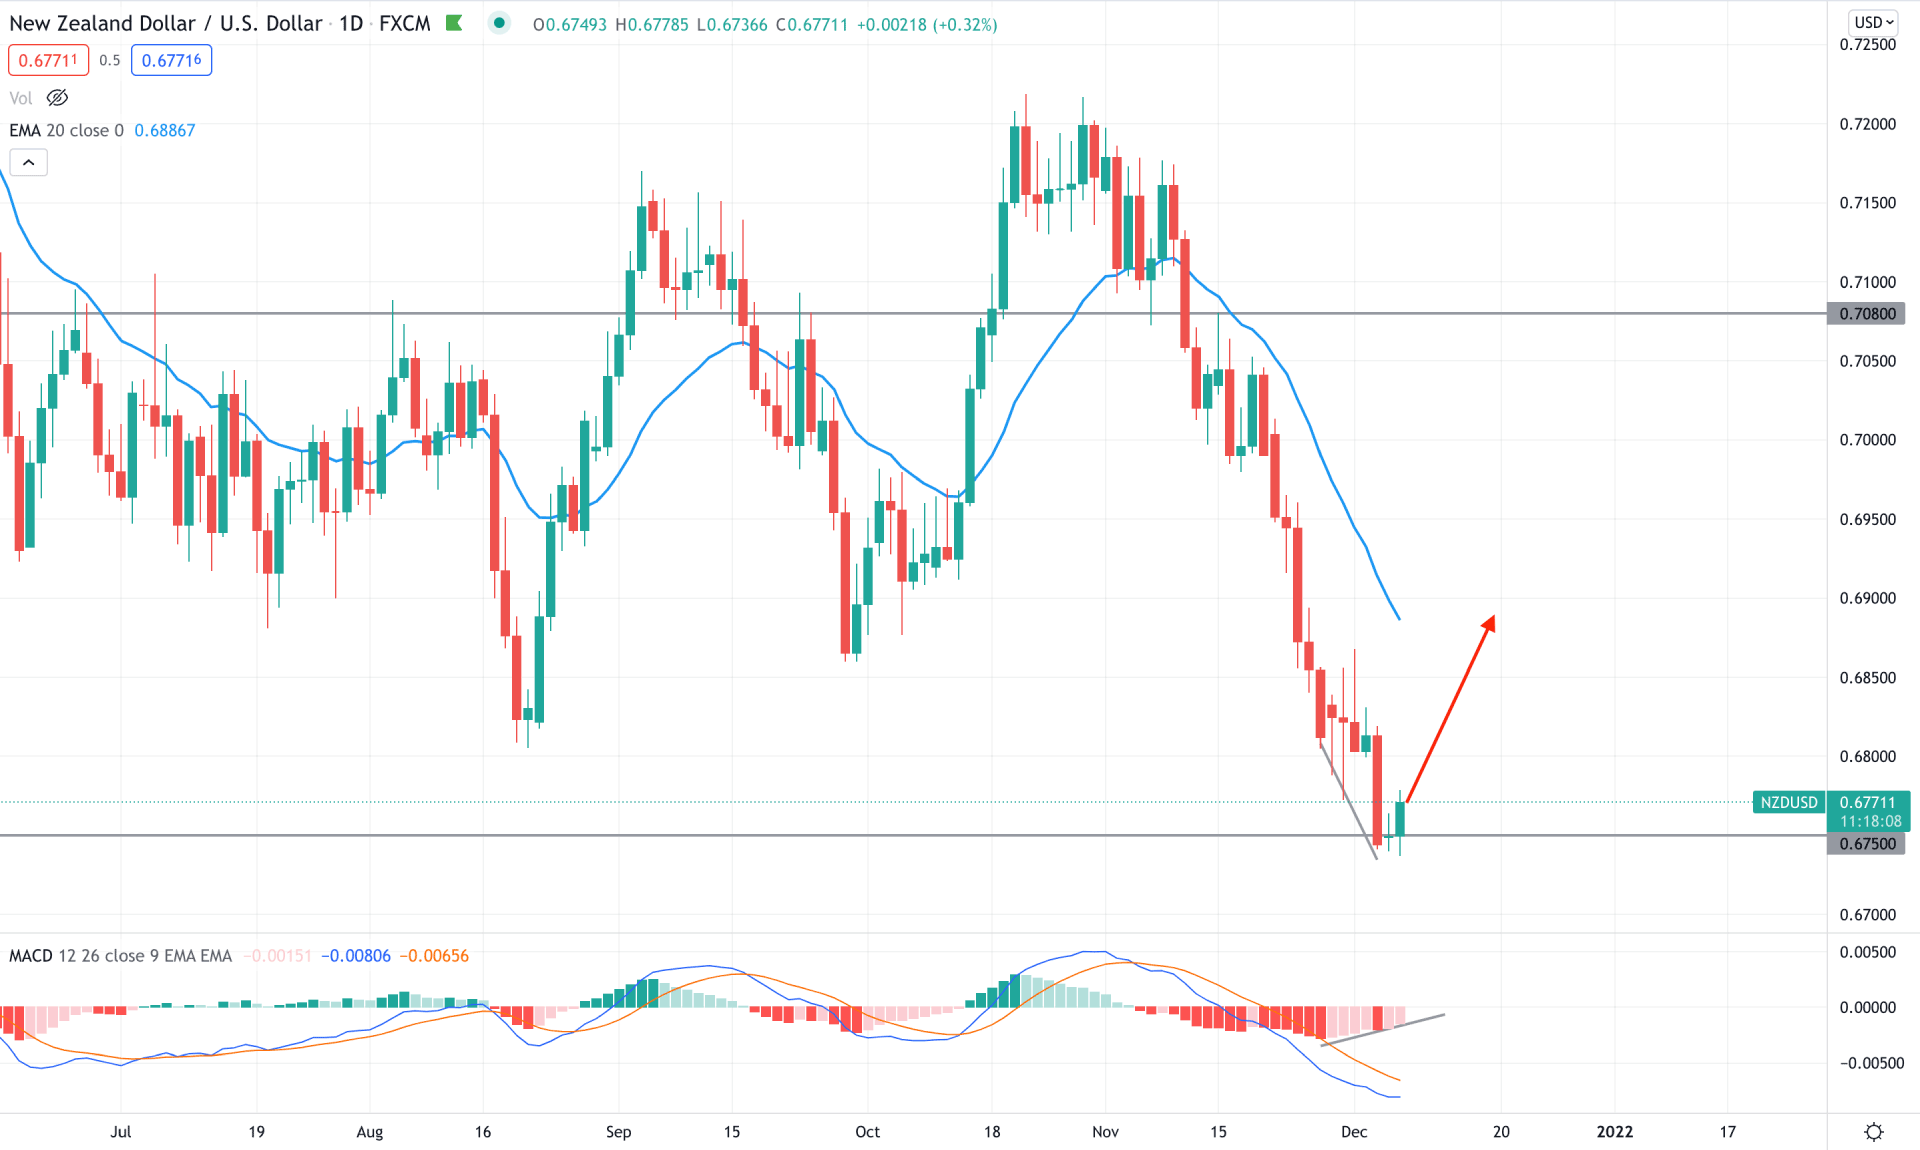
NZDUSD bears show an amazing bearish pressure from mid-October, making a strong downside pressure of more than 400 pips. However, the most recent price reached an important event level at 0.6750, which was a strong barrier in pre and post-Covid situations. Therefore, any intraday buying setup from this area is more likely to show a bullish correction of the current bearish rally.
The above image shows how the price reached the 0.6750 bottoms and formed indecision in the daily chart. Meanwhile, a Hidden divergence formed with the MACD Histogram with the possibility of a bullish correction. The dynamic 20 EMA is above the current price in the main chart, where the gap between the price and dynamic level is almost 150 pips. Therefore, a bullish correction is pending based on the mean reversion with the price.
Therefore, the bearish trend is still intact in the higher time frame based on the daily price structure. However, any bullish rejection in the intraday chart is more likely to take them up towards the 0.6900 area. The buying possibility is valid as long as the price trades above the 0.6700 level. A break below the 0.6700 level with a strong bearish daily candle is more likely to extend the current rally towards the 0.6500 area.
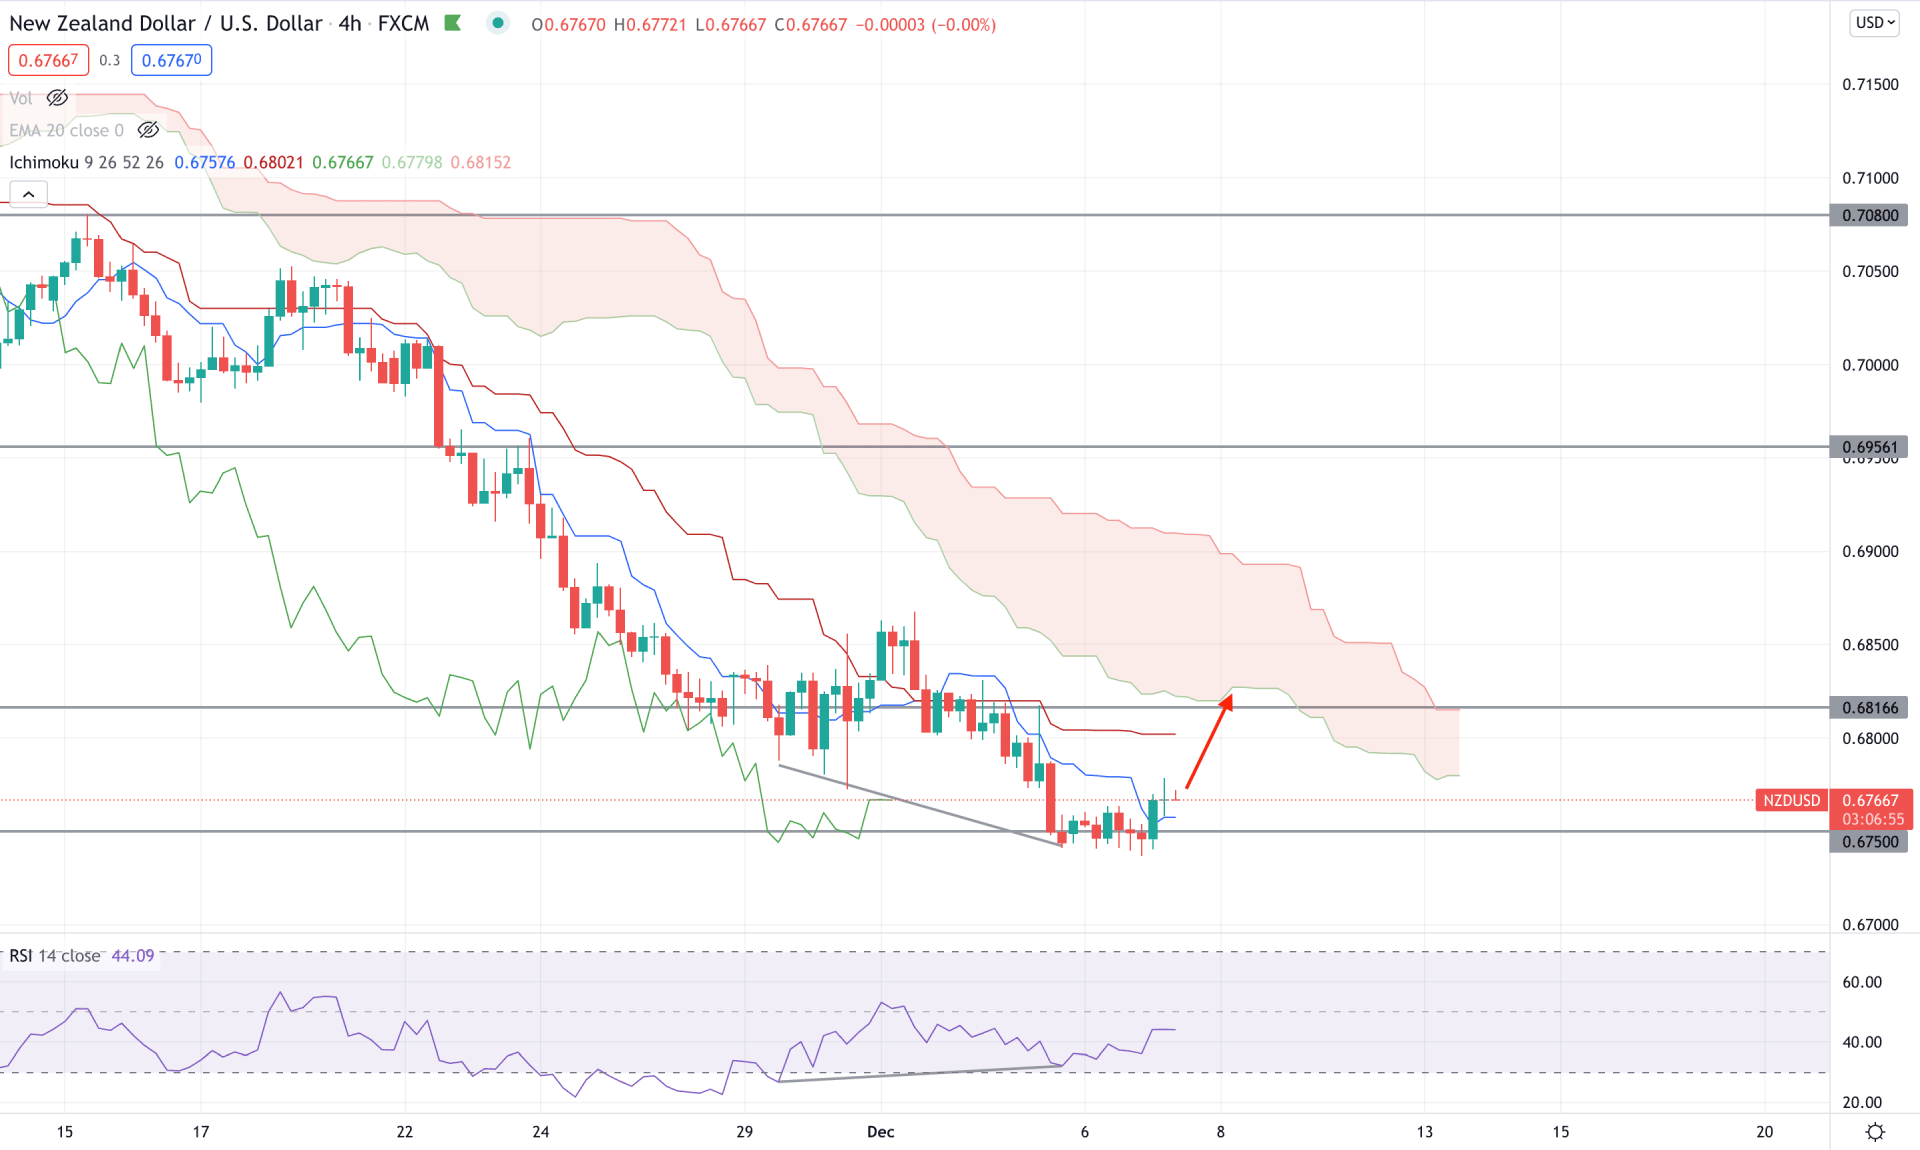
According to the Ichimoku Kinko Hyo, the H4 timeframe is trading within a strong bearish trend. However, the recent price reached the 0.6750 bottoms and moved above the dynamic Tenkan Sen. In the future Cloud, the Senkou Span A is below the Senkou Span B but moving up. Therefore, as long as the price trades above the 0.6700 area, it may move up with a corrective pressure.
The above image shows how the price traded above the dynamic Tenkan Sen while the Kijun Sen remained flat above the price. Moreover, the regular divergence with the RSI signifies buyers’ presence at the bottom. If the price moves above the 0.6816 level with a bullish H4 close, it may move higher towards the 0.6900 area. On the other hand, any bearish pressure below the 0.6750 level will likely extend the current selling pressure towards the 0.6500 level.
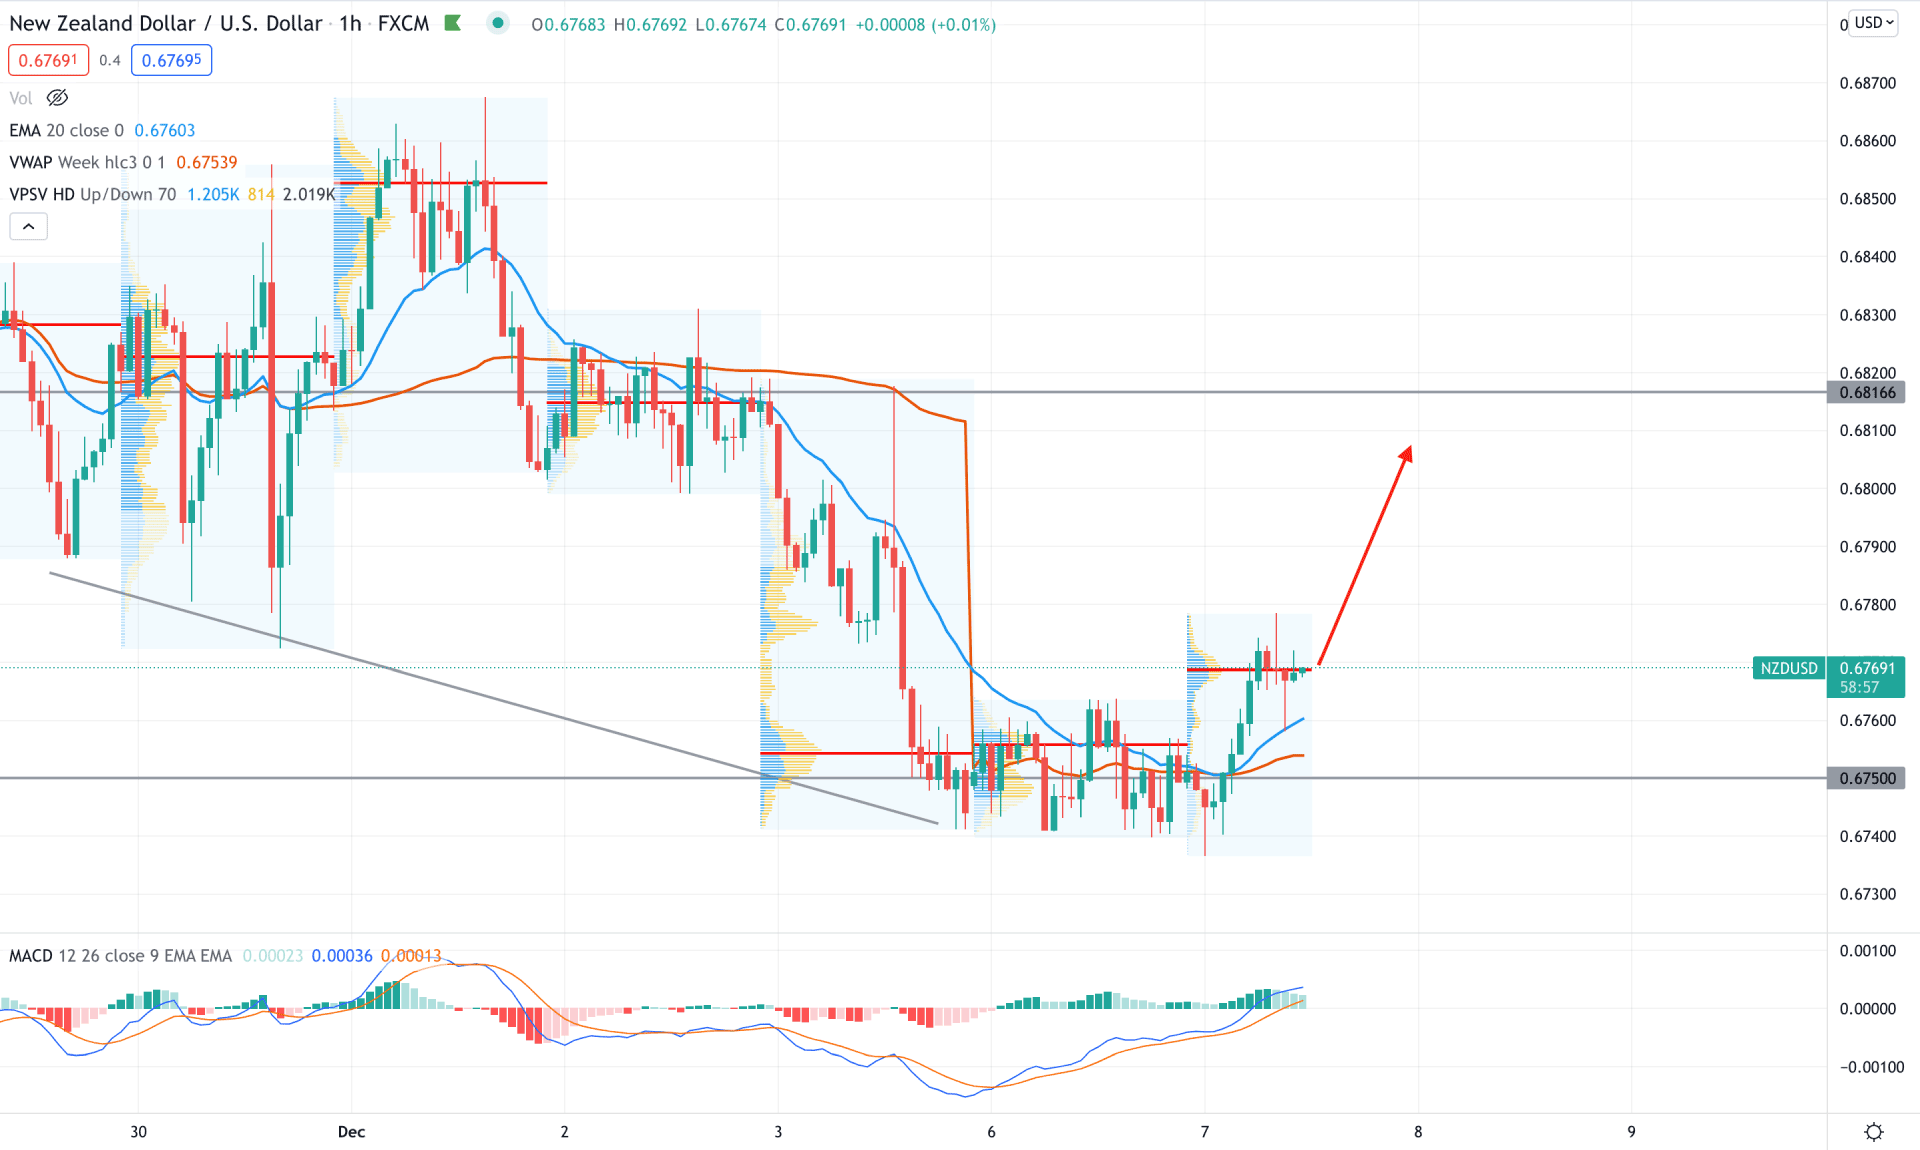
In the intraday chart of NZDUSD, the price moved down and reached the 1.6750 level with strong selling pressure. However, the price became volatile and broke above the intraday swing high with a strong volume. Therefore, buyers’ presence in the 0.6750 level may appear with additional buying pressure towards the 0.6900 level.
The above image shows how the price formed a regular divergence with MACD and moved above the dynamic weekly VWAP with strong bullish pressure. The most recent intraday high volume level is at 0.7090 area and above the current price.
Therefore, based on the intraday price structure, the bullish possibility of this pair towards the 0.6800 level is valid as long as the price trades above the dynamic 20 EMA and weekly VWAP. On the other hand, a break below the 0.6700 level would open rooms for testing the 0.6600 area in the coming hours.
As per the current market condition, NZDUSD’s bearish pressure is still strong, where a small correction is pending. Therefore, any intraday buying pressure from 0.6750 to 0.6800 would be a buying opportunity in this pair. On the other hand, the near term resistance level is at 0.6836 and 0.6950 from where a bearish pressure may come, depending on how the price reacts.


